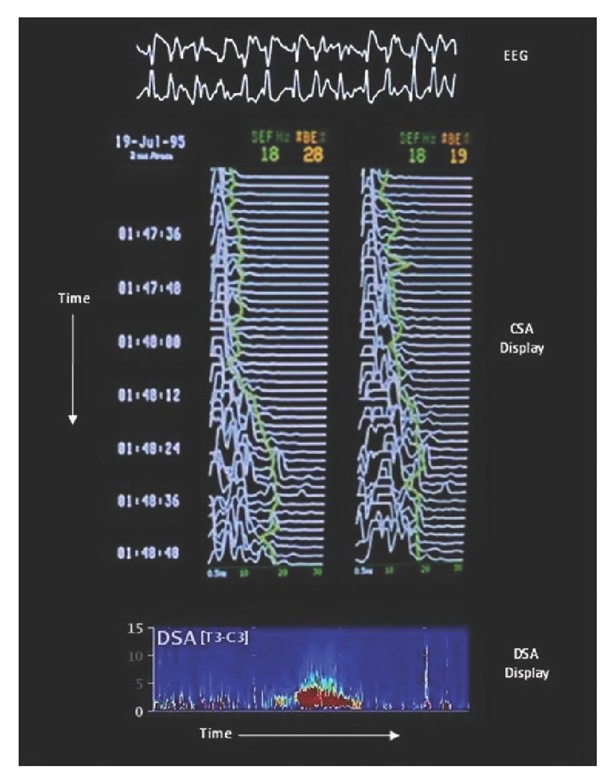
Fig. 8.7. EEG, compressed spectral array (CSA)and density spectral array (DSA) displays showing a seizure. A segment of the raw EEG during the seizure shown at the top and the spectral edge frequency (described in Table 8.4) is plotted on top of the CSA. At the bottom of the figure, a horizontal DSA display shows a seizure as the bright coloured area in the centre of the DSA.
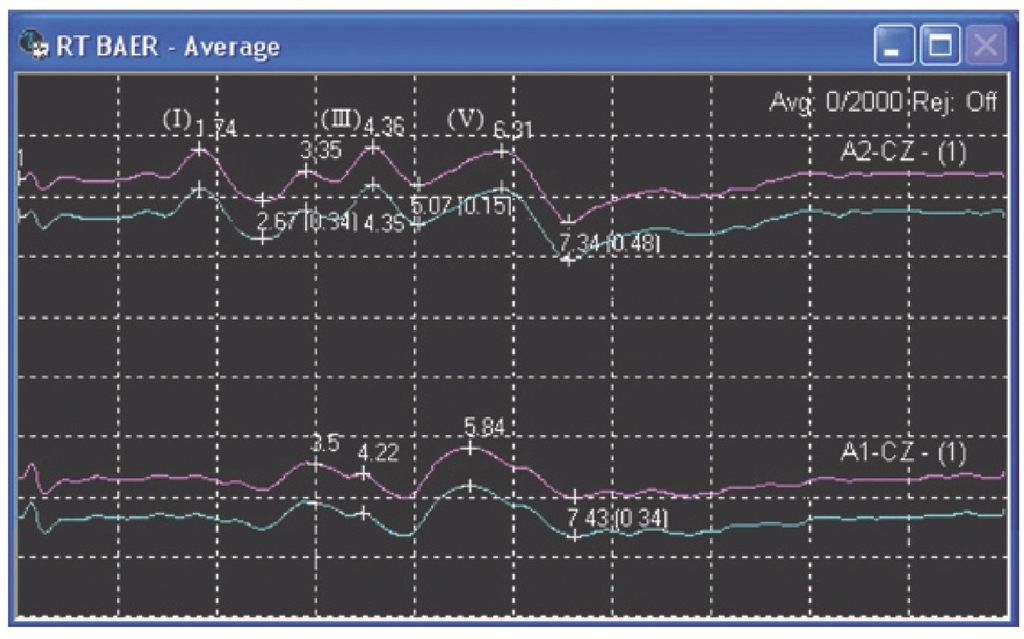
Fig. 8.9. Right brainstem auditory evoked response (BAER) recorded from ipsilateral A2-Cz and contralateral A1-Cz in a propofol-sedated patient. Waves I, III and V from the ipsilateral (to the stimulus) side are shown.
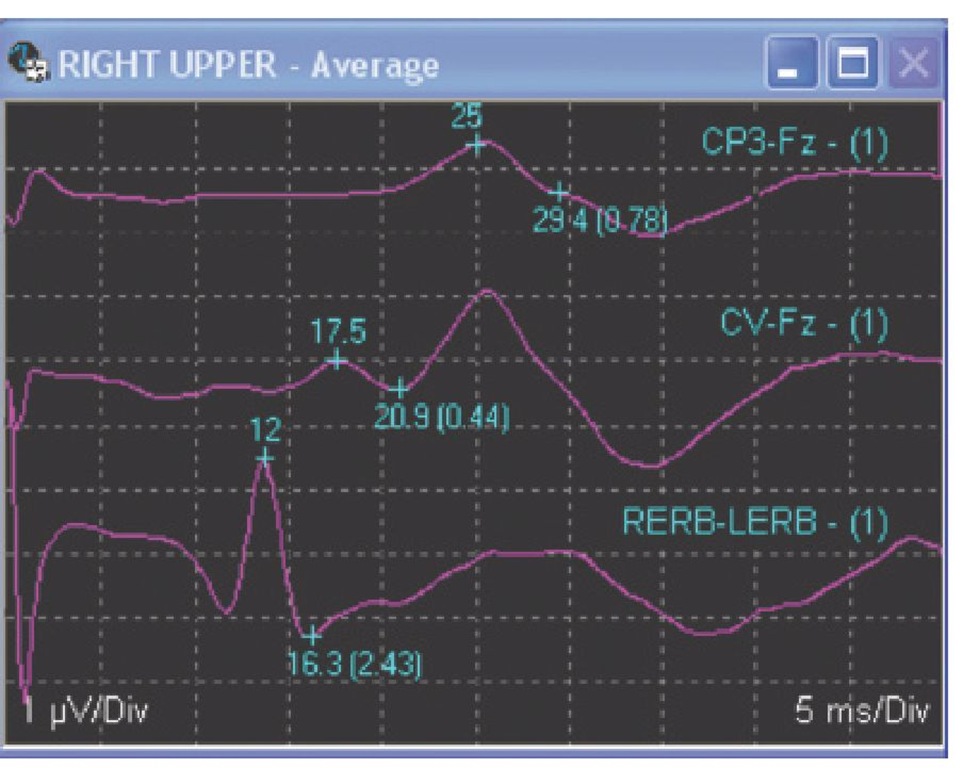
Fig. 8.10. Right upper-extremity somatosensory evoked potential (SSEP) recorded from Erb’s point, C5 cervical spine and the left somatosensory cortex in a propofol-sedated patient. Note that the peripheral response (at the brachial plexus recorded at Erb’s point) is delayed to 12 ms instead of the normal 9 ms. This delay shifts the subsequent peaks out by 3 ms and is most probably due to a peripheral neuropathy, but could also be due to a very long arm or a cold arm.
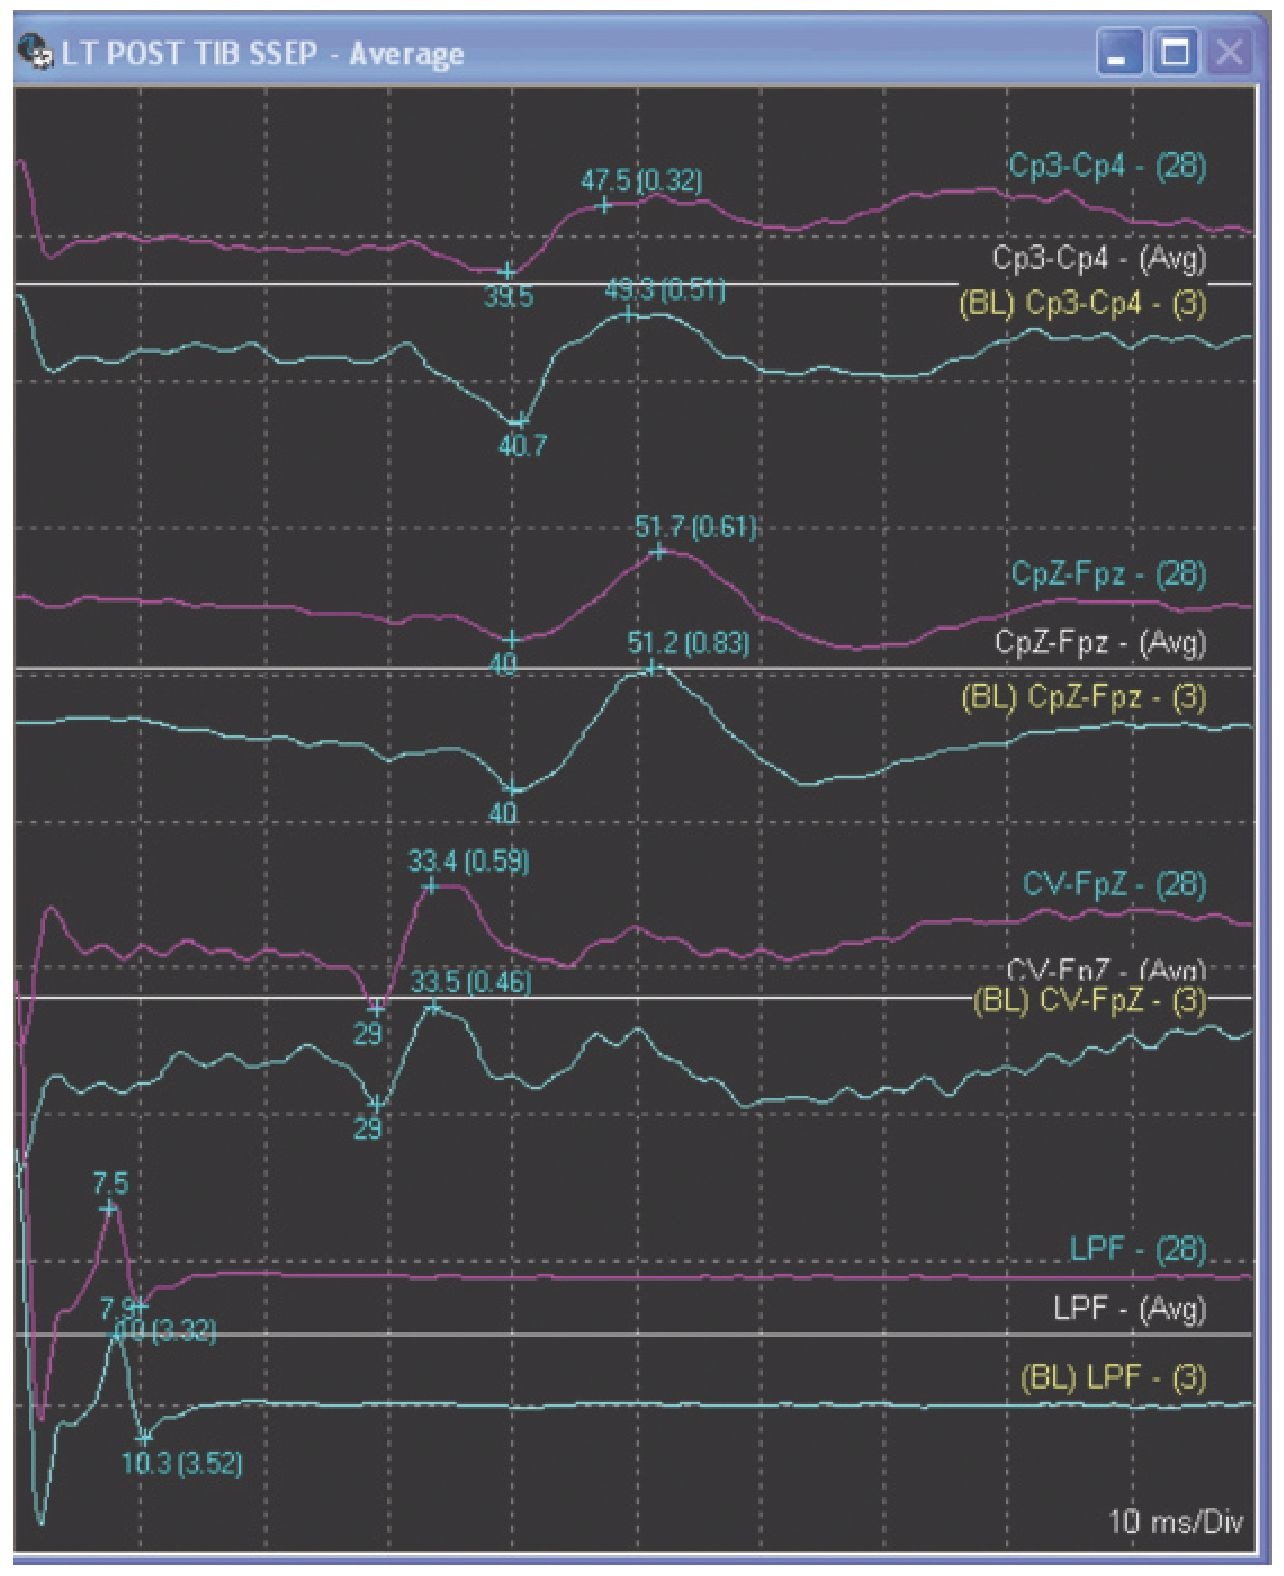
Fig. 8.11. Lower-extremity somatosensory evoked potential (SSEP), showing a peripheral response recorded from the popliteal fossa, a subcortical response recorded at the cervical spine and a cortical response recorded at the somatosensory cortex in a propofol-sedated patient.
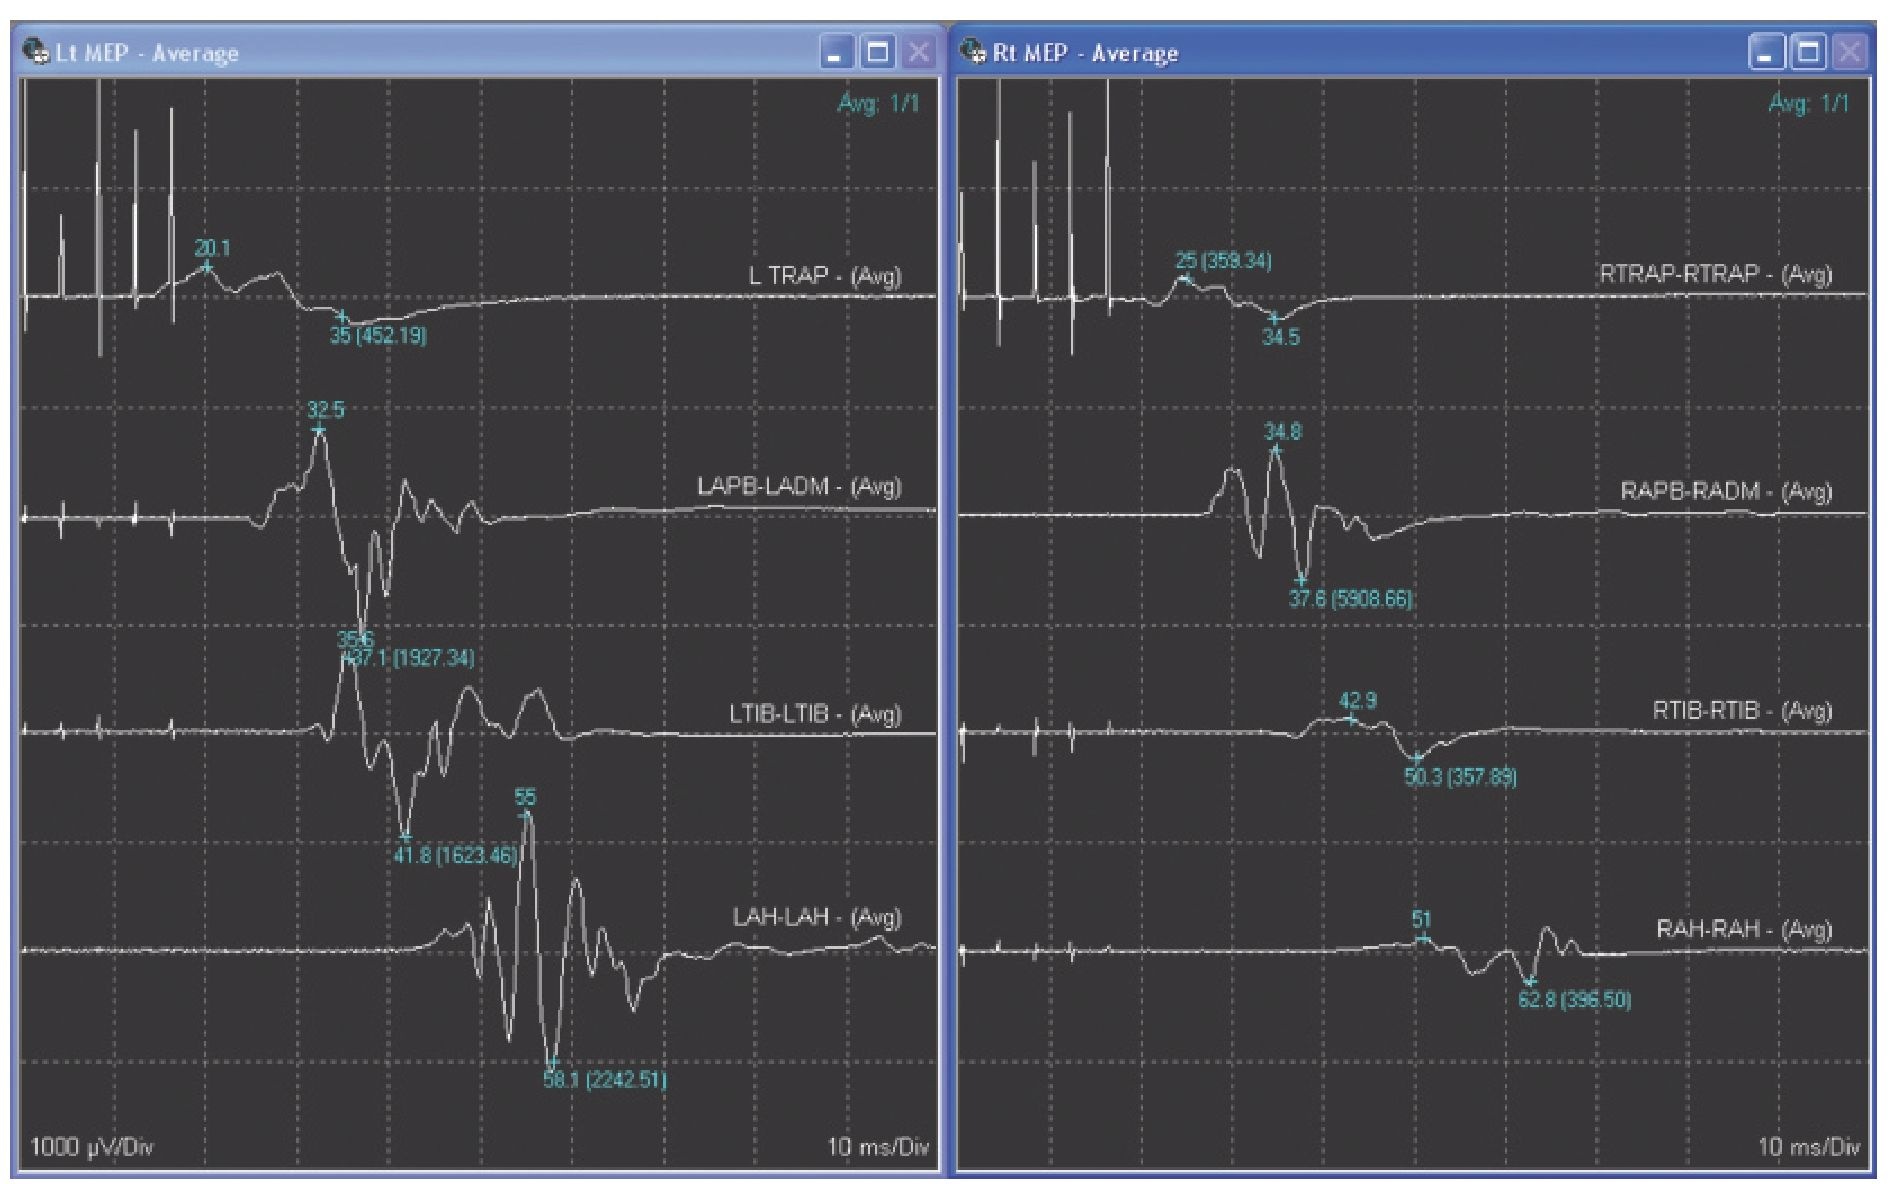
Fig. 8.12. Transcranial electrical motor evoked potentials (TceMEPs), recorded from left and right target muscles – the trapezius (TRAP) and abductor pollicis brevis (APB) in the upper extremities, tibialis anterior (TIB) in the lower extremities and abductor hallucis (AH) in the feet.
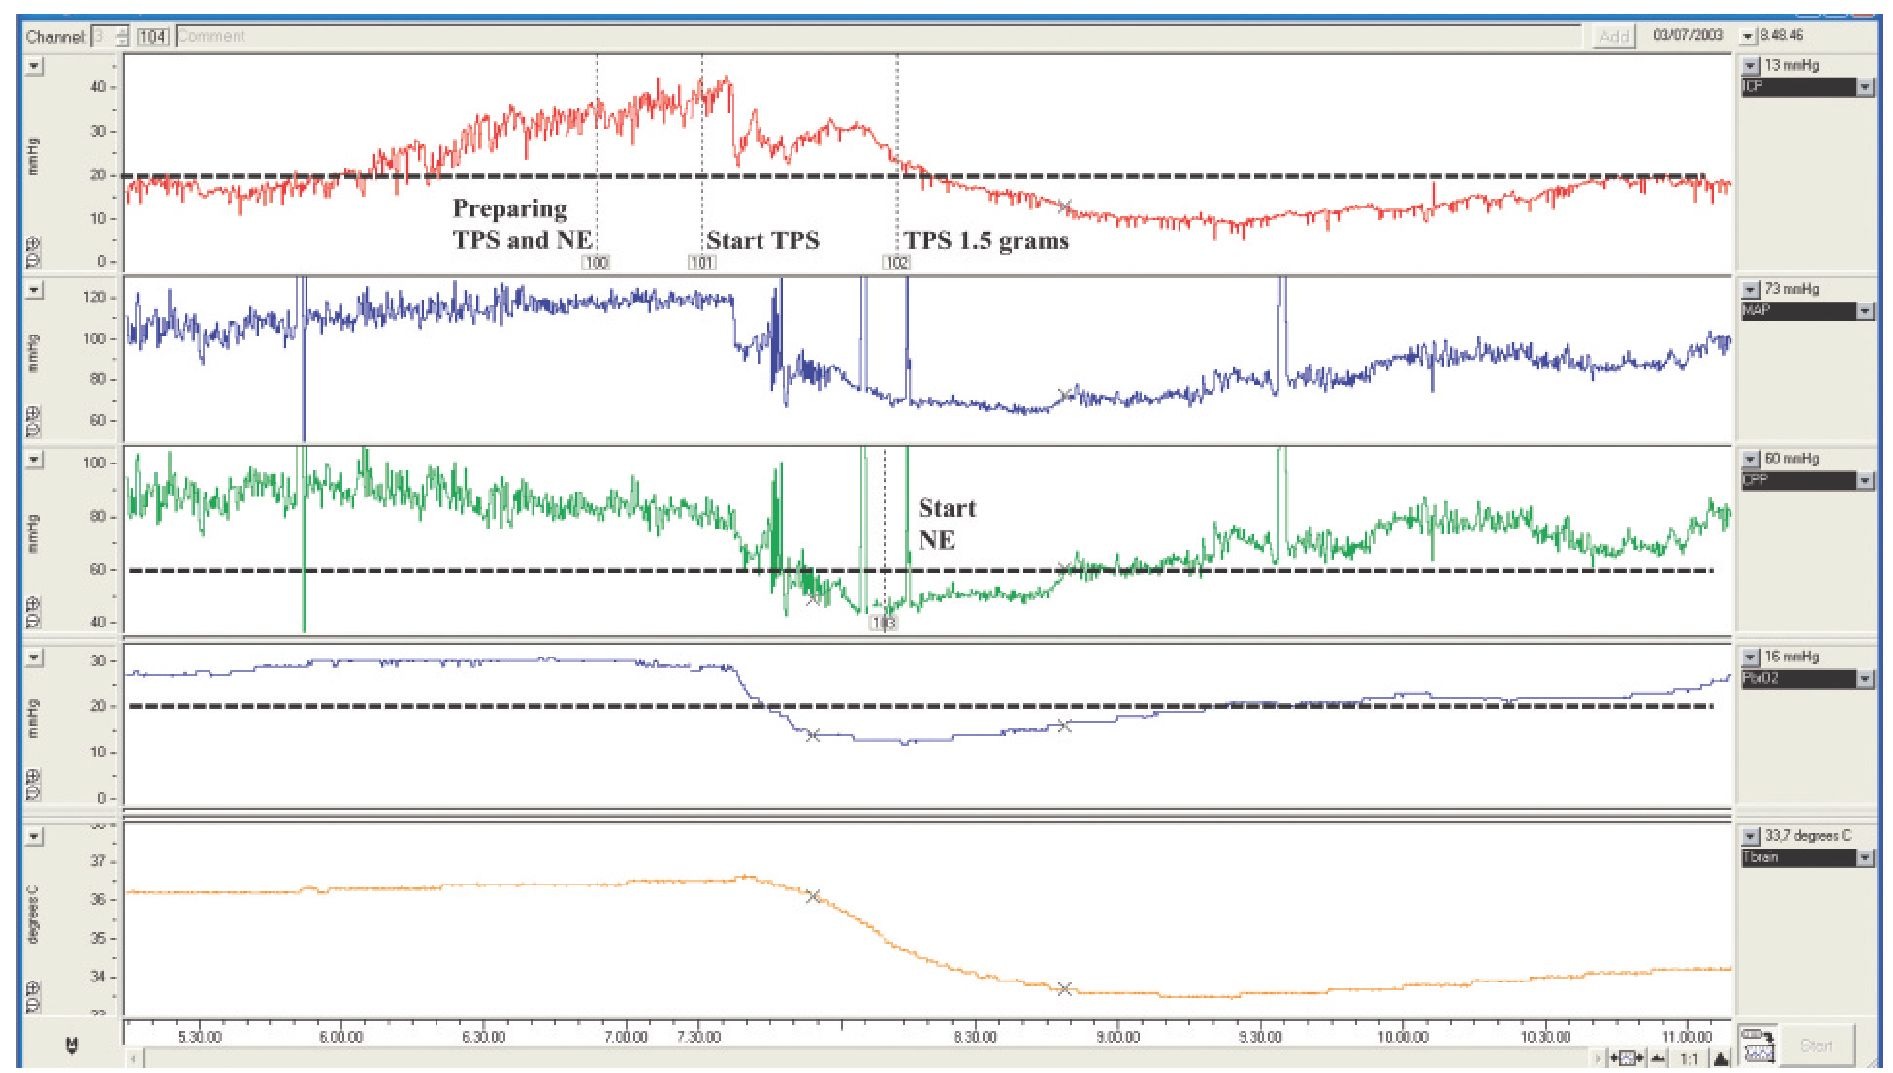
Fig. 9.1. Chart showing the changes in ICP, CPP, brain tissue oxygen tension (PbrO2) and brain temperature (measured in the vicinity of a hypodense lesion) during barbiturate induction for the treatment of raised ICP. Thiopental effectively lowered ICP but induced a CPP reduction and an associated regional brain hypoxia that was corrected using norepinephrine. In this patient, these data showed the CPP threshold required to ensure an adequate brain oxygenation in a vulnerable area of the brain. TPS, thiopental; NE, norepinephrine.
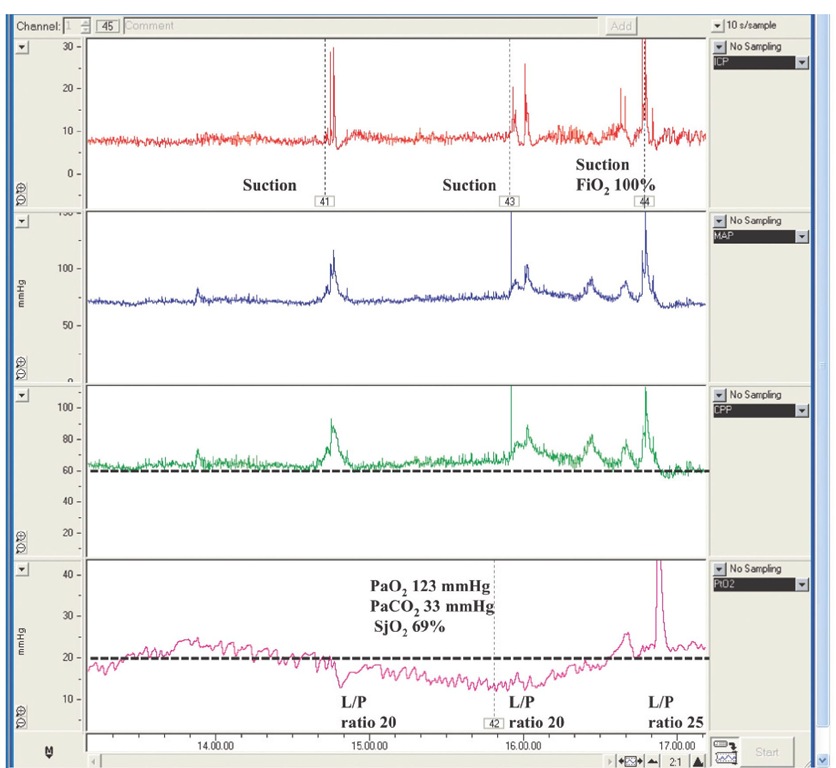
Fig. 9.2. Chart showing the occurrence of an episode of transient regional brain hypoxia (brain tissue oxygen tension (PbrO2) measured in normal-appearing tissue) with no apparent cause and with spontaneous resolution. Cerebral perfusion pressure was stable and remained above the threshold of 60 mmHg, arterial partial pressure of oxygen (PaO2)was adequate and PaCO2 was in the range of mild hyperventilation. Jugular bulb oxygen saturation (SjO2) was normal. The episode was followed by an increase in lactate/pyruvate (L/P) ratio measured in the corresponding area from 20 to 25. At follow-up CT scan, no ischaemic changes were observed in the monitored area. These data highlight the complexity of understanding the pathophysiology of regional oxygenation and integrating it with other physiological variables. FiO2, fraction of inspired oxygen.
