Introduction
Management strategies for the prevention of secondary brain injury are based on maintaining the cerebral perfusion pressure. Anaesthetic and surgical interventions alter cerebrovascular physiology profoundly; hence, a good understanding of these changes is crucial to limit the damage following a brain injury. he brain is unique with a high metabolic rate, and its oxygen demand exceeds that of all organs except the heart. It is approximately 2% of body mass and receives 20% of the basal oxygen consumption and 15% of the resting cardiac output (700 ml min-1 in the adult).
Mean resting cerebral blood flow (CBF) in young adults is about 50 ml (100 g brain tissue)-1 min-1. his mean value represents two very different categories of flow: 70 and 20 ml (100 g)-1 min-1 for grey and white matter, respectively. Regional CBF (rCBF) and glucose consumption decline with age, along with marked reductions in brain neurotransmitter content, and less consistent decreases in neurotransmitter binding.
Applied anatomy of the cerebral circulation
Arterial supply
he blood supply to the brain originates from dorsal aorta, provided by the common carotid arteries, which branch into internal carotid arteries; and the basilar artery, formed by the union of the two vertebral arteries, which are branches of the subclavian artery. he anastomoses between these two sets of vessels give rise to the circle of Willis.
Anatomical variations and significance
From MRI and cadaveric studies, the ‘normal’ polygonal anastomotic ring is present in 40-50% of brains and is often incomplete in younger individuals and women. he presence of anatomical variants may substantially modify patterns of infarction following large-vessel occlusion. For example, in some individuals, the proximal part of one anterior cerebral artery is hypoplastic, and flow to the ipsilateral frontal lobe is provided largely by the contralateral anterior cerebral, via the anterior communicating artery. Occlusion of the single dominant anterior cerebral in such a patient may result in massive infarction of both frontal lobes: the unpaired anterior cerebral artery syndrome. In other patients, the posterior cerebral artery is the direct continuation of the posterior communicating artery, instead arising primarily from the basilar artery – a pattern that mimics the fetal pattern of circulation. In this setting, an internal carotid occlusion will result in a pan-hemispheric infarct.
Global cerebral ischaemia, such as that associated with systemic hypotension, classically produces maximal lesions in areas where the zones of blood supply from two vessels meet, resulting in ‘watershed’ infarctions, for example, following low flow states during car-diopulm onary bypass.
Venous drainage
he brain is drained by small veins, which join to form the pial veins; these coalesce to form the intra- and extracerebral venous sinuses, which are endothelial-ized folds of dura. hese sinuses drain into the internal jugular veins, which, at their origin, receive minimal contributions from extracerebral tissues.
Measurement of oxygen saturation in the jugular bulb (SjO2) provides a means of indirectly assessing the brain’s ability to extract and metabolize oxygen. It has been suggested that the supratentorial compartment is preferentially drained by the right internal jugular vein, while the infratentorial compartment is preferentially drained by the left internal jugular vein. However, more recent data suggest considerable interindividual variation in cerebral venous drainage.
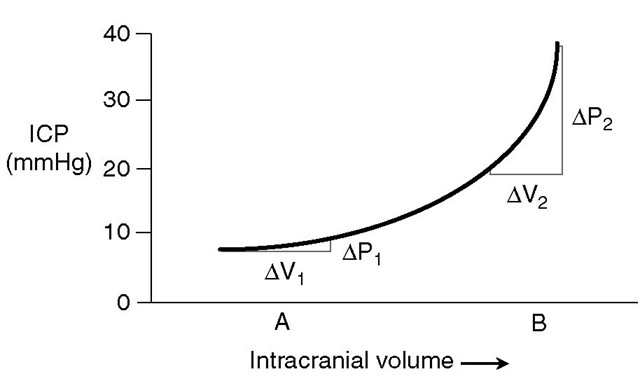
Fig. 2.1. An intracranial pressure (ICP)-volume curve. The curve shows the relationship between intracranial volume and ICP. Note that increases in intracranial volume produce a small change in intracranial pressure (AV, and AP„ respectively) when initial intracranial volume is low and compensatory mechanisms are not exhausted. However, when compensatory mechanisms are exhausted, similar increases in intracranial volume (AV2) result in large increases in ICP (AP2).
Cerebral blood volume: applied physiology and potential for therapeutic interventions
Most of the intracranial blood volume of about 200 ml is contained in the venous sinuses and pial veins, which constitute the capacitance vessels of the cerebral circulation; passive reduction in this volume can buffer rises in the volume of other intracranial contents (the brain and cerebrospinal fluid (CSF)). Conversely, when compensatory mechanisms to control intracra-nial pressure (ICP) have been exhausted, even small increases in cerebral blood volume (CBV) can result in steep rises in ICP (Fig. 2.1). he position of the system on this curve can be expressed in terms of the pressure-volume index (PVI), which is defined as the change in intracranial volume that produces a tenfold increase in ICP. his is normally about 26 ml, but may be markedly lower in patients with intracranial hypertension, who are on the steep part of the intracranial pressure-volume curve.
With the exception of oedema reduction by man-nitol, the only intracranial constituent whose volume can readily be modified by physiological or pharmacological interventions is the parenchymal CBV, whose volume is set by vasomotor tone. Although the CBV forms only a small part of the intracranial volume, and such interventions produce only small absolute changes (typically ~10 ml or less), they may result in marked reductions in ICP in the presence of intracra-nial hypertension.
Conversely, inappropriate clinical management may cause the CBV to increase. Again, although the absolute magnitude of such an increase may be small, it may result in steep rises in ICP in the presence of intracranial hypertension. he appreciation that pharmacological and physiological modulators may have independent effects on CBV and CBF is important for two reasons. Interventions aimed at reducing CBV in patients with intracranial hypertension may have prominent effects on CBF and result in cerebral ischaemia. Conversely, drugs that produce divergent effects on CBF may have similar effects on CBV, and using CBF measurement to infer effects on CBV and hence ICP may result in erroneous conclusions.
The cerebral microcirculation
The cerebral microcirculation is defined arbitrarily as the blood vessels of diameter <100 |xm. he cerebrovascular microarchitecture is highly organized and follows the columnar arrangement seen with neuronal groups and physiological functional units. Pial surface vessels give rise to arterioles that penetrate the brain at right angles to the surface and give rise to capillaries at all laminar levels. Each of these arterioles supplies a hexagonal column of cortical tissue, with intervening boundary zones, an arrangement that is responsible for the columnar patterns of local blood flow, redox state and glucose metabolism seen in the cortex during hypoxia or ischaemia. Capillary density in the cortex is one-third of adult levels at birth, doubles in the first year and reaches adult levels at 4 years. At maturity, capillary density is related to the number of synapses, rather than the number of neurons or mass of cell bodies in a given region, and can be closely correlated with the regional level of oxidative metabolism. he cerebral circulation is protected from systemic blood pressure surges by a complex branching system and two resistance elements: the first of these lies in the large cerebral arteries, and the second in vessels of diameter <100 ^m.
The blood-brain barrier
Endothelial cells in cerebral capillaries contain few pinocytic vesicles and are sealed with tight junctions, without any anatomical gap. Consequently, unlike other capillary beds, the endothelial barrier of cerebral capillaries presents a high electrical resistance and is remarkably non-leaky, even to small molecules such as mannitol. his property of cerebral vasculature is termed the blood-brain barrier (BBB), and resides in its cellular components (the endothelial cell, astrocyte and pericyte) and its non-cellular structures (the endothelial basement membrane). A fundamental difference between brain endothelial cells and the systemic circulation is the presence of interendothelial tight junctions termed the zona occludens.
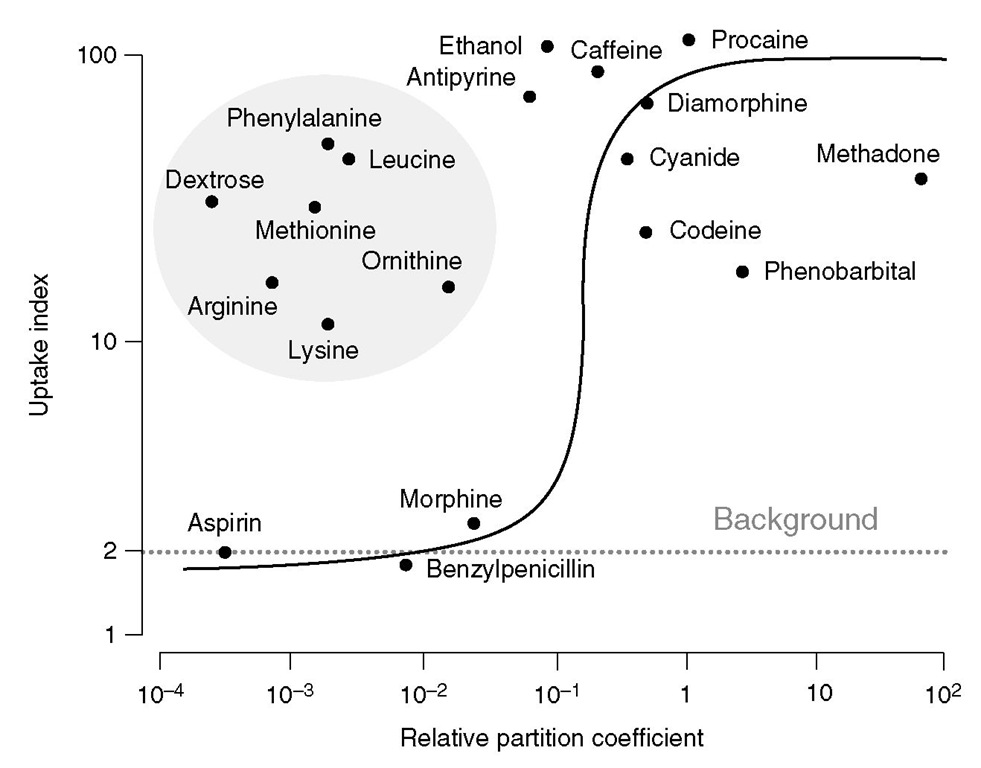
Fig. 2.2. Correlation between brain uptake index and oil/water partition coefficients for different substrates. While blood-brain barrier permeability, in general, increases with lipid solubility, note that several substances including glucose and amino acids show high penetration due to active transport or facilitated diffusion.
The BBB is a function of the cerebral microenvir-onment rather than an intrinsic property of the vessels themselves, as leaky capillaries from other vascular beds develop a BBB if they are transplanted into the brain or are exposed to astrocytes in culture. Passage through the BBB is not simply a function of molecular weight; lipophilic substances traverse the barrier relatively easily, and several hydrophilic molecules (including glucose) cross the BBB via active transport systems to enter the brain interstitial space (Fig. 2.2). In addition, the BBB maintains a tight control of relative ionic distribution in the brain extracellular fluid. hese activities require energy and account for the high mitochondrial density in these endothelial cells, accounting for up to 10% of cytoplasmic volume. Several endogenous substances including catecholamines and vascular growth enhancing factor can dynamically modulate BBB permeability. Although the BBB is disrupted by ischaemia, this process takes hours to days rather than minutes, and much of the cerebral oedema seen in the initial period after ischaemic insults is cytotoxic rather than vasogenic. Consequently, mannitol retains its ability to reduce cerebral oedema in the early phases of acute brain injury.
Physiological determinants of regional cerebral blood flow and cerebral blood volume
The concept of cerebral perfusion pressure
Hie driving pressure in most organs is the difference between arterial and venous pressure. However, in the brain, the downstream pressure is not the jugular venous pressure but the ICP. his is because the brain lies in a closed cavity, and when ICP is elevated, it results in collapse of the bridging pial veins and venous sinuses, which then act as Starling resistors. Consequently, the cerebral perfusion pressure (CPP) is defined as the difference between mean arterial pressure (MAP) and mean ICP:
CPP = MAP – ICP
Autoregulation
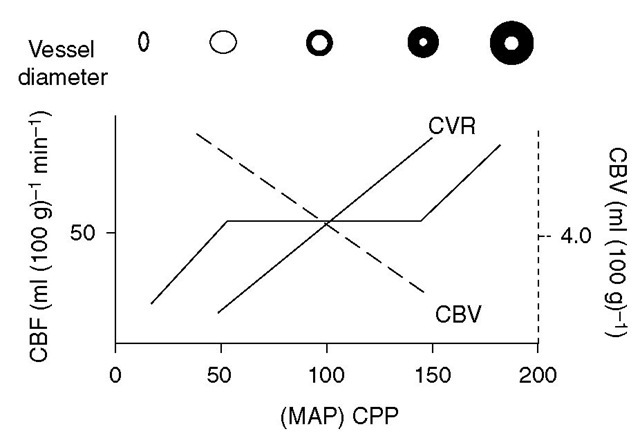
Autoregulation refers to the ability of the cerebral circulation to maintain CBF at a relatively constant level during despite changes in CPP, by altering cerebrovas-cular resistance (CVR) (Fig. 2.3).
Fig. 2.3. Cerebrovascular resistance (CVR) changes in response to changes in the cerebral perfusion pressure (CPP) to maintain the cerebral blood flow (CBF). Cerebral vasodilation, and thus a decrease in CVR, maintains CBF with reductions in the CPP. This increases cerebral blood volume (CBV), which results in critical increases in intracranial pressure in patients with poor compliance (steep part of pressure-volume curve). MAP, mean arterial pressure.
Static and dynamic autoregulation and their assessment
Classical cerebral autoregulation assessment does not consider the latency of autoregulatory mechanisms, focusing instead on the maintenance of CBF at different steady state levels of CPP (produced by vasopressors or postural alterations). Such measurement provides an indication of the efficiency of static autoregulation but does not address the time taken to re-establish baseline blood flow in response to a CPP alteration. his latency is assessed by techniques that specifically target dynamic autoregulation. One technique that is commonly used to assess dynamic autoregulation is transcranial Doppler ultrasonography (TCD), which quantifies real-time changes in beat-by-beat blood flow velocity in large cerebral arteries (typically the middle cerebral artery), following a range of interventions. One intervention is the production of a rapid drop in blood pressure by rapid deflation of a thigh cuff. An alternative is to measure the response middle cerebral artery fl ow velocity following a short period (3-5 s) of carotid compression – the transient hyper-aemic response test (THRT). An increase in flow velocity during the recovery phase to suprabaseline levels is a marker of post-ischaemic hyperperfusion and suggests effective dynamic autoregulation. Some studies suggest that, especially in patients with impaired autoregulation, the cardiac output and pulsatility of large-vessel flow may be more important determinants of rCBF than CPP itself.
Mechanisms of autoregulation
While autoregulation is maintained irrespective of whether changes in CPP arise from alterations in MAP or ICP, it tends to be preserved at lower levels when falls in CPP are due to increases in ICP rather than decreases in MAP due to hypovolaemia. One possible reason for this may be the vasoconstrictive effects of catecholamines secreted in haemorrhagic hypotension, as lower MAP levels are tolerated in hypotension if the fall in blood pressure is induced by sympatholytic agents or occurs in the setting of autonomic failure. Autoregulatory changes in CVR probably arise from myogenic reflexes in resistance vessels, but these may be modulated by activity of the sympathetic system or the presence of chronic systemic hypertension. hus, sympathetic blockade or cervical sympathectomy shifts the autoregulatory curve to the left, while chronic hypertension or sympathetic activation shifts it to the right. hese modulatory effects may also arise from angiotensin-mediated mechanisms. Animal studies, although inconclusive, suggest the importance of nitric oxide in this context. In reality, the clear-cut autoreg-ulatory thresholds seen with varying CPP in Fig. 2.3 above are not observed; the autoregulatory ‘knees’ tend to be m ore gradual, and there may be wide variations in rCBF at a given value of CPP in experimental animals and even in neurologically normal individuals.
What are the safe limits for autoregulation?
It has been demonstrated that symptoms of cerebral ischaemia appear when the MAP falls below 60% of an individual’s lower autoregulatory threshold. However, generalized extrapolation from such individualized research data to the production of ‘safe’ lower limits of MAP for general clinical practice is hazardous for several reasons. Firstly, there may be wide individual scatter in rCBF autoregulatory efficiency, even in normal subjects. For example, the efficiency of cerebral autoregulation declines with age, causing postural syncopal attacks. Secondly, the coexistence of fixed vascular obstruction (e.g. carotid atheroma or vascular spasm) may vary the MAP level at which rCBF reaches critical levels in relevant territories. hirdly, the autoregulatory curve may be substantially modulated by mechanisms used to produce hypotension. Earlier discussion made the distinction between reductions in CPP produced by haemorrhagic hypotension, intracranial hypertension and pharmacological hypotension. he effects on autoregulation may also vary with the pharmacological agent used to produce hypotension. hus, neuronal function is better preserved at similar levels of hypotension produced by halothane, nitroprusside or isoflu-rane in comparison with trimethaphan. Fourthly, the efficiency of autoregulation is compromised by disease, and dysautoregulation is associated with poor outcomes in traumatic brain injury (TBI), subarachnoid haemorrhage and after return of spontaneous circulation following cardiac arrest. Finally, autoregulatory responses are not immediate: estimates of the latency for compensatory changes in rCVR range from 10 to 60 s.


