Flow-metabolism coupling
Increases in local neuronal activity are accompanied by increases in regional cerebral metabolic rate (rCMR). Until recently, increases in rCBF and oxygen consumption produced during such functional activation were thought to be closely coupled to the CMR of utilization of oxygen (CMRO2) and glucose (CMRglu).
Clinical implications for flow metabolism: functional assessment of the brain
Functional activation in the brain results in capillary recruitment, as in other tissues. In the resting state, capillary flow is heterogeneous, and, as activation results in increased CBF, flow becomes more homogeneous across the capillary network. his mechanism is important for substrate transport across the BBB. However, some authorities still argue that all capillaries may be persistently open, and that ‘recruitment’ involves changes in capillary flow rates with hom-ogenization of the perfusion rate in a network. here is a consistent ratio of about 5.6 between glucose and oxygen uptake in the resting brain. Increases in rCBF during functional activation tend to track glucose utilization but may be far in excess of the increase in oxygen consumption. Despite this revision of the proportionality between increased rCBF and CMRO2 during functional activation, the relationship between rCBF and CMRglu is still linear, and glucose consumption is tightly coupled to neurotransmitter recycling and restoration of neuronal membrane potentials. However, the disproportionate increase in glucose utilization leads to regional anaerobic glucose utilization, with a consequent local decrease in oxygen extraction ratio and increase in local haemoglobin saturation. The resulting local decrease in deoxyhaemoglobin levels provides the basis for functional neuroimaging using blood oxygenation level-dependent functional MFR (BOLD-fMRI; Fig. 2.4).
Fig. 2.4. Functional MRI ofthe brain for activation during spoken words. The blood oxygenation level-dependent (BOLD) contrast that is used to produce this image depends on the mismatch between increases in cerebral blood flow (CBF) and oxygen utilization during functional brain activation. The increase in CBF in excess of instantaneous oxygen utilization drops local deoxyhaemoglobin levels and increases the MR signal.
Other factors that alter flow-metabolism coupling
Use of anaesthetic agents and insults such as TBI alter flow-metabolism coupling. In TBI, flow may be uncoupled from metabolism; where blood flow is inadequate, ischaemia results, and where it is excessive, hyperaemia occurs. he efficiency of flow-metabolism coupling can also be modulated by hypo- and hyperthermia, seizures, sedation and by drugs that act directly on cerebrovascular tone (such as volatile anaesthetic agents or vasodilators).
Role of glial cells and the blood-brain barrier in flow-metabolism coupling
The brain is well organized into neurovascular units including neurons, glial cells and the cerebral micro-vasculature. Glial cells may be microglia, astrocytes and oligodendrocytes. he integration of neurovas-cular units is important for the maintenance of cerebral autoregulation and flow-metabolism coupling. Because of the large surface area contributed by the glial cells and the BBB (~20 m2 per 1.3 kg brain), the glial/endothelial interface has an important role in regulating the brain microenvironment and blood flow.
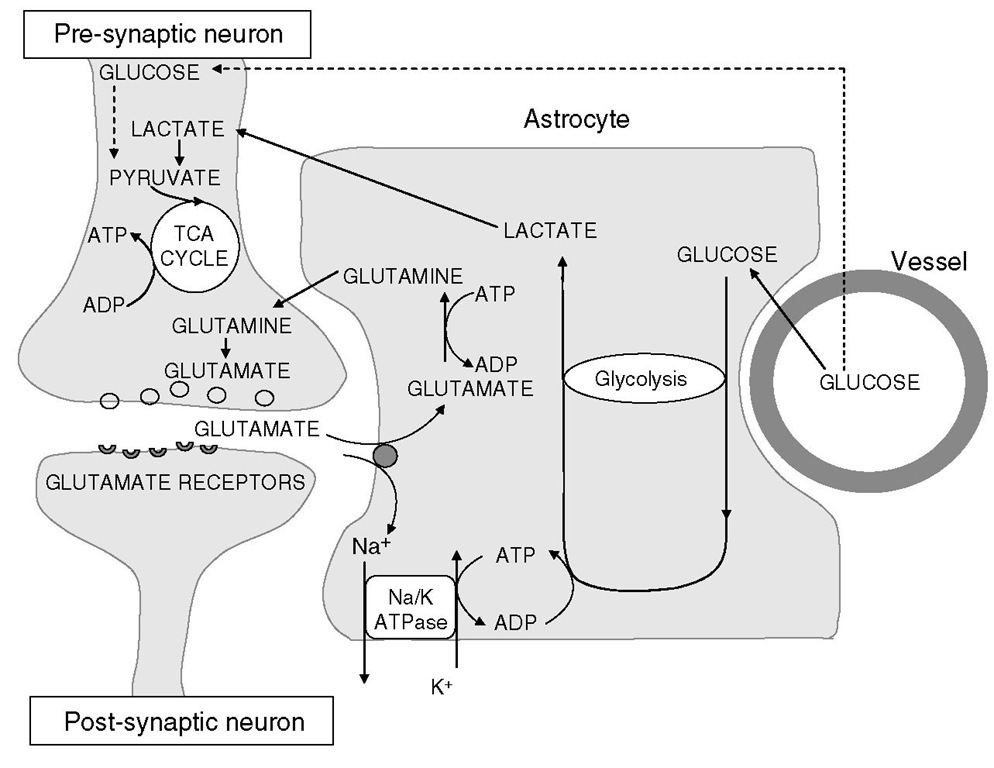
Fig. 2.5. Relationship of astrocytes to oxygen and energy metabolism in the brain. Glucose taken up by astrocytes undergoes glycolysis for generation of ATP to meet astrocytic energy requirements (for glutamate reuptake, predominantly). The lactate that this process generates is shuttled to neurons, which utilize it aerobically in the citric acid cycle.
Astrocytes are multifunctional cells that perform various functions in various sites. Suggested cellular mechanisms by which astrocytes regulate cerebral metabolism (and hence CBF) are the glycolytic utilization of glucose with lactate production and maintenance of potassium homeostasis. Astrocytic glucose utilization and lactate production appear to be, in large part, coupled by the astrocytic reuptake of glutamate released at excitatory synapses, and the lactate produced by astrocytic glycolysis serves as a substrate for neuronal oxidative metabolism (Fig. 2.5).
The regulatory changes involved in flow-metabolism coupling that have a short latency (~1 s) are mediated either by metabolic or neurogenic pathways. he metabolic control is exerted by increases in perivascu-lar potassium (regulated and m aintained by astrocytes) or adenosine concentrations that follow neuronal depolarization. Neuronal control is enforced by a rich supply of nerve fibres. he mediators thought to play an important part in neurogenic flow-metabolism coupling are acetylcholine and nitric oxide, although roles have also been proposed for 5-hydroxytryptamine, substance P and neuropeptide Y.
Neurovascular modulation of cerebral circulation
Cerebral blood vessels receive an abundant nerve supply from the central and peripheral nerves. Autonomic and sensory supply arises from the sphenopalatine, trigeminal and superior cervical ganglia, innervating the extracranial and intracranial cerebral arteries. Xhe dopaminergic neurons surrounding the large pial and penetrating vessels regulate the blood flow and are stimulated by the release of dopamine during nerve stimulation. his dopaminergic modulation may be important in the regulation of the blood flow during functional activation of the brain. he autonomic nervous system mainly affects tone in the larger cerebral vessels, up to and including the proximal parts of the anterior, middle and posterior cerebral arteries. P2-Adrenergic stimulation results in vasodilation while a2-adrenergic stimulation vasoconstricts these vessels. he effect of systemically administered a- or ^-agonists is less significant. However, significant vasoconstriction can be produced by extremely high concentrations of catecholamines (e.g. in haemorrhage) or centrally acting a2-agonists (e.g. dexmedetomidine).
Arterial carbon dioxide tension
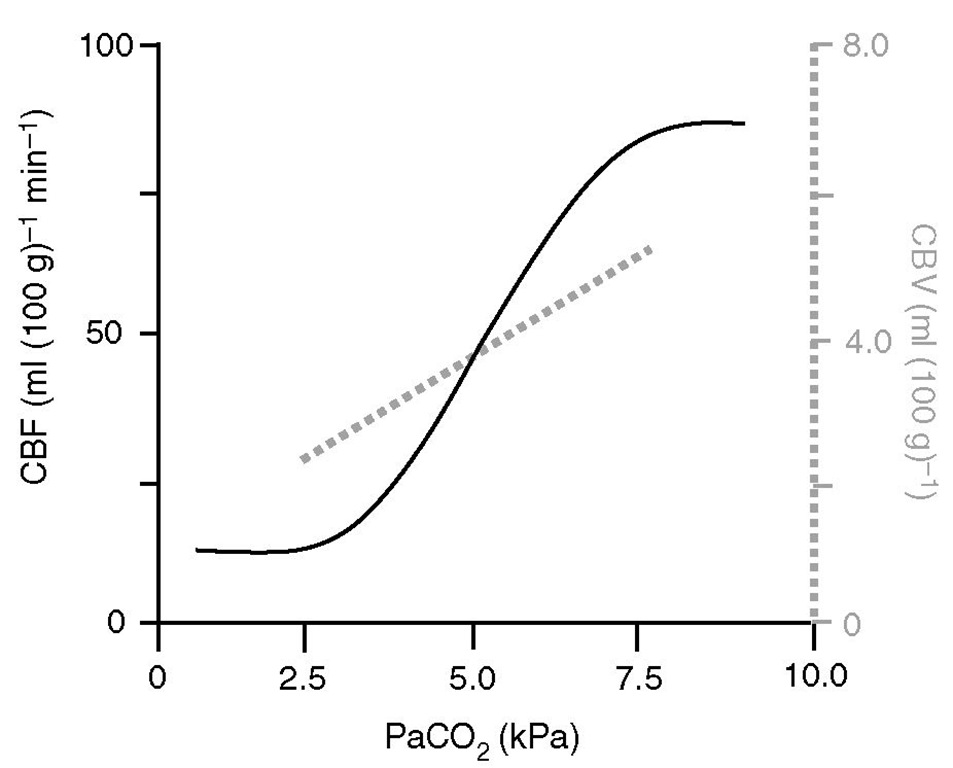
Cerebral blood flow is proportional to arterial carbon dioxide tension (PaCO2), subject to a lower limit below which vasoconstriction results in tissue hypoxia and reflex vasodilation, and an upper limit of maximal vasodilation (Fig. 2.6). On average, in the middle of the physiological range, each kPa change in PaCO2 produces a change of about 15 ml (100 g)-1 min-1 in CBF.
Fig. 2.6. Relative effects of PaCO2 on cerebral blood flow (CBF) and cerebral blood volume (CBV). Hyperventilation is aimed at reducing CBV in patients with intracranial hypertension but may be detrimental because of its effects on CBF. Note that the slope of CBF reactivity to PaCO2 is steeper than that for CBV (~25 vs. ~20% per kPa PaCO2, respectively).
However, the slope of the PaCO2/CBF relationship depends on the baseline normocapnic rCBF value, being maximal in areas where it is high (e.g. grey matter: cerebrum) and least in areas where it is low (e.g. white matter: cerebellum and spinal cord). PaCO2 affects CBF by alteration of the extracellular pH, which, in turn, modulates intracellular calcium. One molecule implicated in part is nitric oxide (NO), which increases cyclic GMP (cGMP) and activates potassium channels directly, causing hyperpolarization and inhibiting voltage-gated calcium channels causing vasodilation. Prostaglandins may also mediate the vasodilation produced by carbon dioxide.
Moderate hypocapnia (PaCO2 = 3.5-4.5 kPa) has long been used to reduce CBV in intracranial hypertension, but this practice is under review for two reasons. he carbon dioxide response is directly related to the change in perivascular pH; consequently, the effect of a change in PaCO2 tends to be attenuated over time (hours) as brain extracellular fluid bicarbonate levels fall to normalize interstitial pH. Secondly, it has now been shown that ‘acceptable’ levels of hypocapnia in head-injured patients can result in dangerously low rCBF levels.
Effects ofarterial carbon dioxide tension on cerebral blood volume and intracranial pressure
Grubb and colleagues studied the CBF/PaCO2 response curve in primates and demonstrated that CBF changed by approximately 1.8 ml (100 g)-1 min-1 for each mmHg change in PaCO2. However, in the same experiment, the CBV/PaCO2 curve was much flatter (about 0.04 ml (100 g)-1 per mmHg change (0.3 ml 100 g-1 kPa-1) in PaCO2). It follows from these figures that, while a reduction in PaCO2 from 40 to 30 mmHg (5.3 to 4 kPa) would result in about a 40% reduction in CBF (from a baseline of about 50 ml 100g-1 min-1), it would result in a 0.4% reduction in intracranial volume. his may seem trivial, but, in the presence of intracranial hypertension, the resultant 5 ml decrease in intra-cranial volume could result in a halving of ICP, as the system operates on the steep part of the intracranial compliance curve.
PaO2 and CaO2
The classical teaching is that CBF is unchanged until PaO2 levels fall below approximately 7 kPa but rises sharply with further reductions. However, TCD data from humans suggests cerebral thresholds for cerebral hypoxic vasodilation as high as 8.5 kPa (~89-90% arterial oxygen saturation (SaO2)). his non-linear behaviour is because tissue oxygen delivery governs CBF, and the sigmoidal shape of the haemoglobin-O2 dissociation curve means that the relationship between CaO2 (arterial oxygen content) and CBF is inversely linear. hese vasodilator responses to hypoxaemia appear to show little adaptation with time but may be substantially modulated by PaCO2 levels. Nitric oxide does not appear to play a role in the vasodilatory response to hypoxia. Some studies suggest that hyperoxia may produce cerebral vasoconstriction, with a 10-14% reduction in CBF with inhalation of 85-100% O2, and a 20% reduction in CBF with 100% O2 at 3.5 atmospheres. Human data suggest that this effect may not be clinically significant. Chronic hypoxia is a pathophysiological driver in conditions such as chronic obstructive airway disease and obstructive sleep apnoea, and may affect up to 2-4% of the general population. Such intermittent hypoxia accentuates systemic pressor responses, elevates baseline cerebral vascular resistance and may modulate cerebrovascular responses to hypercapnia.
Haematocrit
As in other organs, optimal oxygen delivery in the brain depends on a compromise between oxygen-carrying capacity and the rheological characteristics of blood; previous experimental work suggests that this may be best achieved at a haematocrit of about 40%. In the setting of vasospasm following subarachnoid haemorrhage, studies have suggested that modest haemodilution to a haematocrit of 30-35% may improve neurological outcome by improving rheo-logical characteristics and increasing rCBF. However, this may result in a reduction in oxygen delivery if maximal vasodilation is already present and, as clinical results in the setting of acute ischaemia have not been uniformly successful, this approach must be viewed with caution.
Oxygen extraction ratios and jugular bulb oximetry
Hie cerebral oxygen extraction ratio (OER) is dependent on the balance between oxygen delivery (a product of arterial oxygen content and CBF) and oxygen utilization (CMROt ). he OER changes with functional brain activation, which are the consequences of transient physiological uncoupling of flow and oxygen metabolism, are the basis of BOLD-fMRI contrast (as discussed above). Uncoupling of this balance can also reflect pathophysiology: reductions in CBF result in compensatory increases in OER, so as to maintain CMRO2 . his is manifest in jugular oximetry, with a fall in oxygen saturation providing a useful monitoring tool to detect inadequacy of CBF:
where CjO2 is the jugular venous oxygen content. In the setting of TBI, such jugular desaturation to <50% has been associated with poor outcome.
Measurement of regional cerebral blood flow
All clinical and many laboratory methods of measuring CBF or rCBF are indirect and may not produce directly comparable measurements. It is also important to treat results from any one method with caution and to attribute any observed phenomena to physiological effects only when demonstrated by two or more independent techniques. Methods of measuring CBF may be regional or global, and may be applicable either to humans or primarily to experimental animals. All of these methods have advantages and disadvantages. All methods that provide absolute estimates of rCBF use one of two principles: they either measure the distribution of a tracer or estimate rCBF from the wash-in or wash-out curve of an indicator. Other techniques do not estimate rCBF directly but can be used either to measure a related flow variable (such as arterial flow velocity) or to infer changes in flow from changes in metabolic parameters. hese issues are addressed in detail elsewhere in this topic.


![tmpA2-22_thumb[2] tmpA2-22_thumb[2]](http://what-when-how.com/wp-content/uploads/2012/04/tmpA222_thumb2_thumb.jpg)
