Abstract
Ubiquitous, mobile and wearable networks unified on the internet are rapidly promoted and introduced into our daily living sphere. That means people, unfamiliar to information technology and human computer interaction issue, are becoming a large part of the users of the unified information environment. Thus we need a new concept of information environment design which does not force a person to have and use any computer skills. Such an information environment would provide modest and human friendly manner for users including elderly people.
This paper introduces a concept of Kansei modeling from the aspects of users’ needs in information service. To show its attractive facilities, this paper describes the state of the art of our studies on personal information assistance service in a smart space, such as ubiquitous and wearable environment with robotic information processing mechanism.
Keywords: Kansei Engineering, Kansei Modeling, Behavior Log and Analysis, Smart Shop.
Introduction
Ubiquitous, mobile and wearable net-works unified on the internet are rapidly promoted and introduced into our daily living sphere. That means people, unfamiliar to information technology and human computer interaction issue, are becoming a large part of the users of the unified information environment. Thus we need a new concept of information environment design which does not force a person to have and use any computer skills. Such an information environment would provide modest and human friendly manner for users including elderly people.
This paper introduces a concept of KANSEI modeling from the aspects of users’ needs in information service in topic 2. To show its attractive facilities, this paper describes the state of the art of our studies on personal information assistance service in ubiquitous and wearable environment, in topic 3 and 4, respectively.
Kansei Modeling
Subjective feature of each user’s requirement in information service can be schematically summarized as following [1];
(1) Intuitive perception process of objects: A user may receive some impressions viewing objects. We assume such a process as physical, physiological, psychological and cognitive levels of interpretation. In this process, a portion of the graphical features of an object, such as its colors and their combination, textures and shape, is a dominant factor in his intuitive perception. We can statistically model these relationships between some graphical features of objects and their interpretations [2], [3].
(2) Subjective interpretation of situations: A user may show his intentional choice of assistance services according to his situation, such as time, place and occasion. Even if people physically sharing the same time, place, and occasion, each of them may expect to receive different assist according to his life style. We assume such a process as physical, bottom-up multiple interpretation and top-down service-based levels of interpretation. We can model these relation-ships by statistical behavior log analysis.
(3) Knowledge structure of service domain: Novice users may only have restricted knowledge on a service domain, while the others have much and well organized. Such a difference means each user is expecting his own answer according to his knowledge base in his mind. We can formalize this kind of knowledge structure as ontology. We are also relating subjective concepts on feeling with some graphical features of objects.
(4) Feature of behavior pattern: A user often shows some specific behavior unconsciously according to his interest on something; for instance, if he is interested in some goods, he often watches, touches and grasps them unconsciously to have a closer look at them. Thus, we can statistically analyze a degree of interest on objects by each person’s behavior log [4], [5], [6].
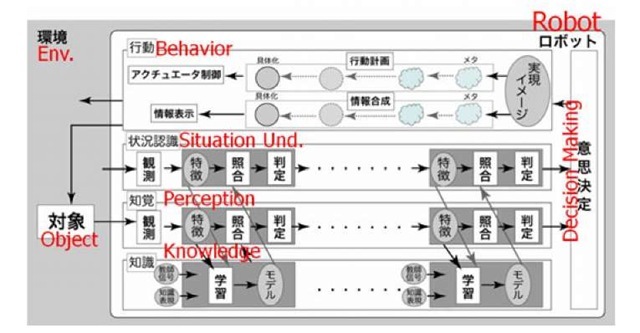
Fig. 1. Schematic model of KANSEI
(5) Tendency of decision making process: A person often makes his own decision pattern according to his view of life, which is originate from his intuitive perception process of objects and subjective interpretation process of situations, which is compared with his knowledge base in his mind, and which cause the difference in his behavior pattern in taking an action.
We can schematically summarize such relationships as shown in Figure 1.
Personal Assistance Service Using Ubiquitous Environment
Kansei Modeling on Personal Preferences: Smart Sphere
Current personal information services highly depend on registered preferring items which are referred as a template of the user’s model. Such systems force their users to answer a huge number of questionnaires to describe the individual preferences. It is a bottleneck in modeling.
Our basic ideas are (1) to find user’s interested and / or preferred items through observation on his behaviors in ubiquitous information environment, (2) to automatically build his preference model, and (3) to apply the model to provide suitable information service in the real world.
Microscopic, mezzoscopic and macroscopic observation. Utilizing ubiquitous sensors, we apply three types observation methods to modeling each user’s preferences, which are microscopic, mezzoscopic and macroscopic observation methods as shown in Figure 2.
(A) Microscopic view identifies a user by his RFID name tag as well as detects eye tracks by his facial image and some handling motions on some item by locally equipped cameras.
(B) Macroscopic view covers a location of each person in a room by a matrix of global view cameras equipped on the ceiling. It also covers the overall spatial allocation and density of the people as well as the items in the room.
(C) Mezzoscopic view extracts and traces each person’s locations and behaviors as time series data both from microscopic and macroscopic views. It also manages personal behavior log database.
Fig. 2. Microscopic, mezzoscopic and macroscopic views
Indirect interaction in active observation. To enforce answering a huge number of questionnaires on users is a bottleneck in modeling personal preferences. One idea is just taking their behavior log via ubiquitous sensors without asking them, and mining some specific features by statistical analysis. Such a method is called passive observation. The problem of this method is to require long time and huge personal log to cover enough behavior data.
Our idea is to show several messages to each user, i.e., applying active observation, without expecting direct answers. If a message is informative and interesting to a user, he may pay attention, gaze, and follow the suggestion according to the message. In this process he is freely behaving by his intention without feeling any enforcement to answer to the system. In this case, monitoring each user’s behavior, i.e., responses to the messages, via ubiquitous sensors enables to attain enough behavior data effectively. This method corresponds to indirect interaction in active observation. The system can throw suitable and controlled messages to a user to build up his precise preference model without putting any stress on him. Thus, the system can statistically analyze a degree of interest on objects by each person’s behavior log effectively without a huge number of questionnaires.
Experimental Prototype: Smart Shop
In the business field, finding consumers’ preferences is an important issue. Point of sales systems are popularly used to detect the current consumers’ preferences as well as store management.
We have been developing an experimental prototype system, Smart Shop, as an application of personal information assistance in shopping context.
(1) Microscopic view devices: Each shelf is equipped with (a) an RFID tag reader to identify each consumer around there, (b) a facial camera to detect his face direction, (c) several item cameras to detect his behaviors related to the items, such as touching, grasping and wearing, and (d) several LCD monitors to show personal messages to him as well as to show public messages to the consumers.
(2) Macroscopic view devices: The ceiling of the shop is equipped with camera array to cover whole area without occlusion to detect a location of each consumer at each time slice.
(3) Smart shop servers: We have three types of database servers; which are (a) microscopic information servers to detect each behavior of the customer by image processing with his customer-ID by an RFID reader at each shelf, (b) a macroscopic server to integrate location data of consumers’ from camera array by image processing at each time slice, (c) a mezzoscopic server to integrate personal behavior log data from microscopic servers and macroscopic server and to manage the behavior log database, (d) a preference model server to statistically analyze each customer’s preferences from each of his behavior logs and to manage preference model database, and (e) a recommendation server to assist a customer in shopping.
We can expect that the consumer’s preference may appear his behavior; for instance, the order "grasp > touch > watch > ignore" shows his interest. Our assumption is that we can construct his preference model on items by behavior analysis.
Nevertheless we should note that we cannot directly estimate consumer’s preference form a single behavior itself. It should be evaluated all through his behavior log. It is because "shopping style" is roughly classified into two types; direct shopping type and survey type. For the former type, even a single touch shows a strong interest, while for the latter, a single touch is just one of them.
The system functions are as following;
(1) If a customer comes to a shelf, its micro-scopic server is activated and senses his RFID to identify.
(2) If he is interested in an item, he may stay there for a while to watch. If he is more interested in it, he may also touch and grasp it to have a closer look at it. Such a sequence can be detected by the ubiquitous cameras in the space. Thus, his personal behavior log is accumulated into the smart shop personal behavior log database.
(3) By statistical analysis on the frequency and total elapsed time of watch, touch and grasp of each item, we can judge the shop-ping style and finally estimate the preference of the consumer on the items in the shop.
Through this process and iteration, the sys-tem can build up and update each customer’s preference model without forcing him to answer huge questionnaires.
Personal Assistance Service Using Wearable Environment
Kansei Modeling on Subjective Interpretation of Personal Situation
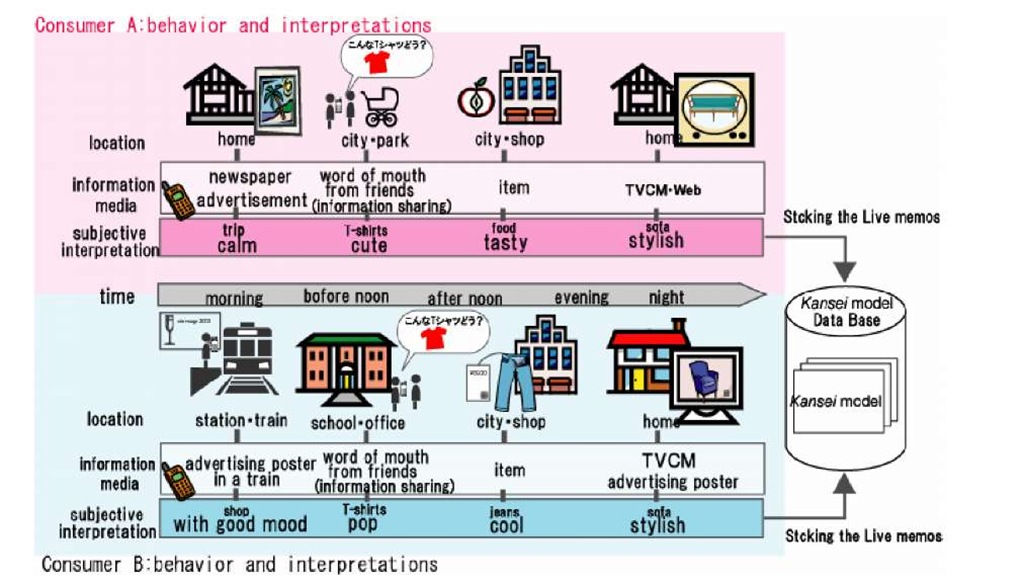
Even if we have a specific personal preference model tuned for the user’s perception process, a uniform service all through the day is insufficient. Even if some people physically sharing the same time, place, and occasion, each of them may also expect to receive different types of assistance. Each person may expect various types of information assistance suited to his situation, i.e., the time, place and occasion (Figure 3) [7], [8], [9].
We should consider such a situation is also subjectively interpreted by each person according to his context of the day as well as his life style. We assume such a process as physical, bottom-up multiple interpretation and top-down ser-vice-based levels of interpretation. We can model these relationships by statistically analyzing the relationships between the personal situation and behavior log.
Fig. 3. Expected assistance in situation-based information service
Context of User’s Situation
It is essential to understand the users themselves in order to provide in-formation services which can satisfy the requirements of users. This requires understanding the ordinary behavior of users. These are the behaviors users have performed so far (state transition) in usual locations (creating meaning of location) and what actions users may take in the future (behavior pattern).
These elements for judgment can be identified by making "multiple interpretations" in bottom-up process of the stored information which has been ac-cumulated by the ordinary actions of users as "history". This means that one piece of location information can refer to a wider range of information. For example, the spot of "Shinjuku Station" is taken as "Shinjuku Ward" or as "Tokyo Metropolitan". We should consider such a situation is also subjectively interpreted by each person according to his context of the day as well as his life style. We assume such a process as physical, bottom-up multiple interpretation and top-down service-based levels of interpretation. We can model these relationships by statistically analyzing the relationships between the personal situation and behavior log.
Assumption is made by selecting the interpretations suitable for users among these plural interpretations. It may be considered to be possible to assume the "action pattern" of users from the scored "location" and "time," the "creating meaning of location" of users from scored "location" and "action," and then the "state transition" of one day from scored "time" and "action."
Sensing of the Behavior and Situation of Users by Wearable Sensors
It is essential to understand the users themselves in order to provide in-formation services which can satisfy the requirements of users. This requires understanding the ordinary behavior of users. These are the behaviors users have performed so far (state transition) in usual locations (creating meaning of location) and what actions users may take in the future (behavior pattern).
It is necessary to know the movement of users in order to assume the situation and the tasks of users. Then, we grasp the situation of users and their surroundings by the use of wearable sensors to provide the necessary information.
We adopted a GPS sensor as a location detector as well as out-door detector. In the former use, we attain user’s physical location, map location, and postal address to select suitable information from the database. In the latter use, we estimate inside or outside of a building to distinguish the purpose of moving.
We also adopted a three-axis acceleration sensor attached on a leg to detect the speed of the moving as well as the motion and pause of the user, e.g., running, walking, standing, sitting and standing in a lift, etc.
From the TPO sensors above, we collect "location information," "time information" and "action information" which are taken to judge the tasks of the user at that moment. This "action information" consists of the plural pieces of sensor information, for example, which can assume a task such as "shopping" and a situation of "moving" "in doors" as summarized in Table 1.
Personal Assistance Service by Wearable HMD or Mobile Phone
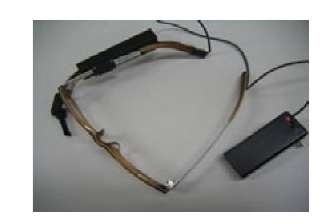
As the display device of information, a constantly wearable see-through type small HMD was used for this study (Figure 4). This equipment is set on the edge of glasses and indicates the transmissible display in the low sight of vision. Recommended information can be browsed only by shifting the eye level to the low sight. Users may browse the distributed information easily.
Table 1. Example of Tasks on Holidays
|
motionless |
moving |
|
|
indoors |
during dinner movies on a break |
shopping Visiting a museum moving to a destination |
|
outdoors |
on a break waiting |
Walking moving to a destination |
In our experiment, the information is selected from three categories, which are "during dinner," "shopping" and "playing" as listed in Figure 5. It can be selected per category by handling joystick-type interface. If one category is selected, three pieces of information are displayed, which are included in the category. By selecting a preferred piece of information, such detailed information can be browsed as shown in the center of Figure 5. Then, of the information, the evaluation can be made by the four steps of "will go," "may go," "not so much" and "of no interest" to get an instant survey of recommendation as shown in the right of Figure 5.
Fig. 4. Constantly wearable small see-through type HMD
Fig. 5. Transition of HMD screen display
Summary
This paper proposed a concept of KANSEI modeling from the aspects of users’ needs in information service. The key issue is to computationally describe human information processing process from these aspects; (1) intuitive perception process, (2) subjective interpretation of their situations, (3) knowledge structure of service domain, (4) feature of behavior pattern, and (5) decision making process. We should notice that these aspects are in the same framework of modeling in robotics field. This idea will be one of a fundamental concept for next generation information and communication environment, because the 21st century is an era for diversity as well as symbiosis among humans and artificial objects.


