Dynamic Loading Rate Experiments
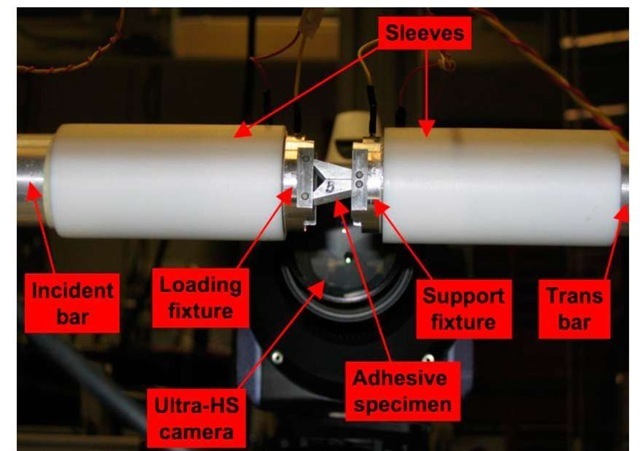
A modified compressive SHPB setup was used to perform the dynamic loading rate experiments. The incident and transmission bars were both aluminum 7075 with a diameter of 31.8 mm (1.25 in) and length of 3.66 m (12 ft). The striker used was 0.41 m (16 in). Wave shaping was employed on the incident bar to ensure the specimens were in a state of dynamic equilibrium. Semi-conductor strain gauges were mounted at midpoint on both bars, and connected to a high-speed digital oscilloscope to record the strain histories in the bars. The specimen-bar interfaces were modified to include the loading fixtures; the fixtures were held concentric with the bars and in place with a plastic sleeve. A detailed view of the experimental setup can be seen in Figure 7.
Figure 7 – Detail of high loading rate experimental setup
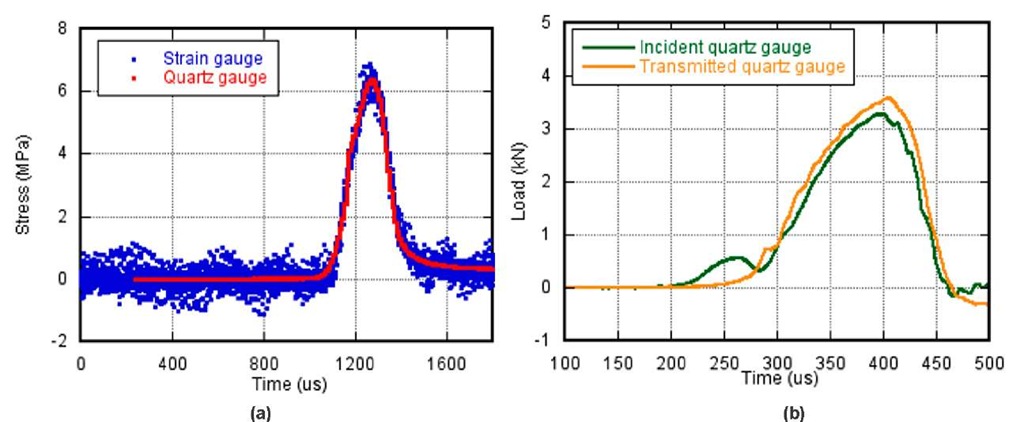
The loading fixtures were connected to a Kistler charge amplifier, and the amplifier output was recorded on the oscilloscope. The quartz gauges were calibrated to the known strain (and therefore stress) history recorded by the strain gauges. The calibration was performed by sending a compressive pulse through the system without a specimen. Mating fixtures were used in place with the loading fixtures to allow for smooth stress pulse transfer between bars and fixtures. Figure 8 (a) shows a typical calibration curve for the quartz gauges. Figure 8 (b) shows the loading history for one typical adhesive experiment. The loads are approximately equal at both incident and transmitted bars for nearly the entire experiment, and the loading rate is near constant. For the dynamic loading experiments, the average specimen gap closure velocity was 888.7 mm/s (35.0 in/s) and the average loading rate was 29,648 kN/s (6670 lb/s).
Figure 8 – (a) Calibration of quartz gauge using strain gauge and (b) typical load histories at incident and transmitted bars during adhesive experiment
RESULTS
A summary of the adhesive’s mechanical properties that were measured during the experiments at the three different loading rates is tabulated in Table 1. The failure energy is the energy absorbed by the adhesive up to the point of failure (crack growth initiation); the failure initiation time is determined using the DIC technique (an optical COD gage) to measure when the COD begins to increase. Energy to failure is calculated by integrating load with respect to displacement. For the high rate tests, load was measured from the transmission quartz gauge, and displacement was determined from bar end motions measured by the strain gauges. At the quasi-static and intermediate rates, the displacement and load were measured using the test machine’s instrumentation. Failure energy rate is simply the failure energy per unit area of adhesive.
Table 1 – Summary of adhesive experimental properties
|
Adhesive Averages |
||||||
|
Rate |
Disp Rate (mm/s) |
Loading Rate (kN/s) |
Max Load (kN) |
COD Velocity (m/s) |
Failure Energy (mJ) |
Failure Energy Rate (J/m^2) |
|
Dynamic |
888.7 |
29648.20 |
3.01 |
9.89 |
206.60 |
1525 |
|
Intermediate |
0.64 |
13.92 |
2.18 |
4.38 |
97.11 |
717 |
|
Quasi-static |
0.00051 |
0.01158 |
1.55 |
1.70 |
81.79 |
384 |
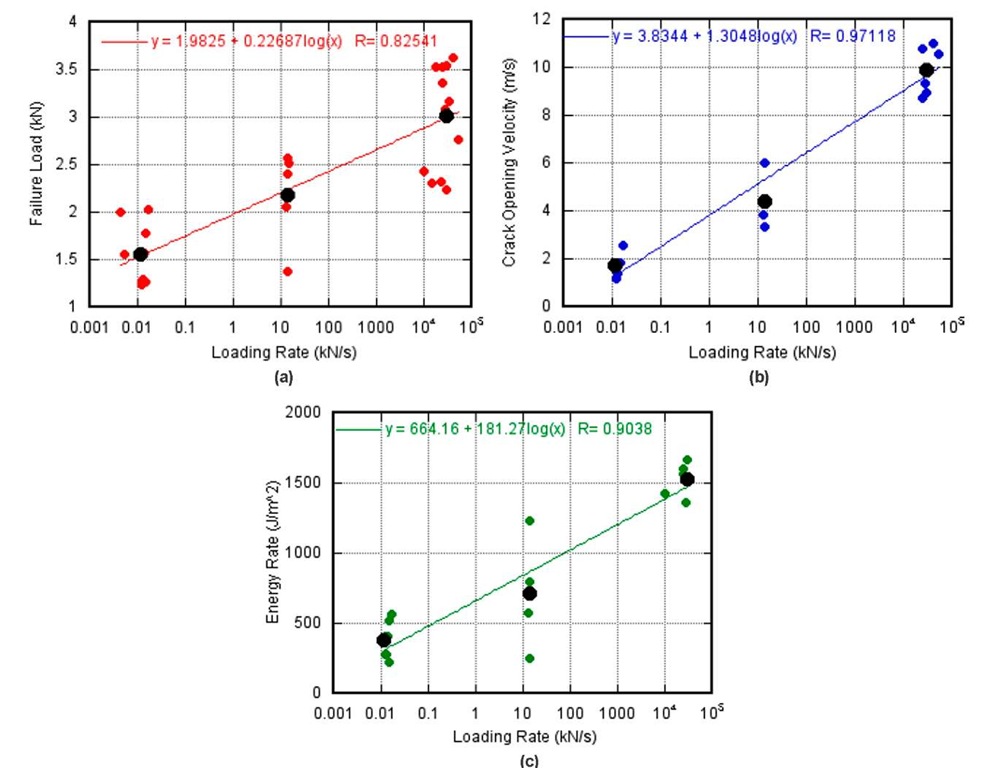
Figure 9 shows the relationship between loading rate and (a) failure load, (b) COV, (c) energy rate. The black markers indicate the average for that loading rate group. There is a strong and direct correlation between loading rate and all three properties. This demonstrates the absolutely necessity to obtain the high loading rate behavior of adhesives that may be subjected to these rates.
Figure 9 – Effect of loading rate on (a) failure load, (b) crack opening velocity, and (c) energy rate
CONCLUSIONS
A methodology for performing high-rate four-point bend strength (mode I fracture) experiments on adhesives has been developed at the Army Research Laboratory’s experimental facilities. A unique butterfly-specimen is used to study the adhesive and interface fracture. A modified compressive SHPB setup dedicated for dynamic fracture experimentation was used with this specimen to study the fracture behavior of a DGEBA epoxy cured with DETA. Digital image correlation was used as an optical COD gauge to measure exactly when the crack opening displacement begins to increase, which is shortly before the maximum load, and provided a precise measurement of the initiation of crack growth. These capabilities were used to characterize the loading rate effects on the strength and energy required to initiate fracture of a typical adhesive (EPON 828) used in Army applications. It was found that the failure strength and energy required for fracture initiation are both directly correlated to loading rate. This technique will be used to characterize other adhesives in the future, and allow for direct comparison of high loading rate properties for different adhesives under different environmental conditions as well under different surface morphologies.
These experimental failure criteria will be used in developing simulation methodologies to represent fracture along the adhesive interfaces. Furthermore, these simulation methods will be used to explore other possible failure criteria, such as stress and strain fields around the crack-tip region. Also, these simulation methods can be used to explore the mode mixity, where both mode I and II are present at the crack tip region.
Determining the mechanism of failure for the adhesive is an important future step for this work. Investigating whether the failure occurs at the bonded material (here, aluminum) adhesive interface (mode B), or within the adhesive (mode A), or some mixture of the two will help researchers better understand the failure behavior. Additionally, this research is focused on mode I failure of the specimens. Development of experimental techniques to understand the mode II failure of adhesives will be needed.


