ABSTRACT
Adhesives are used to bond different materials to resist impact and penetration. This adhesive bond layer is a frequent source of failure when subjected to impact loadings. Therefore, it is necessary to measure the cohesive strength and failure behavior, especially at high loading rates. Experimental methods are limited in characterizing the mechanical behavior of adhesive bonds at high loading rate, so a unique experimental method and a specimen geometry was developed to determine the effect of loading rate on the failure (Mode I) of a commercially available adhesive (EPON 828). Four-point bend specimens consisting of two aluminum "wings" bonded together with the adhesive were tested at different loading rates, from quasi-static to high-rate. The high rate loading was performed using a unique modified Split-Hopkinson Pressure Bar (SHPB) setup. Embedded quartz transducers at the loading interfaces were used to measure the applied loads at both sides of the bar-specimen interfaces, which helped to optimize the input stress waves using wave-shapers to conduct valid dynamic experiments. Digital image correlation (DIC) method was used as an optical crack opening displacement (COD) gage to measure the onset of crack opening velocity (COV) to determine the failure initiation point on the load-displacement trace. The experimental results are used to obtain the energy required to initiate failure at different rates of loading. In this paper, the experimental methodology is presented, along with the results from these experiments. These data are being used to develop computational simulation methodologies to investigate the failure of bonded structures during dynamic impact loading. They will also be used to compare potential adhesives in determining the most qualified adhesive for various applications under different environmental conditions as well as different surface morphologies.
KEYWORDS
High rate loading, dynamic properties, bond/adhesive strength and energy, ultra high-speed digital image correlation, EPON 828
INTRODUCTION
Adhesives are used to bond dissimilar materials to form protective systems. This adhesive bond layer is a frequent source of failure when subjected to impact loadings. To develop simulation methodology to predict the behavior of systems that contain adhesives during impact and penetration, it is important to understand the failure behavior of the adhesive interface layer. Therefore, it is necessary to develop experimental methods to measure the cohesive strength and failure behavior, especially at the high loading rates experienced during impact. Experimental methods do not exist to characterize the fracture behavior of adhesive bonds at high loading rates. By developing this experimental technique, the cohesive strengths can be determined, and these material properties can be used in computer models to predict the fracture process.
For fiber-resin based composites, understanding the failure behavior at the micro-structural level is important to develop accurate simulation methodologies. This ensures correct prediction of deformation and failure of these composites during high rate impact loading. During impact, fracture at the interface between fibers and resin is the dominant failure mechanism. Currently, there are no valid high rate experimental methods to investigate this type of interfacial failure. The high rate experimental techniques presented in this paper can be used to study such interfacial failure.
The failure mechanisms of the adhesive layer depend on many variables, including the surface roughness of the substrate materials being adhered together and environmental conditions. The interface properties can be controlled by varying the surface treatment at the interface [1-2]. Similarly, the bond strength may depend on the temperature and surface morphology in addition to the mechanical behavior (strength) of the adhesive material. Researchers develop various adhesives to bond different materials with high adhesive strength and toughness, and to withstand different environmental conditions. Currently, there does not exist a way to compare different adhesives in terms of bond strength at high loading rates, or to determine how the bond strength of these different adhesives change due to changing environmental conditions or surface morphology. This research documents a methodology that can be used to determine adhesive bond strengths at high loading rates, and which can be extended in future work to investigate the effect of surface morphology and environmental conditions on bond strength at high rate.
Many different materials are used to develop protective systems, all with different material properties. Frequently, disparate materials are bonded together, such as ceramic bonded to polymer composite. During impact loading, a frequent failure mechanism involves adhesive failing at the material interface. Therefore it is important to understand the failure along the interface between adhesive and material. Interface failure of the adhesive occurs one of three ways: mode A, where the crack propagates through the adhesive; mode B, where the crack travels between adhesive and bonded material; and mixed mode, where the crack alternates between propagating through the adhesive and at the interface (combination of mode A and B). Higher levels of adhesion usually cause a higher likelihood of mode A failure, where the crack propagates through the adhesive. These modes are not to be confused with traditional fracture modes (mode I, mode II, mixed mode). In this paper, we propose a novel experimental method to study and quantify failure of adhesives at high loading rate under mode I fracture. This information will be used for the development of cohesive zone based simulation methodologies as well as providing data to be used as an evaluation tool for adhesives that are being designed for Army applications.
Only recently have experimental methods been developed to adequately investigate the fracture behavior of materials at high rate loading. Weerasooriya et al [3] investigated the fracture behavior of a SiC-N ceramic as a function of loading rate, including at high loading rates. They used a modified split Hopkinson pressure bar (SHPB) setup to perform four point bending experiments on notched and un-notched SiC-N beam specimens to determine fracture toughness (notched) and flexure strength (un-notched) at dynamic loading rates. They found that both properties increased with increased loading rate. They used the same techniques to characterize the dynamic fracture toughness of PMMA as a function of loading rate [4]. They found that the fracture toughness of PMMA is also directly dependent on the loading rate. A comprehensive review of recent progress in dynamic fracture toughness experimental techniques was performed by Jiang et al [5].
The effects of surface morphology on the failure of interfaces have been studied at low loading rates. For a glass alumina interface, Cazzato and Faber [6] determined that the crack path was not restricted to the inter-material interface. The failure properties are thus nearly independent of the alumina surface roughness. Zhang et al. [7] used a bi-layer double cantilever beam specimen to study the fracture behavior of an epoxy-aluminum interface as a function of substrate surface morphology. They showed that the roughness index at a microscopic level is more important that the nano-level features of the aluminum surface.
Extending the work of Zhang et al [7], Syn and Chen [8] studied the surface morphology effects on an aluminum-epoxy interface when subjected to high rate loading. They developed a novel butterfly like 4-point bend specimen that consisted of aluminum on one side and epoxy on the other. This new specimen design was subjected to high rate loading in a modified compressive split Hopkinson pressure bar (SHPB) apparatus, using the 4-point bend technique similar to those detailed in [3-4]. They found that both fracture toughness and energy dissipated by the fracture process increased with increasing surface roughness for specimens loaded in approximately 10 N/ps range.
In this paper, novel adhesive specimens were created by using a thin amount of the adhesive to bond two aluminum "wings" together, creating similar geometry specimens as Syn and Chen [8]. The specimens were then subjected to four point bending experiments as in [3-4], which caused failure of the adhesive. These experiments were performed to obtain the fracture properties of the adhesive bond/interface, including failure load, maximum load, failure energy (energy required to initiate crack propagation), and specimen crack opening velocity. These experiments were conducted over a range of loading rates, from quasi-static to dynamic.
For dynamic loading experiments, a modified SHPB setup was used with embedded quartz force transducers to measure load history on the specimens, similar to [3-4,8]. High-speed digital image correlation (DIC) was used during the experiments to determine the onset of fracture and to allow quantification of the failure energy absorbed by the adhesive. This was obtained by measuring the velocity at which the two aluminum wings traveled away from each other after the onset of crack growth; hereafter this is referred to as the crack opening velocity (COV). The COV begins to increase just before maximum load; this indicates the initiation of failure; by determining when the failure began, it is possible to measure the energy needed to cause the initiation of failure of the adhesive. This method is more accurate than the assumption that the failure begins at the maximum load point.
MATERIAL
The adhesive used in this was diglycidyl ether of bisphenol-A (DGEBA), obtained from Shell under the trademarked name EPON 828. DGEBA is a typical commercial epoxy resin; it was used as a "baseline", against which, later, high performance adhesives can be compared to. The DGEBA was cured with diethylenetriamine (DETA). This adhesive is widely accepted as a strong, versatile adhesive, used in a wide variety of applications. The behavior of this adhesive has been widely investigated. Chen et al [9] and Chen et al [10] investigated the constitutive compressive response of a similar DGEBA, EPON 828 cured with T-403. They found that the compressive strength increased with increasing strain rate, as did the strain at maximum strength. In addition, Chen et al [11] investigated the tensile behavior of EPON 828 as a function of strain rate.
EXPERIMENTS
Specimens
The "butterfly" specimens were created by bonding two aluminum (7075) wings together with the adhesive. The wing geometry is shown in figure 1(a) (all units are in mm). The specimens are assembled using custom molds, the detail of which is shown in figure 1(b); the wings (blue) are held in place with set screws, and the two halves come together guided by alignment pins (purple). Custom made gauge blocks (green) are used to set the adhesive thickness (red); bolts (tan) are used to tighten the two halves together, which squeezes out excess adhesive, leaving only a layer as thick as desired, set by the gauge block thickness. A small pre-crack is created in the adhesive by embedding a thin layer of Teflon at the loading edge (not shown in figure). This ensures that over the narrow length of the Teflon, the adhesive is bonded to only one of the aluminum wings.
Figure 1 – (a) Aluminum wing geometry and (b) specimen fabrication schematic
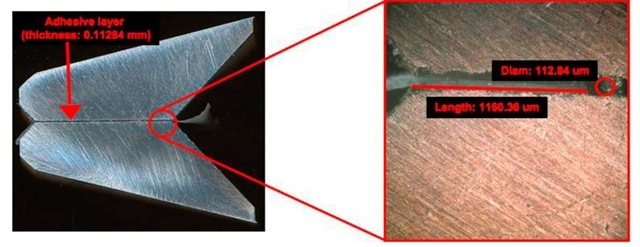
The completed specimens are then observed with an optical microscope to measure adhesive thickness and uniformity, and initial crack length. Figure 2 shows a complete, untested specimen and a magnified detail of the cracked-end of the adhesive demonstrating the measurements being obtained for the specimen using an optical microscope.
Figure 2 – Complete specimen and microscopic view of adhesive layer and pre-crack
Loading Fixtures
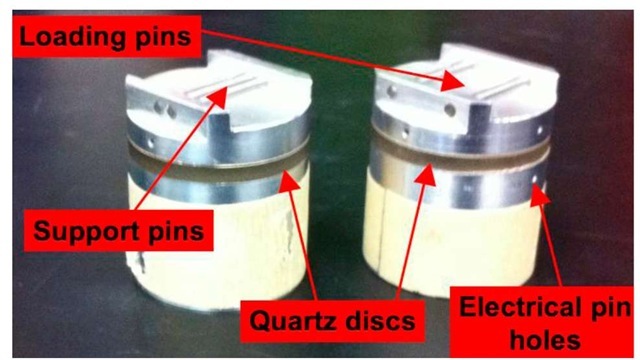
To allow for integration into a compressive SHPB setup, cylindrical aluminum pieces of diameter 31.8 mm (1.25 in) were fabricated to mount a pair of hardened steel loading pins of diameter 2.4 mm (0.094 in) parallel to each other and normal to the cylinder axis. These pieces were bonded to a quartz disc of same diameter and 3.175 mm (0.125 in) thickness using a conducting metallic based epoxy. The other side of the quartz disc was bonded to a 25 mm (1.0 in) long aluminum cylinder. The quartz disc is the key instrumentation of the measurement system; as it is piezo-electric, it develops a small charge as it is subjected to mechanical stress. Two small pinholes in the aluminum pieces allow for electrical connectors to measure the charge developed by the quartz disc during loading. Two of these fixtures were created, one for each side of the specimen. The center-to-center distance for the loading side fixture was 12.20 mm and the support side fixture was 3.00 mm.
Shown in Figure 3 are the complete fixtures, with the aluminum pieces bonded to each side of the quartz disc. Masking tape on the end of the fixtures ensures a snug fit with the plastic sleeve which is used to hold the fixture against the Hopkinson bar.
Figure 3 – Loading and measurement fixtures
Digital Image Correlation
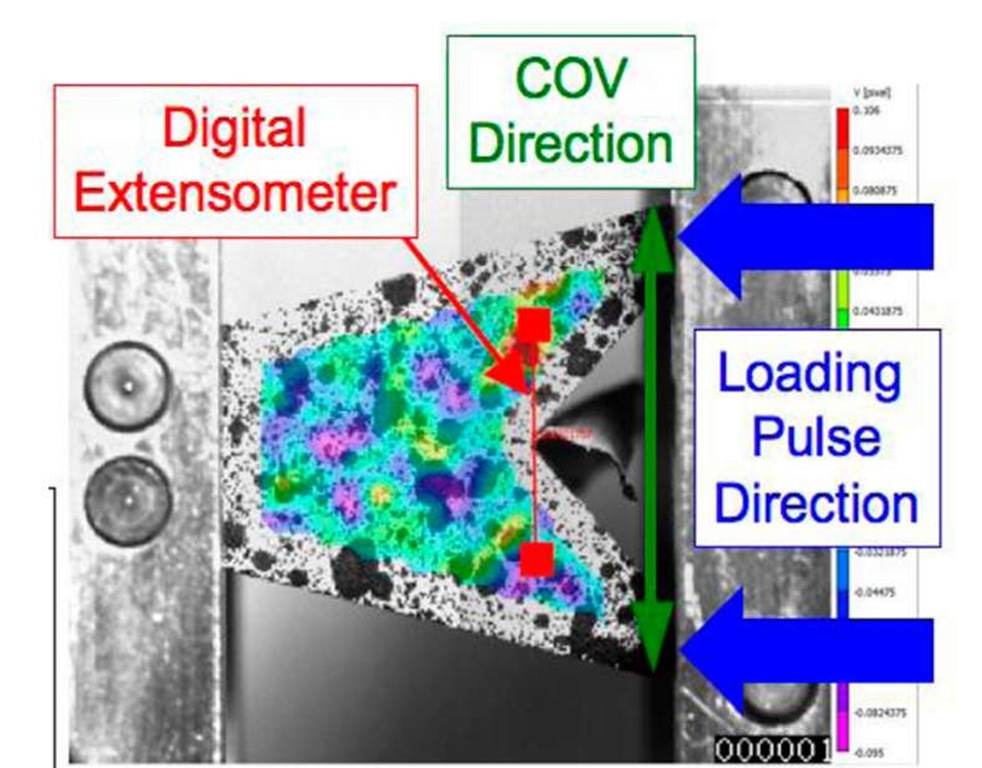
Digital image correlation (DIC) is an optical measurement that allows the user to perform displacement measurements of an object from a series of digital images recorded during the experiment. The images are post processed using specialized software. The DIC software allows measurement of the relative displacement of the two speckled wings. Figure 4 shows an example of an adhesive specimen with a speckle pattern that was used for displacement measurement by the DIC software.
Figure 4 – DIC extensometer and speckle pattern
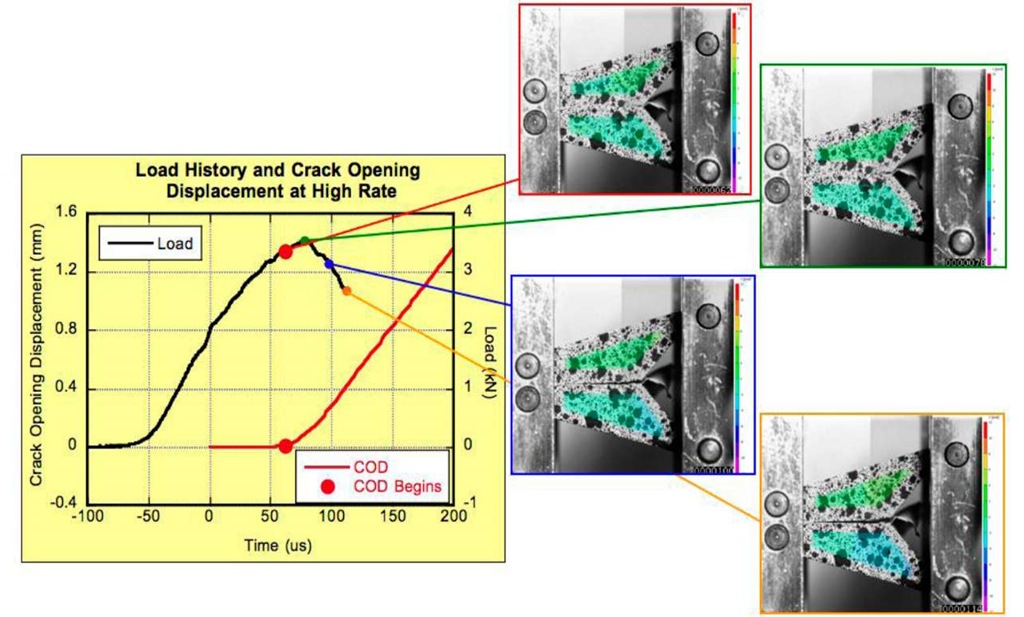
Figure 5 shows the loading and crack opening displacement (COD) history of a typical specimen obtained from DIC method; the COD starts to increase just prior to the peak load, showing the failure initiation (crack growth start) point in the load history. By computing the relative displacement between wings using the high speed camera images of the speckled wings and DIC, a COV can be calculated from the slope of the COD-time curve. DIC measurements were obtained for experiments at all three loading rates, including ultra high-speed DIC (1 million frames per second) on the dynamic loading rate experiments using the modified Hopkinson bar 4-point fracture set-up.
Figure 5 – Load history and COD history during typical adhesive experiment
Quasi-static and Intermediate Loading Rate Experiments
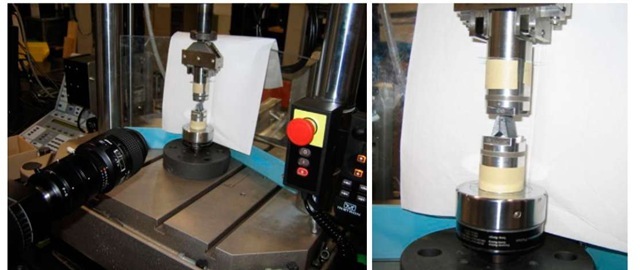
Two loading rates, which were several orders of magnitude below the dynamic loading rate, were used to characterize the adhesive at slower rates of loading. The experiments were conducted using an Instron 8871 servo-hydraulic test machine, with a load cell of capacity 5 kN (1124 lb). The same high rate loading fixtures discussed previously were used here for the purpose of using the same four-point loading geometry, thus eliminating any variability that may come from using different loading fixtures. However, the quartz cells were not used for the load measurements. The Instron load cell provided the load history for the lower rate experiments. Figure 6 shows the experimental setup for these two lower rate loading experiments. An alignment fixture, not shown, is used to ensure that the upper and lower fixtures are concentric and that the loading pins are parallel. The upper fixture is allowed to pivot to correct for any slight misalignments that may occur and make certain that the full length of the pins are engaged on the specimen during loading.
Figure 6 – Experimental setup for quasi-static and intermediate loading rates
During the experiments, the Instron test machine was controlled in displacement mode. The actuator traveled at constant velocity; due to the linear elastic behavior of the adhesive, this resulted in a constant loading rate. The quasi-static loading rate was 0.0116 kN/s (2.61 lb/s), which corresponded to a actuator velocity of 0.51 ^m/s (20.08 ^in/s). The intermediate loading rate was 13.92 kN/s (3.13 kip/s), which corresponded to an actuator velocity of 0.64 mm/s (.0252 in/s). A high-speed camera recorded images of the specimen during testing; at failure, a break load detector initiated by the Instron was used to trigger the camera. The camera used was a Photron APX-RS, recording at 60k fps (16.7 ^s/pic) and at a resolution of 128 by 128 pixels. The images were then post-processed using DIC software to determine the rigid body motion of the aluminum wings and to calculate the COV.

