Sharp and Continuous Freezing
Melting and freezing in general always occur as a discontinuous change of the state of matter, which is called the first-order transition. This is not necessarily true in a 1-D or quasi 1-D system. The simulation of water in the carbon nanotube indicates that both continuous and discontinuous freezing may occur depending on the diameter of the carbon nanotube and on the path followed in the thermodynamic Pz-T plane.
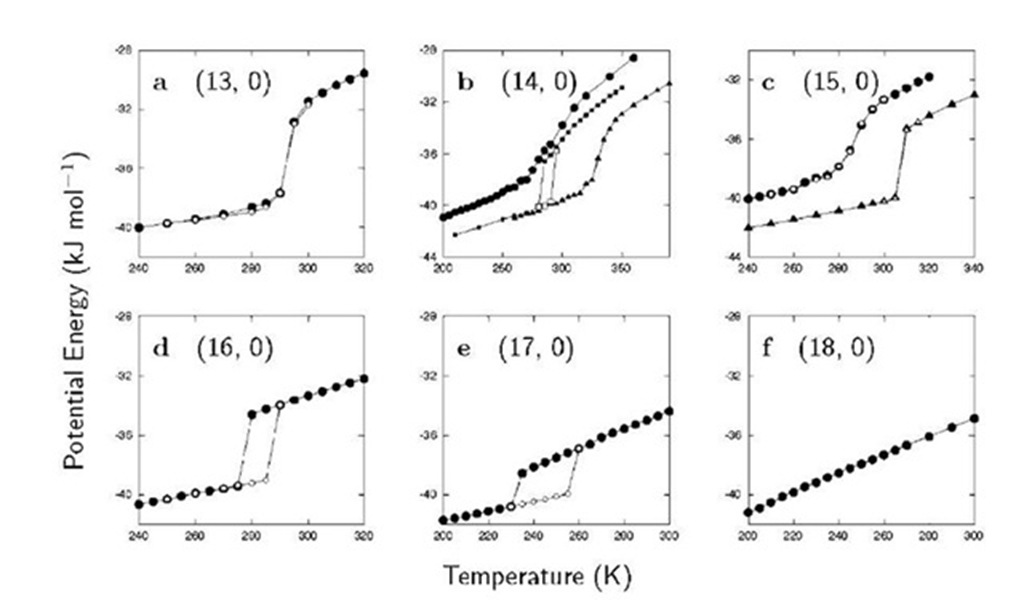
Fig. 4 shows plots of the potential energy of water confined in the (‘, 0) carbon nanotube (‘ = 13, …, 18) as a function of temperature. When ‘ =13, 14, and 15 at Pz=50 MPa, the potential energy decreases continuously with decreasing T while when ‘ =16 and 17 at the same pressure it makes an abrupt decrease at a certain point on cooling and exhibits a large hysteresis on heating. The molar volume of water also exhibits discontinuity or continuity just as the potential energy does. The discontinuity or continuity in the macroscopic properties of water is associated with the discontinuous or continuous change from a disordered structure (of liquid water) to an ordered structure (of the ice nanotube) or vice versa. In the (18, 0) carbon nanotube, the potential energy decreases nearly linearly with decreasing T and the disordered liquidlike structure at high T remains even at the lowest T.
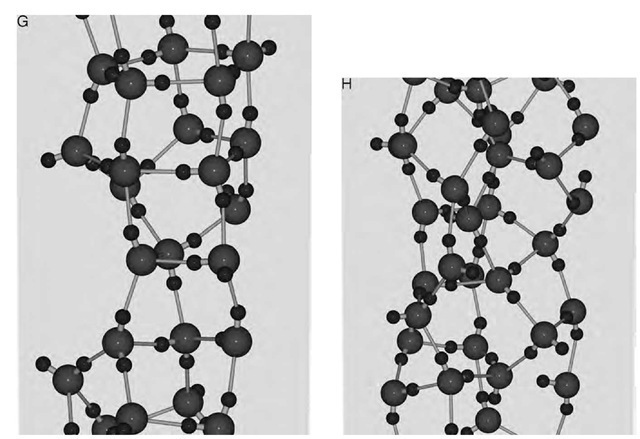
Fig. 3
Whether freezing occurs continuously or discontinu-ously depends not only on the index ‘ or the diameter D of the carbon nanotube but also on the pressure Pz. Under a very high pressure (500 MPa), water in the (15, 0) carbon nanotube freezes discontinuously to the hexagonal form of ice nanotube; remember that it freezes continuously to the pentagonal form at 50 MPa (Fig. 4c). More complex behavior is found in the (14, 0) carbon nanotube (Fig. 4b). On cooling at 50 MPa water freezes continuously into the square ice nanotube; at 200 MPa, it freezes discon-tinuously into the pentagonal ice nanotube; and finally at 500 MPa it freezes continuously into the pentagonal ice nanotube.
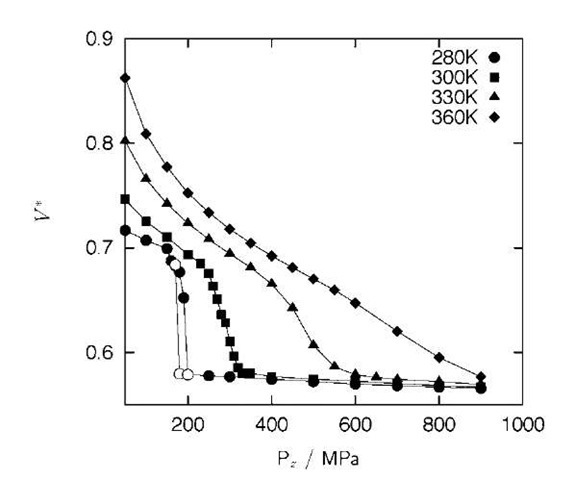
A set of isotherms in the Pz-V plane allows us to understand such complex phase behavior and can be a basic source to construct a phase diagram. Each isotherm is a plot of the system’s volume against Pz at fixed T, which is readily obtained from the NPzT-constant molecular dynamics simulation. Fig. 5 shows the set of isotherms for the (14, 0) carbon nanotube system. When T is fixed at 280 K, V makes a sudden drop at 200 MPa on compressing and a sudden jump at 170 MPa on decompressing; that is, the isotherm shows discontinuity and a hysteresis. The low-density phase (before the sudden drop or after the sudden jump in V is observed) has a liquidlike disordered structure, whereas the high-density phase (after the sudden drop or before the sudden jump in V is observed) is basically a pentagonal ice nanotube. The diffusion constants of the low-density phase (at 190 MPa) and the high density phase (at 200 MPa), both during compression at 280 K, are 1 x 10~6 and 1 x 10~10 cm2 sec~ \ respectively, which reinforces that the low-density phase is liquidlike, whereas the high-density phase is solidlike. When T is fixed at 300 K, however, V shows a marked decline between 250 and 330 MPa but with no discontinuity, although the same liquidlike and solidlike phases are found at low and high pressures, respectively. This means the liquid-solid transformation at this temperature is continuous. When T is fixed at 330 K, the isotherm is much less steep, and at 350 K it slopes down even more gently. Thus, the isotherms for the (14, 0) carbon nanotube system are similar to typical isotherms around the critical point of fluids.
Fig. 4 The potential energy vs. temperature for water confined to the (‘, 0) carbon nanotube with ‘ =13-18 (a-f). The axial pressure is fixed at Pz = 50 MPa (• and O in a-f), 200 MPa (■ and □ in b), and 500 MPa (~ and 4 in b and c). Filled and open symbols indicate the cooling and heating process, respectively. The potential energy is the energy associated with the intermolecular interactions between water molecules.
Fig. 5 Isotherms in the Pz-V* plane for confined water in the (14, 0) carbon nanotube at temperatures 280 K (• and O), 300 K (■), 330 K (~), and 360 K (♦). V* = V/(Npr2 A). Filled and open symbols indicate the compressing and decompressing process, respectively.
For the (15, 0) carbon nanotube system, all the isotherms obtained at T =280, 300, 320 K show discontinuity, and the low-density phase is always liquidlike at these temperatures whereas the high-density phase is the hexagonal ice nanotube (even at 320 K!).
PHASE DIAGRAM
A phase diagram of water confined in the carbon nanotube is inferred from the results of the computer simulation and free-energy calculation. Before presenting the phase diagram, however, we note that it is not obvious whether or not a quasi 1-D system would show any phase transition or phase separation, even if the corresponding bulk system does. This is because when the dimension d is less than 2, much of the theoretical models in studies of the phase transition no longer exhibit any phase transition at any finite T. We should also note that the computer simulation itself cannot prove or disprove the existence of the phase transition because it cannot treat a macroscopic number N^ 1023 of molecules corresponding only to a thermodynamic limit in which the phase transition occurs. Nevertheless, the computer simulation can demonstrate discontinuous changes in microscopic and macroscopic properties of a system with changes in the temperature, pressure, or other thermodynamic field variable, and such discontinuous changes in a finite system do correspond to some abrupt, if not discontinuous, change of the state of the macroscopic system. Thus, in this sense we now use the terms ”phase transition” and ”phase boundary” for quasi 1-D water.
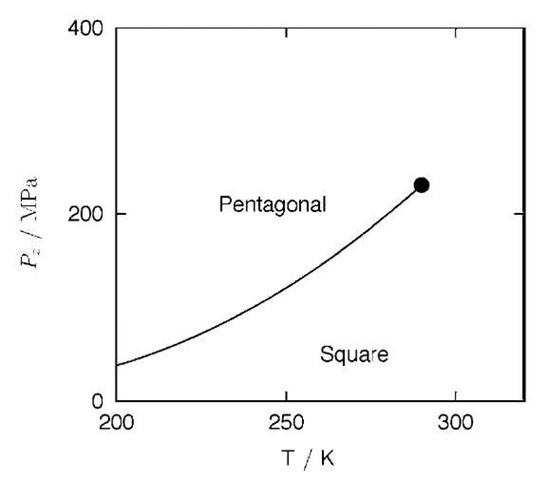
Fig. 6 A schematic T-Pz phase diagram of water confined to the (14, 0) carbon nanotube. The phase boundary (solid line) divides the low-density (square) and high-density (pentagonal) phases. The phase boundary terminates at a critical point (•) around 280 K.
Fig. 6 shows a schematic phase diagram in the T-Pz plane for the (14, 0) carbon nanotube system. The phase boundary separates the high- and low-density phases, which are now referred to as pentagonal and square phases for convenience. At low temperatures (e.g., 200 K) both phases are solidlike; at higher temperatures (e.g., 270 K) the high-density phase is still solidlike, whereas the low-density phase is liquidlike. Because the phase change becomes continuous above 280 K, the phase boundary should terminate at some point around that temperature. The point is referred to as a ”critical point” in the same restricted sense as remarked above. This phase diagram explains the complex phase behavior of the (14, 0) carbon nanotube system (Fig. 4b): the isobaric path at 50 MPa does not cross the phase boundary, and thus the phase change between the liquid and the square ice nanotube phase is continuous; the isobaric path at 200 MPa, however, crosses the phase boundary, and thus the change is between the liquidlike square phase and the solid pentagonal phase and it is discontinuous; and finally, the isobaric path at 500 MPa does not cross the boundary because it is above the critical pressure, and thus the change between the square and pentagonal phases is continuous.
For the (15, 0) carbon nanotube system, the phase boundary separates the low- and high-density phases, which may be referred to as pentagonal and hexagonal phases, respectively, because at low temperatures they are the pentagonal and hexagonal ice nanotubes. Unlike in the (14, 0) carbon nanotube system, no continuous path from one phase to another has been found in the T-Pz plane examined by the simulation. That is, the phase boundary may not terminate at any critical point, just as in any bulk liquid-solid phase equilibrium.
Similarly, for the (16, 0) carbon nanotube system, low-density and high-density phases are separated by a phase boundary that does not terminate at any critical point. The low-density phase is in a liquid state, whereas the high-density phase is a solid hexagonal ice nanotube.
For the (17, 0) carbon nanotube systems—the widest nanotube that allowed formation of the ice nanotube in the simulation—again the two phases, which we now call simply the solid and liquid phases, are separated by a phase boundary with no critical point. The solid phase is identified as the heptagonal ice nanotube. In this system, unlike in other systems, liquid water expands as it freezes into the ice nanotube at 50 MPa. That is, the density of the heptagonal ice nanotube is smaller than that of the liquid at the phase boundary at 50 MPa. At higher Pz this would hold even more strongly because the density of liquid increases more rapidly than that of the solid with increasing Pz. Thus, for the (17, 0) carbon nanotube system, the slope of the phase boundary in the T-Pz plane should always be negative: dPz/dT<0.
As we have seen above in the phase diagrams, the phase behavior of water confined in the different carbon nanotubes is qualitatively different even if the index ‘ of the carbon nanotube differs only by 1. However, if ‘ (or D) is taken to be continuous, rather than discrete, and is introduced as another axis in the original phase diagram, the resulting global phase diagram in the 3-D TPz£ (or TPzD) space would account for how these apparently independent phase diagrams at discrete ‘ (or D) are related to each other.[2] From the thermodynamic relations analogous to the Clapeyron equation and the simulations for several systems with noninteger values of ‘, e.g., a hypothetical (14.2, 0) carbon nanotube system, we find the following picture of the global phase diagram. First, there are at least five phase boundaries, which are now surfaces in the TPz£ space and have very steep slopes with respect to the ‘ axis. Two of them, a surface separating the square and pentagonal phases and a surface separating the liquid and square phases, seem to terminate at a ”critical line.” The other three are the surfaces separating the pentagonal and liquid (hexagonal) phases, the hexagonal and liquid (heptagonal) phases, and the heptagonal and liquid phases, and they seem not to terminate at any critical line.
RELATED SIMULATIONS AND EXPERIMENTS
Some computer simulations have been performed to examine the structure of an alkali halide, KI, inside the SWCNs and the mechanism of encapsulation of the molten salt into the hollow space of the carbon nano-tubes.[7] The results of the simulations suggest that the salt is crystallized rather easily in the carbon nanotubes even at temperatures at which the bulk counterpart is a melt.
Coulombic interaction facilitates the formation of the crystalline structures of KI inside the SWCNs. In this sense, the salt in the confined space exhibits a phase behavior similar to that of water; however, water shows the more facile transition because of its characteristic intermolecular interaction, i.e., the hydrogen bond. Those structures of the salt are either fragments of the bulk KI crystal or a twisted one, the latter of which has nothing to do with the bulk crystalline structure. Further investigation is required to discern which structure is the real entity in the SWCNs. Among other interesting topics are the structure and phase behavior of aqueous electrolyte solutions in SWCNs, which are expected to be greatly different from those of pure water in SWCNs. The hydration structure around ions and the ion-pair formation could be influenced by the quasi 1-D confinement, and they may become distinct from the bulk counterparts.[7]
Formation of the heptagonal ice nanotube in the SWCN has recently been observed experimentally,[3] which reinforces the theoretical prediction by the molecular dynamics and free energy calculations. Also observed in the experiment is that the melting point increases with decreasing the diameter of the carbon nanotube (Y. Maniwa, private communication).


