INTRODUCTION
Life would not exist if the molecules involved did not interact in a very dynamical way. An equilibrium situation must not be reached and evolution has to be continual. This implies that life originates from interactions and bonds that are weak and have a short lifetime (1 msec to several days) because of thermal fluctuations. Living systems endure a constant competition among these molecules that bind to each other. These molecular bonds, called ligand-receptor bonds or keylock bonds, define what is known as specific interactions. All molecules interact with each other, but, if possible, will form the strongest possible bond. It can be considered that two molecules that tend to bind in many situations are able to recognize each other. This can be observed in cell adhesion when two cells adhere because of specific molecules that they express at their surfaces. In real cells, this adhesion is usually difficult to quantify because of their complex physical properties and the high number of molecules that are present at their surfaces. However, for model cells, it is possible to quantify the adhesion and to deduce molecular properties of the bonds, even for very weak bonds. Here such a model of a cell adhering to a substrate will be presented. This model will be experimentally checked by the vesicle micromanipulation technique and applied to a bond involved in embryogenesis.
MODEL OF A CELL ADHERING ON A SUBSTRATE
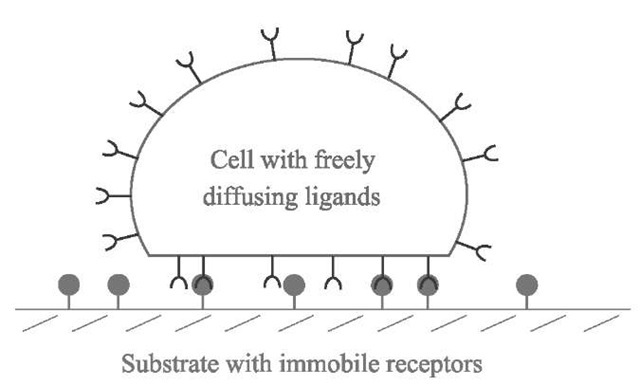
Let us consider the following model where a ”cell” of constant total area At will be seen as a capsule bearing N freely diffusing recognition sites (ligands) on its surface (Fig. 1). This cell adheres to a substrate containing complementary sites (receptors) that are not able to diffuse. The density of receptors is therefore fixed and will be called p0. Apart from the ligand-receptor interactions, the cell and the substrate do not exhibit either significant repulsion (polymer-like, for instance) or attraction (van der Waals, for instance). During the adhesion process, the ligands tend to move toward the contact region to bind to receptors on the substrate. This leads to an enrichment of ligands in the contact area Ac, where their density becomes higher than in the rest of the cell, therefore creating a bidimensional osmotic pressure that pushes the ligands away from the contact. Qualitatively, equilibrium will be reached when the attraction of the sites toward the contact zone is perfectly balanced by this osmotic repulsion.
More quantitatively, when the cell adheres to the substrate, the mechanical equilibrium represents the balance between the specific energy associated with contact formation and the cellular deformation work. For a variation 8Ac of the contact area, it can be written:
where 8w, Wadh is the adhesion energy (positive), namely, the free energy to create a unit contact area, and 8w is the cellular deformation work associated with the variation of contact 8Ac. One has to be aware that the Wadh is not the energy necessary to bring one unit area of the initial cell surface to contact. It is more subtle: it represents the energy gained by taking an adapted area of the part of the cell that is not in contact with the substrate, concentrating the ligands to their final concentration in the contact area (this must give a unit final area), and bringing it to contact with the substrate where bonds can form.
Because the differential of the free energy F is dF = 8w — SdT and the reaction is isothermic, one obtains dF = 8w.
This means that at mechanical equilibrium:
where Z is the partition function.
To obtain the value of the adhesion energy, it is therefore required to differentiate the free energy as a function of Ac.[1]
In the contact area, the ligands can be in two states, unbound or bound to a receptor. As they are energetically in the same configurations, the unbound ones and the ligands in the rest of the cell must have the same con-centration,[2] nu. The concentration of bound ligands will be noted nb.
Fig. 1 Schematic view of the model of a cell adhering to a substrate: the cell is a capsule containing freely diffusing sites, ligands, on its membrane. These sites can bind to complementary sites, receptors, on the substrate, where they are immobile.
ADHESION ENERGY AND BIDIMENSIONAL OSMOTIC PRESSURE AT EQUILIBRIUM
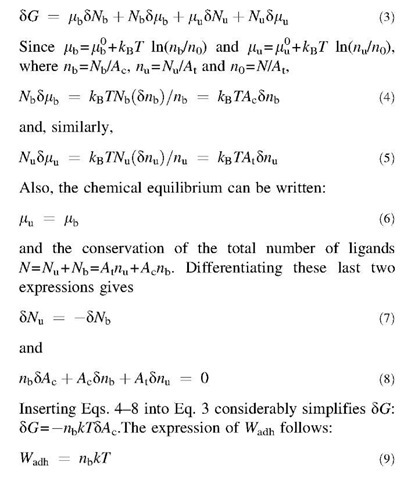
To relate the adhesion energy and the bidimensional osmotic pressure, the same approach as that taken by Evans[3] will be used. The Gibbs free energy can be written G=mbNb+muNu, where mb and Nb (mu and Nu) are the chemical potential and number of the bound (unbound) ligands.
This leads directly to:
This relation was derived in the mid-80s[3,4] and means that the adhesion energy equals the bidimensional osmotic pressure. This kind of relation between these two quantities could be expected because, as mentioned above, the adhesion energy tends to pull the ligands toward the contact area and the osmotic pressure (entropy) pushes them away. At equilibrium, the induced incoming and outgoing fluxes must balance each other and therefore the adhesion energy must be related to the osmotic pressure.
From Eq. 6, one gets
—mu°) has to depend on the binding energy eb. Thus, it would seem at first sight that using Eq. 9, one can deduce eb from Wadh. This turns out to be incorrect because to know the exact expression of (mb— M°), other information about the interaction is needed. For instance, the naive approach where mb— M°=eb is wrong (it can be seen that Eqs. 9 and 10 are then not compatible for eb=0).
To circumvent this problem, a simple model of the ligand-receptor interaction is needed.
MACROSCOPIC ADHESION ENERGY AND MOLECULAR BINDING ENERGY
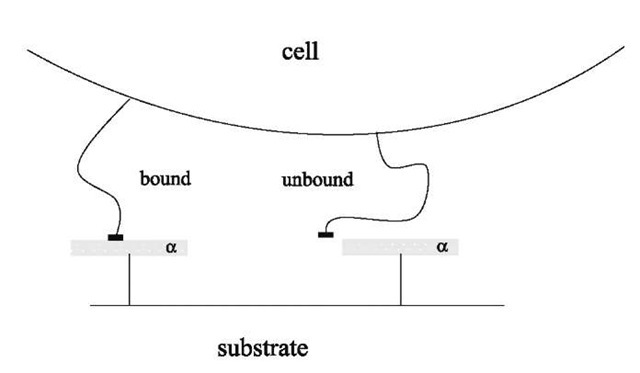
To schematize the interaction, it will be considered that around each receptor of the substrate, there is a molecular trapping area a, meaning that a ligand will be bound only if it is within this area a surrounding the receptor (Fig. 2).[5] It will also be assumed that the trapping areas of the different receptors cannot overlap. The total number of receptors in the contact zone is poAc, which means that the area of the total trapping zone is Ab= apoAc. The ligands within Ab are bound to a receptor, those in the rest of the cell, no matter whether or not they are in the contact zone, are unbound. The internal energy of a given configuration with n (0 < n < N) ligands in the trapping zone and N — n ligands in the rest of the cell is —neb. Therefore, the partition function of the system can be written:
Fig. 2 Model of the ligand-receptor interaction: if the ligand is within the attraction area a of the receptor, it is bound (left ligand). Otherwise, it is unbound (right ligand).
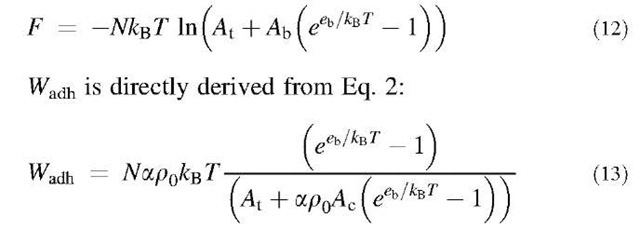
where kBT is the thermal energy. Hence, the free energy is:
Results that could have been intuitively anticipated can be deduced from Eq. 13:
1. Wadh decreases when the contact zone increases because the ”reservoir” made by the outer part of the cell becomes relatively smaller as compared to Ac.
2. When the number of receptors in the contact zone is small, Wadh is independent of Ac. This is the linear regime where the fraction of bound ligands is small.
3. When eb is large, all the ligands are bound to receptors and, as expected from Eq. 9, Wadh=NkBT/Ac.
One may note that there is a strong limitation of this model, which is to allow several ligands to be bound to the same receptor. In practice, this is usually not a problem, but it can happen that when there are too few receptors and the binding energy is large, the number of bound ligands and therefore Wadh will be overestimated. Also, any cooperative effects among the ligand molecules have been neglected. In a system where these problems arise, numerical simulations seem to be the best way to relate Wadh and eb.
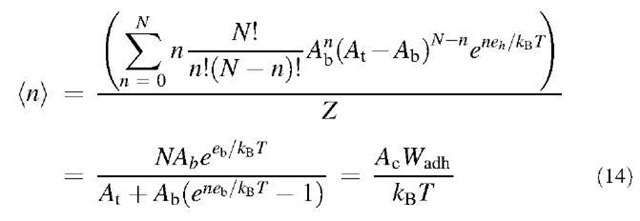
This second approach (model of a trapping area) is compatible with Eq. 9 because the latter can be derived from Eq. 13. The average number of bound ligands (n) is:
Since nb= (n)/Ac, Eq. 14 is the same as Eq. 9.
Therefore, Eqs. 9 and 13 give a complete description of the ligand distribution at equilibrium and allow one to directly deduce the molecular binding energy from the total adhesion energy if the trapping area a, the total number of ligands N, and the density of receptors p0 are known.

