Table 1 Fractal dimensions and binding and dissociation rate coefficients for different concentrations of lactoferrin in solution to three different ligands immobilized on a sensor chip surface
Biotinylated heparin derivatives were immobilized on streptavidin sensor chips and their effect was analyzed. Fig. 1A, B, and C shows the binding curves of lactoferrin at various concentrations (200, 100, and 50 nM) to CO2H-heparin, NH2-heparin, and EP-heparin, respectively, immobilized on the sensor chip surface.
For EP-heparin, a dual-fractal analysis is adequate to describe the binding as well as the dissociation kinetics for all of the concentrations analyzed. A dual-fractal analysis was adequate to describe binding kinetics for NH2-heparin and CO2H-heparin complex immobilized on sensor-chip surface. However, a single-fractal analysis was sufficient to describe the dissociation of these reactions with an exception for 50 nM lactoferrin concentration binding to NH2-heparin; a dual fractal analysis was required for this case. The values of the binding and the dissociation rate coefficients are given in Table 1. These values were obtained from a regression analysis using Corel Quattro Pro 8.0[15] to model the data using Eqs. 1c and 1d.
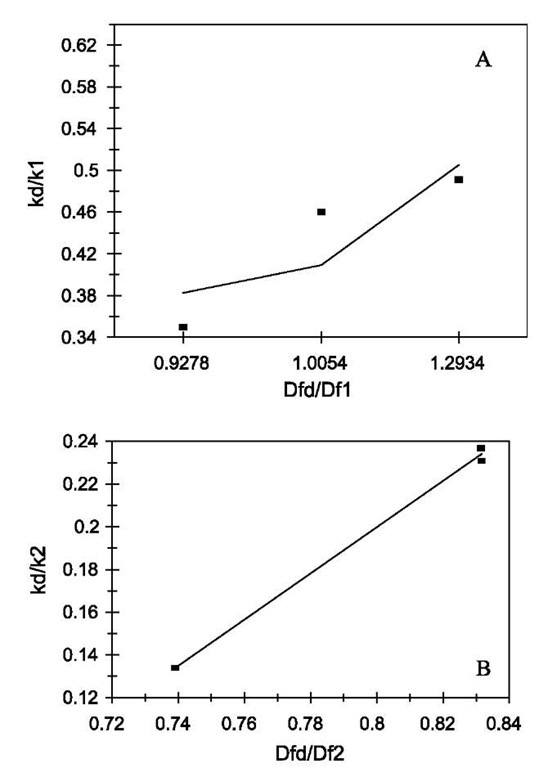
Fig. 2 Relationship between the affinities and the ratio of fractal dimension for dissociation to that of binding for lactoferrin binding to EP-heparin. (A) Increase in the affinity, K1, with an increase in the fractal dimension ratio, Dfd/Df1. (B) Increase in the affinity, K2, with an increase in the fractal dimension ratio, Dfd/Df2. Legend: as in Fig. 1 legend.
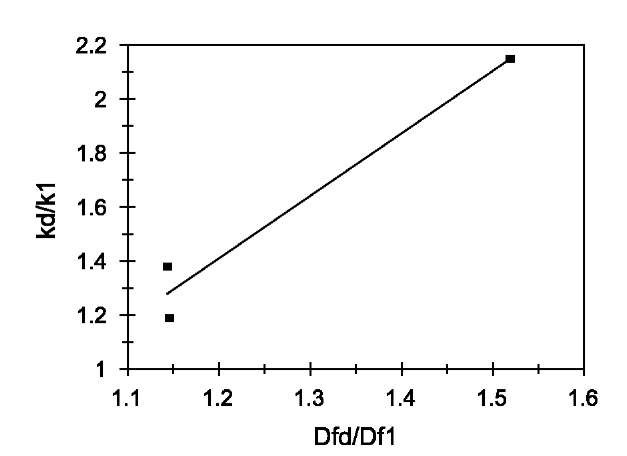
Fig. 3 Relationship between the affinities and the ratio of fractal dimension for dissociation to that of binding for lactoferrin binding to NH2-heparin. Increase in the affinity, K1, with an increase in the fractal dimension ratio, Dfd/Df1.
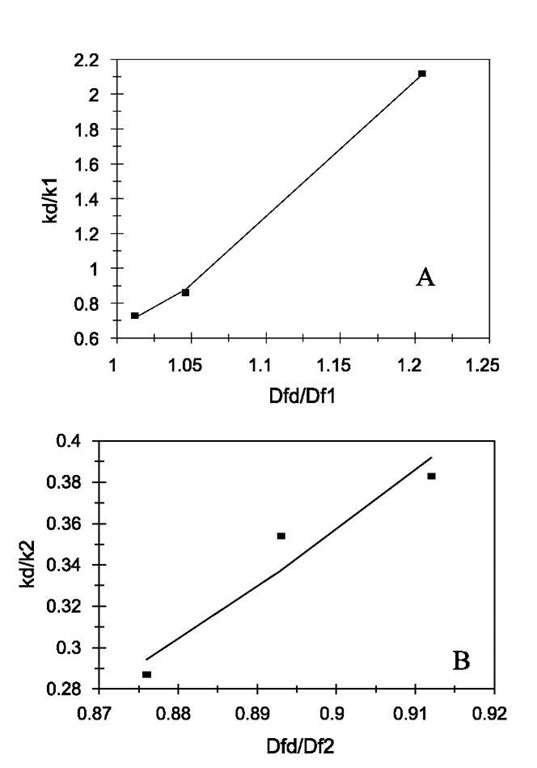
Fig. 4 Relationship between the affinities and the ratio of fractal dimension for dissociation to that of binding for lactoferrin binding to CO2H-heparin. (A) Increase in the affinity, K1, with an increase in the fractal dimension ratio, Dfd/Df1. (B) Increase in the affinity, K2, with an increase in the fractal dimension ratio, Dfd/Df2. Legend: as in Fig. 1 legend.
As the concentration of lactoferrin binding to all three different ligands increases, there is an increase in the binding fractal dimension (Df) and in the dissociation fractal dimension (Dfd). This leads to an increase in the binding rate coefficient, k, and the dissociation rate coefficient, kd. The higher receptor concentration (200 nM) on the SPR surface leads to a higher degree of heterogeneity on the surface because of the saturation of the active sites on the surface. This leads to a higher binding rate coefficient for EP-heparin and CO2H- heparin immobilized on the biosensor surface. However, for the NH2-heparin ligand this surface saturation not only leads to increase in rate coefficients but also to a change in mechanism of dissociation, which can be seen by the use of a dual-fractal analysis to describe the process.
The affinity K1 (kd/k) values are also calculated. There is no trend in these values with respect to different ligands. However, if we compare the affinity values of different concentrations of lactoferrin binding to a particular ligand with the ratio of the fractal dimension for dissociation to the fractal dimension for binding (Dfd/Df), we note an increasing trend. Fig. 2A shows that the affinity K1 (kd/k1) increases, for the binding of lactoferrin to the CO2-heparin immobilized on the sensor surface, as the ratio Dfd/Df1 increases. For the data analyzed and presented in Table 1, the affinity K1 (kd/k1) is given by:
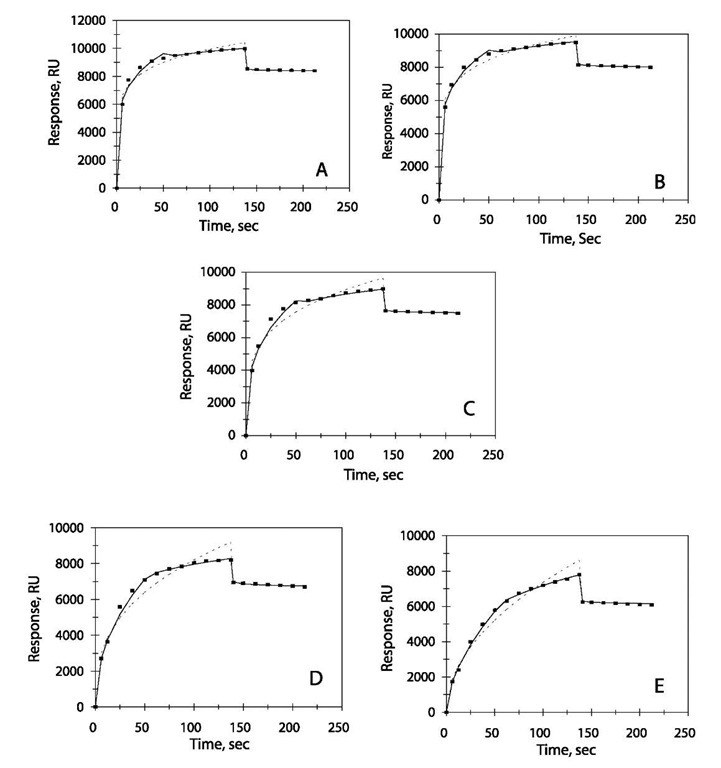
Fig. 5 Binding and dissociation curves for different amounts of liposome captured for drug-binding response. (A) 4 mM liposome suspension. (B) 2 mM liposome suspension. (C) 1 mM liposome suspension. (D) 0.5 mM liposome suspension. (E) 0.25 mM liposome suspension. Legend: as in Fig. 1 legend.
Table 2 Fractal dimensions and binding and dissociation rate coefficients for different concentrations of liposome suspension captured on a sensor chip surface
|
Liposome concentration (nM) |
ki |
k2 |
k |
Df4 |
Df,2 |
Df |
kd |
Dfd |
K| =k,|/k| |
K2=kd/k2 |
|
4 |
4339.4 |
7176.5 |
5123.2 |
2.590 |
2.866 |
2.711 |
1454.81 |
2.957 |
0.335 |
0.203 |
|
±244.4 |
±10.08 |
±262.93 |
±0.064 |
±0.004 |
±0.031 |
±17.39 |
±0.008 |
|||
|
2 |
3903.4 |
6252.5 |
4562.38 |
2.571 |
2.827 |
2.684 |
1294.76 |
2.941 |
0.331 |
0.207 |
|
±139.8 |
±38.54 |
±200.96 |
±0.041 |
±0.009 |
±0.026 |
±21.00 |
±0.011 |
|||
|
1 |
2369.4 |
5221.8 |
2956.10 |
2.361 |
2.778 |
2.519 |
1294.76 |
2.941 |
0.546 |
0.248 |
|
±159.3 |
±16.78 |
±232.70 |
±0.066 |
±0.009 |
±0.047 |
±21.00 |
±0.011 |
|||
|
0.5 |
1178.9 |
4475.3 |
1569.81 |
2.078 |
2.749 |
2.282 |
1166.22 |
2.901 |
0.989 |
0.260 |
|
±67.08 |
±67.08 |
±152.31 |
±0.056 |
±0.024 |
±0.057 |
±30.97 |
±0.018 |
\ |
||
|
0.25 |
589.44 |
2222.9 |
756.90 |
1.836 |
2.490 |
2.012 |
1477.05 |
2.942 |
2.506 |
0.664 |
|
±28.40 |
±19.35 |
±65.45 |
±0.047 |
±0.025 |
±0.051 |
±18.48 |
±0.009 |
Fig. 6 (A) Increase in the affinity, K1, with an increase in the fractal dimension ratio, Dfd/Df1. (B) Increase in the affinity, K2, with an increase in the fractal dimension ratio, Dfd/Df2. Legend: as in Fig. 1 legend.
The affinity, K1, is very sensitive to the degree of heterogeneity that exists on the surface as noted by the high value of the order of dependence of K1 on Dfd/Df.
Fig. 2B relates the affinity K2 (kd/k2) to (Dfd/Df2). The affinity can be given by
A similar analysis is done for binding of lactoferrin on NH2-heparin and CO2H-heparin ligands. The dependence of affinities on the ratio of fractal dimension is shown in Figs. 3 and 4, respectively. For the data analyzed of different concentrations of lactoferrin binding to NH2-heparin, the affinity, kd/k1 is given by:
For the data analyzed of different concentrations of lactoferrin binding to CO2H-heparin, the affinities, K1 and K2, are given by:
These results suggest heparin attached through the reducing terminus (EP-heparin) had the highest binding capacity followed by heparin immobilized via intrachain bare amines (NH2-heparin). Heparin immobilized through the carboxylate groups of uronic acids (CO2H-heparin) had lowest binding capacity. This is in accordance with the results suggested by the authors.
To examine how drug-binding responses were affected by liposome capacity, Baird et al.[4] used different amounts of lipids captured on a sensor chip surface by varying the concentration of liposome injected. Fig. 5 shows the binding and dissociation curves obtained for liposome concentrations from 0.25 to 4 mM. For all of the concentrations of liposome suspension analyzed, a dual-fractal analysis is required to adequately describe the drug-liposome binding kinetics. The dissociation phase is well described by a single-fractal analysis. The values of the binding and the dissociation rate coefficients are given in Table 2. According to the authors there are two types of drugs. Type I drugs dissociate rapidly from the lipid surface and Type II drugs display at least two distinct kinetic phases during the binding and the dissociation. This suggests diffusion of the drug into the phospholipid bilayer. This can be one of the reasons for the need of a dual-fractal analysis (instead of single-fractal analysis) to adequately describe the association (binding) of the drug-liposome interaction. The second reason can be the sigmoidal shape of the binding curve. A sigmoidal curve is usually observed when there is a change in the binding mechanism. For the dissociation case, there is a sharp decrease in the response, suggesting a single mechanism at work, justifying the use of single fractal analysis.
As in the protein-heparin example, as the liposome suspension concentration increases, the binding as well as the dissociation rate coefficient increases. This leads to an increase in the fractal dimension for binding and dissociation. The reason for this increase in the rate coefficients is the increase in heterogeneity on the sensor chip surface because of increase in density of liposome in solution. An increase in density gives rise to multiple collisions. This in turn increases the effective reaction order, which leads to an increase in the fractal dimension.[16]
The affinity values (kd/k) are also calculated and presented in Table 2. Both the affinity values, K1 (kd/k1) and K2 (kd/k2), exhibit decrease with increase in the concentration of the liposome.
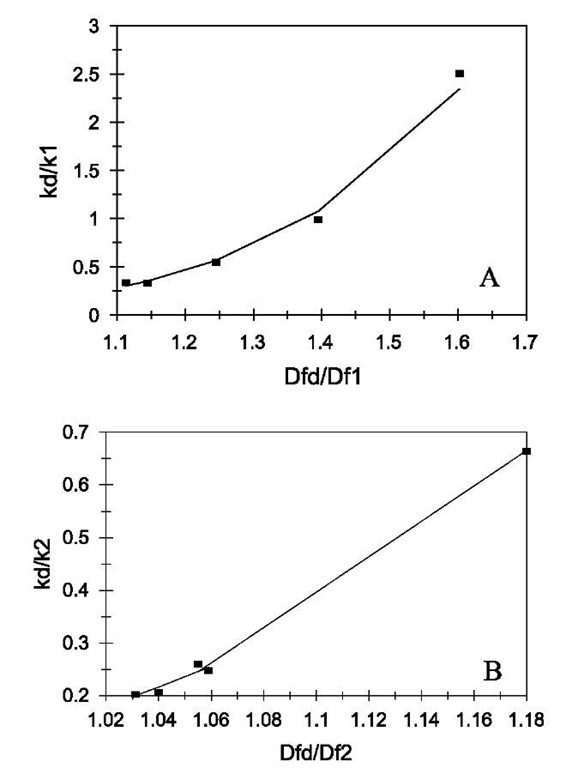
Fig. 6A shows the plot of K1 vs. the ratio Dfd/Df1. For the data analyzed of different concentrations of liposome, the affinity, K1, is given by:
Note that as indicated earlier, the units of kd and k1 are slightly different.
Fig. 6B shows the plot of K2 versus the ratio D^/Dq. For different concentrations of liposome analyzed, the affinity, K2, is given by:
Both Eqs. 5a and 5b suggest a strong dependence of the affinities on the ratio of fractal dimensions. For correct cell signaling, lower values of K are beneficial, whereas for incorrect cell signaling higher K values are beneficial. Knowing the relation of affinity with the fractal dimension (degree of heterogeneity) may suggest useful means by which appropriate interactions (to promote correct cell signaling) and inappropriate interactions (deleterious to health signaling) may be better controlled.
CONCLUSION
A fractal analysis of the binding and dissociation of protein-heparin and drug-liposome interactions along with the influence of different ligands on these interactions occurring on SPR biosensor applications is studied. This analysis provides a quantitative indication of the state of disorder or roughness in terms of fractal dimension on the biosensor chip surface and its effect on the binding and the dissociation rate coefficients and affinity values. This analysis can be considered as an alternate way to understand the kinetics on the heterogeneous surface with diffusion-limited reactions occurring toward structured surfaces.
For example, data taken from the literature[3,4] is reanalyzed to include the degree of heterogeneity present on the surface and its influence on the binding and the dissociation kinetics. The analysis of both the binding and the dissociation steps provide a more complete picture of the reaction occurring on the sensor chip surface. The fractal analysis also provides a value of the affinity, K (the ratio of the dissociation rate coefficient, kd, and the binding rate coefficient, k). The K values obtained may give us an idea or provide a basis for selective modulation of the surface, thereby changing the binding as well as the dissociation reactions in desired directions. This has biomedical as well as environmental implications.
The degree of heterogeneity can be quantitatively measured in terms of the fractal dimension. The degree of heterogeneity is affected by the presence of ligands on the sensor chip surface. In general, the degree of heterogeneity for the binding and the dissociation phases is different. Both types of examples are presented wherein either a single- or a dual-fractal analysis is required to adequately describe the binding and/or the dissociation kinetics. The dual-fractal analysis is used only when the single fractal analysis did not provide an adequate fit (sum of least squares less than 0.97). This was done by regression analysis provided by Quattro Pro.
Predictive expressions are developed for the affinities, K1 (kd/k1) and K2 (kd/k2), as a function of the ratio, Dfd/Df1 and Dfd/Df2, respectively. The fractal dimension for the binding or the dissociation phase is not a typical independent variable and cannot be directly manipulated. The predictive relationships provide a means by which these binding or the dissociation rate coefficients may be manipulated by changing either the analyte concentration in solution or the degree of heterogeneity that exists on the surface. Note that a change in the degree of heterogeneity on the surface would, in general, lead to changes in both the binding as well as the dissociation rate coefficient. Thus, a careful consideration is required to get the desired result.
It is interesting to note that the fractal surface leads to turbulence, which enhances mixing, decreases diffusional limitations, and leads to an increase in the binding rate coefficient.[17] This also applies to the dissociation rate coefficient. For this to occur, the characteristic length of this turbulent boundary layer may have to extend a few monolayers above the sensor surface to affect bulk diffusion to and from the surface. However, given the extremely laminar flow regimes in most biosensors this may not actually take place. A fractal surface is characterized by grooves and ridges, and this surface morphology may lead to eddy diffusion. This eddy diffusion can then help to enhance the mixing and extend the characteristic length of the boundary layer to affect the bulk diffusion to and from the surface.
In both of the examples discussed above, as the concentration of ligand on the sensor chip surface (for the protein-heparin case) or in solution (for the drug-liposome case) increases, there is an increase in the binding as well as in the dissociation rate coefficient.
Even though the analysis is presented for these interactions occurring on biosensor surfaces, they do provide insights into these reactions occurring on cellular surfaces. More such studies are required to determine if the binding and dissociation rate coefficients are sensitive to the degree of heterogeneity that exists on the biosensor or cellular surfaces. The analysis should encourage cellular experimentalists, particularly people dealing with analyte-nuclear receptor reactions, to pay increasing attention to the nature of the surface and how it may be modulated to control cellular analyte-nuclear receptor reactions in desired directions.


