INTRODUCTION
Under a range of technologically interesting conditions, films of metals, certain oxides, and semiconductors grow or etch via two-dimensional island formation. Atomic-scale control of the resulting island distribution and final morphology of these films depends on a detailed understanding of these early stages of island formation. This, in turn, requires a precise treatment of the environment dependence of adatom or ad-vacancy capture by other ada-toms or ad-vacancies and by growing islands. In particular, the evolution of the densities of islands of different sizes (i.e., of the island size distribution) reflects the form of the ”capture numbers” and specifically their dependence on island size, which measures the propensity for islands of different sizes (in a variety of environments) to capture diffusing ad-species.[1-3] One current challenge is the formulation of both an analytic treatment of the observed form of the ”capture numbers” and new simulation strategies for analysis of the asymptotic behavior of models of island formation, in the regime of large characteristic lengths, which is still expensive to simulate with conventional algorithms.
Traditional mean-field rate-equation treatments,1-4-1 in which the typical environment of an island is assumed independent of its shape and size, fail to reproduce the form and scaling properties of the island size distributions observed in experimental and simulation studies.[5-10] This has been a half-century-old challenge. Recent simulation studies revealed not only the well-known spatial correlation of island positions associated with depletion of the population of nearby islands (as a result of competition by islands for diffusing ad-species),[11] which has been incorporated into mean-field approaches,[4] but also a more subtle correlation between the size and separation of islands, which is still missing and is hard to fold into traditional mean-field approaches. It is the latter correlation that controls the individual island growth rates and the island size dependence of the ”capture numbers” and thus the selection of the shape of the island size distribution.
OVERVIEW
Key to quantifying and elucidating the development of this island size-spatial correlation is a precise characterization of island nucleation,[8-10] especially when nucle-ation is irreversible. A basic observation is that when only a few islands exist, nucleation occurs quasi-deterministical-ly, not surprisingly near the dominant maximum in the density of the diffusing ad-species. However, once a more complex landscape of islands develops, nucleation occurs more randomly, often near secondary maxima. Very importantly, these deviations from the dominant maxima allow for stronger correlations in the growth rates of neighboring islands.[10] They have not been characterized in detail in the literature.
Some of these basic features are best illustrated for a few-island system. A system of two-dimensional vacancy islands or pits, obtained by exposure of a Si(001) terrace to molecular oxygen,[7] is chosen below for this purpose. However, only results for larger simulation systems allow a statistically relevant characterization of the island nuc-leation process, i.e., the typical behavior and fluctuations. In particular, one is interested in assessing the generally expected tendency for islands to nucleate near the boundaries of a suitable tessellation of the surface (into so-called ”capture areas or cells”) based on the island positions. This information is essential to guide the development of simpler, geometric-like, and computationally less-expensive models of island formation.[12]
The main goal of this work is then to provide exact predictions of island nucleation obtained from kinetic Monte Carlo (KMC) simulations of a realistic model of island formation during deposition or etching. The focus is entirely on the simplest case of irreversible two-dimensional island formation, via homogeneous nucle-ation, mediated by isotropic diffusion of ad-species. Work on the reversible case has just begun. Several quantities describing spatial features of the nucleation process are monitored in the simulations. The results show that they are generally characterized by broad probability distributions, implying a broad spread of environments for islands of each size. This feature underlies observed scaling properties.
OUTLINE
The remainder of this work is organized as follows. The next section describes the experimental and simulation study of the system of a few islands formed irreversibly during the etching of a large Si(001) terrace at high temperatures and oxygen pressures. This example illustrates perfectly the failure of purely deterministic models of island formation to even qualitatively predict basic aspects of island nucleation, such as the sequence of nucleation events, the resulting spatial arrangement of the islands, and, ultimately, their individual growth rates. For quantitative predictions for irreversible island formation, a general model and simulations are then developed, which also serve to illustrate the unique power of simulations to address these nucleation issues. The goal is to describe in detail the exact nature of the nonequilibrium spatial correlations that develop during the nucleation process and thereby predict, using suitable measures, the expected impact of a nucleation event on the evolution of a large system of islands.
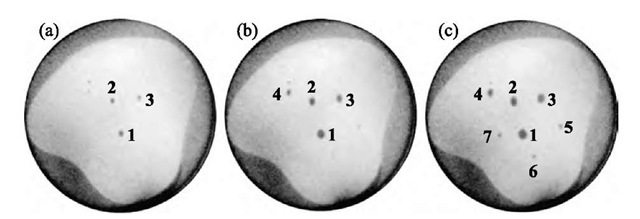
Fig. 1 Dark-field LEEM images, a few seconds apart, recorded during the etching of a 10-pm-wide terrace at 1235 K, in an oxygen pressure in the 10" 7 Torr range. Darker gray regions have lower height. The islands are labeled in the order in which they nucleated.
A FIRST VIEW OF ISLAND NUCLEATION: ETCH PITS ON Si(100)
As mentioned above, a small system of islands can provide a direct view into basic aspects of the island nucleation process and motivate and guide specific studies on larger systems. In fact, the etching study described here is one of the existing few that have provided a real time, in situ view of island nucleation. The actual nucleation positions of the etch pits, recorded with low-energy electron microscopy (LEEM), were compared with predictions from solving the diffusion equation for the ad-vacancy species density, with appropriate boundary conditions, and from kinetic Monte Carlo (KMC) simulations. The solution of the diffusion equation was used to study simplified, deterministic rules of island formation, which fail to describe the exact behavior observed in the KMC simulations.
Basic Experimental Observations
At elevated temperatures (> 1000 K), exposure of a clean Si(001) surface to molecular oxygen leads to the production of volatile SiO and a net removal of Si from the surface. No oxide layer develops. On large, step-free surfaces, this active etching process begins with the nucle-ation of two-dimensional vacancy islands or pits, as illustrated in the sequence of LEEM images in Fig. 1. The LEEM images were formed using the (1/2,0) beam associated with one of the (2 x 1) reconstruction domains of the Si(001) surface, resulting in contrast across adjacent terraces. Islands are the darker gray regions in Fig. 1. Under continued oxygen exposure, these islands grow, each at a rate that directly reflects the local distribution of neighboring islands.[7] Islands with large ”capture areas” (like island no. 3 in Fig. 1) grow much faster than those with many close neighbors, indicative of a diffusion-mediated island formation process. The observed island growth rates have been reproduced quantitatively1-7,13-1 in simulations of a model that assumes irreversible incorporation of ad-vacancies at the edge of near-elliptical islands and at the terrace outer step. The model has no free parameters because the ad-vacancy diffusion coefficient and (weak) anisotropy have been estimated from experimental data[14] and from first-principles calculations,1-15-1 and an estimate of the vacancy flux was obtained from a combination of etching experiments.1-7-1
Purely Deterministic vs. Stochastic Rules for Nucleation
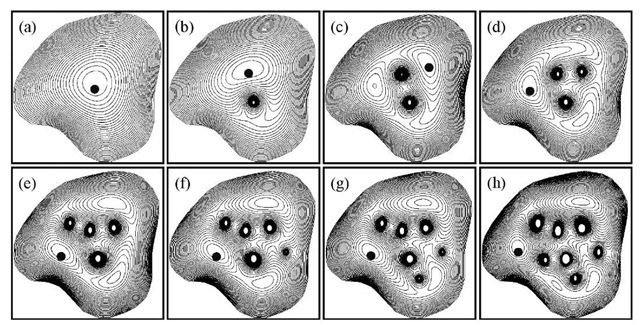
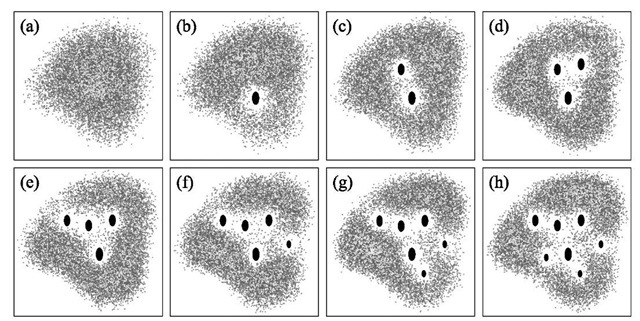
The issue of the island nucleation positions was not addressed in the work mentioned above. Fig. 2 shows clearly that a purely deterministic rule for nucleation, by which islands nucleate at the instantaneous global maximum of the ad-vacancy species density, produces a different ”time” sequence of nucleation events and a different final island spatial configuration (reflecting the near sixfold symmetry of the terrace) than experiment.1-16-1 The maxima were obtained by solving the steady-state diffusion equation, DV2n+F =0, with absorbing boundary conditions (n=0) at the edges of previously nucleated islands and at the outer terrace step. Here D is the diffusion coefficient of the ad-vacancy species, n is the ad-vacancy species density, and F is the net flux (chosen as estimated from experiment[7]). Even if the actual positions of previously nucleated islands are assumed, deviations in the location of the next nucleation event from the instantaneous global maximum, toward a secondary maximum, are typical (Fig. 3). Kinetic Monte Carlo simulations confirm that, indeed, nucleation is a stochastic process. In Fig. 4, island nucleation positions were marked for several millions of nucleation events obtained during irreversible island formation (consistent with the model that matched the island growth rates at a lower oxygen pressure or lower flux.[7,13]) The nucleation conditions and initial island configurations are the same as for Fig. 3 (except that the steady-state condition was not assumed a priori). These simulation results show a considerable spread in the regions of significant nucleation probability, well beyond the neighborhood of the global and secondary maxima.
Fig. 2 Comparison between (a) the actual island nucleation positions observed with LEEM and (b) the predictions of a purely deterministic nucleation rule based on the location of the instantaneous global maximum of the ad-vacancy species density.
Pit Positions Relative to Diffusion Cell Boundaries
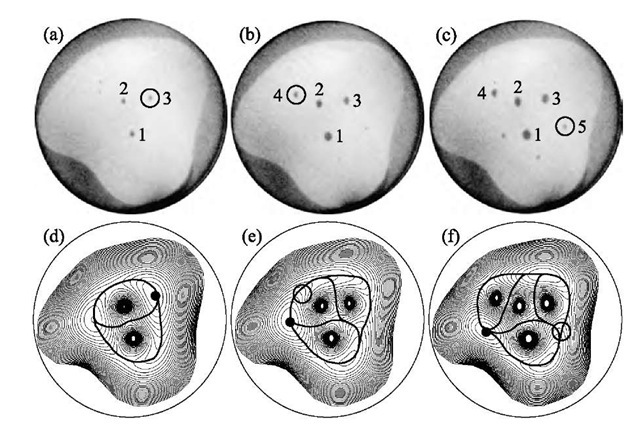
Finally, it is interesting to compare the actual island nucleation positions for the Si(001) system with the location of the boundaries of a tessellation of the terrace based on the numerical solution of the steady-state diffusion equation for the ad-vacancy species density. The net flux of diffusing ad-vacancies is zero across the boundaries of the tessellation cells (”diffusion cells” or DCs). Inside each DC associated with an island, the lines of flux converge to that island. It is thus easy to show that the free area inside a DC is exactly proportional to the rate of diffusion-mediated ad-vacancy capture by the associated island.[5,6] For this small system of islands, the nucleation positions appear all near the DC boundaries (Fig. 5). However, for larger, statistically more relevant systems of islands, the results are more complex. In fact, the probability of island nucleation is nonzero and fairly high in wide regions around the DC boundaries, extending well inside the cells. This feature is revisited below.
Fig. 3 Contours of the ad-vacancy species density from the numerical solution of the steady-state diffusion equation with absorbing boundary conditions at island and step edges, for each partial set of islands observed in the experimental sequence of Fig. 1. The position of the instantaneous global maximum is marked with a dot. Only the 1st, 2nd, and 3rd islands nucleate near the global maximum.
Fig. 4 Simulation results for the spatial distribution of nucleation events during the etching of the Si(001) terrace of Fig. 1. Each dot marks the location of a nucleation event for the partial island configuration shown in each panel. The color of the dots is chosen according to the probability for nucleation, which increases from red to blue to green to yellow.
GENERAL BEHAVIOR OF MODELS OF IRREVERSIBLE ISLAND FORMATION
Basic Model Prescription
During irreversible island formation on a single-crystal surface, represented by a regular array of adsorption sites, ad-species are created randomly at rate F per adsorption site, they hop between adjacent sites at total rate h, irreversibly nucleate new islands upon meeting, and irreversibly incorporate into existing islands upon aggregation. Compact, near-equilibrium island shapes are chosen whenever island-shape restructuring upon capture of ad-species by islands is efficient on the timescale of aggregation. To describe behavior at very low coverages, when islands cover only a small fraction of the surface, one can consider simpler ”point-island” models,[17] in which islands occupy a single site, but carry a label indicating their size. Point-island models are especially useful to separate correlations that develop during the island formation process from other subtle effects because of the island finite extent. Fig. 6 compares island configurations for point- and near-square islands. Measured two-point correlation functions for the positions of the island centers show similar results for the two models at submonolayer coverages. The basic shape of the island size distribution is also similar.
Fig. 5 Comparison between (a)-(c) the actual nucleation position of the 3rd, 4th, and 5th island and (d)-(f) the location of the DC boundaries for the configuration of islands that exist prior to nucleation. As in Fig. 3, the dot in each panel marks the location of the global maximum of the ad-vacancy species density.
Basic Algorithm for Simulation
To characterize the general behavior of the model, an L x L square lattice (typically with L> 1000) is used, with periodic boundary conditions. Ratios h/F typical for many systems are larger than 107, requiring for efficiency that one keep a compact list of the positions of all hopping ad-species. With probabilities proportional to total rates, one randomly chooses between creation (total rate L2F) and hopping (total rate h times the number of hopping ad-species). For the former, one randomly chooses a site. For the latter, one randomly chooses an entry from the list, which is updated after each hopping, creation, or aggregation event.
Analyses
For understanding various spatial features of island nucleation and the detailed shape of the island size distribution, a central concept already introduced above is that of ”capture zones” (CZs) associated with each island. Because construction of ”exact” CZs based on the solution of the diffusion equation for the ad-species density is nontrivial and computationally expensive, it is convenient (and often a reasonable approximation) to construct CZs based on geometric tessellations of the surface that reflect the island spatial arrangement. The simplest possibility is to use Voronoi cells (VCs), which are based on the distance between the island centers. Sites within a VC are closer to the center of the associated island than to that of any other island. A more realistic alternative for islands of finite extent is to use ”edge cells” (ECs), which are based on the distance to the island edges.[6] The tessellations of VCs and ECs coincide for point-islands.
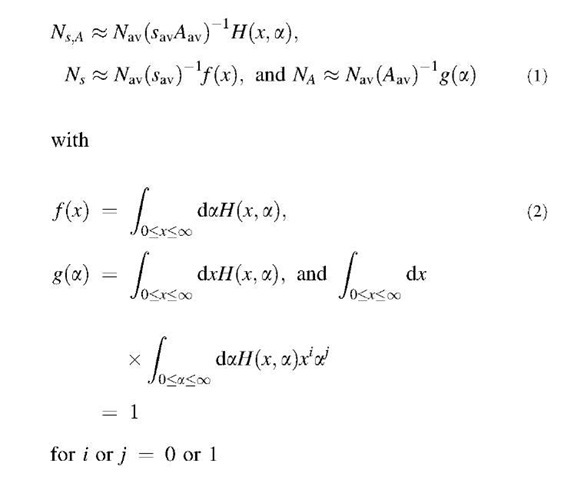
In the simulations, one can readily monitor several quantities of interest. In particular, from Ns>A, the density of islands of size s and CZ area A (s and A measured in
scaled variables x = s/sav and a = A/Aav and defines scaling functions H(x,a), fx), and g(a) such that
Fig. 6 Simulation snapshots (400 x 400 sites) of typical configurations of (a) point-islands (sav = 255, Aav = 2550) and (b) near-square islands (jav = 459, Aav=4590), for h/F =1010, 6=0.1 ML. The labels are the island size (in bold, in units of atoms) and the area of the EC of the island (in units of sites), which includes the island ”footprint.”
As indicated above, the focus here is on quantities that characterize basic aspects of the island nucleation process, motivated by the realization that they influence the selection of the shape of the scaling functions H, f, and g.[2,8-10] Such quantities include the distribution of CZ areas for just-nucleated islands, the distribution of the number of existing islands whose CZ’s are reduced by each nucleation event, the fraction of area that each contributes to the CZ of a just-nucleated island, and some measure of the tendency for nucleation to occur near the boundaries of the CZs. Whenever significant, behavior for point-islands is compared with that of near-square islands.
CHARACTERIZATION OF THE ISLAND NUCLEATION PROCESS
The Nucleation Rate
In the initial stages of irreversible island formation, on an initially empty substrate, one expects a transient regime where the ad-species concentration increases linearly with time, in proportion to the flux, F, followed by a steady-state regime where gain of ad-species is roughly balanced by loss as a result of aggregation with existing islands. For small 6, one can write simple rate equations for the diffusing ad-species density, N1, and for Nav, that can capture this behavior. Keeping only the dominant terms (for large h/F), one has for isotropic diffusion
measure the pro-pensity for diffusing ad-species to be captured by other diffusing ad-species or by islands, respectively. Logarithmic corrections are discussed in Ref. [17]. It follows that
in the transient regime, where
in the transient regime, where
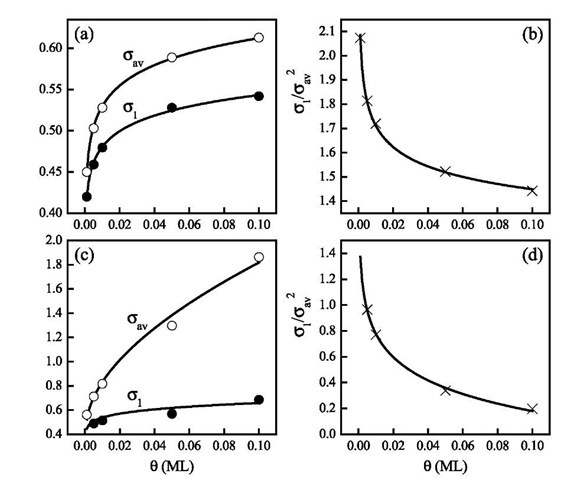
in the steady-state regime (dN1/dt~0), where 6^ 6*. Simulation data for point-islands shown in Fig. 7 are consistent with s1 and s1/sav2 weakly dependent on 6. In fact, simulation data shown in Fig. 8 suggest the relation s1/sav2«0.606/0.6952« 1.25, for not too small 6 > 0.01.
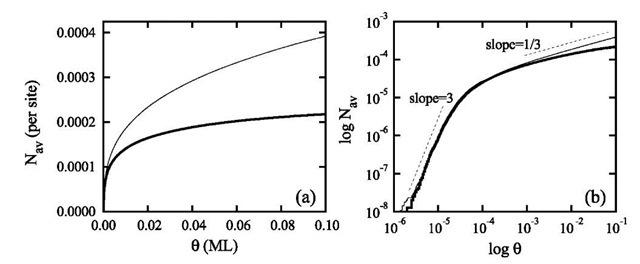
Fig. 7 Simulation results for the evolution of the average island density, Nav, for point-islands (thin solid line) and near-square islands (thick solid line), for h/F =1010, 6 < 0.1 ML. Statistics were obtained for nearly 200,000 point-islands and 100,000 near-square islands.
For sufficiently large h/F values, one also finds from the simulation data that
in the steady-state regime, again consistent with s 1 and s1/ sav2 weakly dependent on 6. At fixed 6, Eqs. 6 and 7 give also the h/F dependence of the densities for finite-extent, compact islands (near-square islands are used here). However, the steady-state 6 dependence (at fixed h/F) is significantly modified from point-island scaling, even for small 6^1. For example, for h/F =1010, the deviation between point-island and near-square island behavior, i.e., the difference in the actual values of Nav in Fig. 7(a) and in the scaling with 6 in Fig. 7(b), is significant already for coverages on the order of 10—3 ML. These differences reflect stronger 6 dependence (in the form of logarithmic corrections) of s1/sav2 for near-square than for point-islands. This is because of more efficient capture of random walkers by finite-extent islands than by point-islands. More details are shown in Fig. 8. For near-square islands, one finds s 1/sav2/ —ln(6), in the range of 6 considered here, so, from Eq. 5, one gets Nav/61/3 [— ln(6)]1/3, the ln(6) factor producing the observed saturation of Nav with 6 shown in Fig. 7. If one assumes the form Nav=g(h/F)—W, at each fixed 6, then one finds for the effective exponent w and prefactor g the values W=0.24, 0.29, 0.30, 0.31, and 0.31 and g=0.022, 0.12, 0.19, 0.38, and 0.49 (consistent with the relation g«1.0861/3; Fig. 8) for point-islands and w=0.26, 0.31, 0.32, 0.33, and 0.33 and g=0.028, 0.15, 0.23, 0.42, and 0.49 for near-square islands, at fixed 6=0.001, 0.005, 0.01, 0.05, and 0.1 ML, respectively, for 108 < h/F< 1010.
Finally, for both point-islands and near-square islands, note that the island density Nav — (h/F)—1/2 at the onset of the steady-state regime, 6 — 6 , is well below the steady-state value of Nav- (h/F)—1/3. Thus most nucleation occurs in the steady-state regime, in which the next sections focus.
Fig. 8 Simulation results for the dependence of s1 (solid circles) and sav (open circles) on 6 for (a) point-islands and (c) near-square islands, for h/F = 108, 0.001 ML < 6 < 0.1 ML. In (a), the lines are the fits s1 = 0.606+ 0.0272ln(6) and sav = 0.695+ 0.0358ln(6). The fits in (c) are not as simple. Simulation data (symbols) for the fraction s1/sav2 are shown in (b) for point-islands and in (d) for near-square islands. Nearly perfect fits (lines) are obtained with s1/sav2=1.11 — 0.136ln(6) in (b) and s1/sav2 = — 0.417 — 0.259ln(6) in (d). In (d), but not in (b), the logarithmic term dominates in the range of 6 considered.
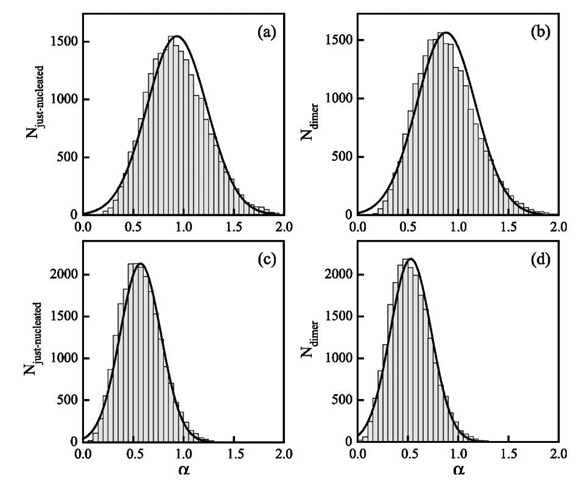
Fig. 9 Scaled area distributions (a=A/Aav) for (a)-(b) VCs of point-islands (Aav = 612.7 sites) and (c)-(d) ECs of near-square islands (Aav = 979.4 sites) of size s= 2, obtained with h/F = 108, 6=0.1 ML. In (a) and (c), data are for just-nucleated dimers only, and in (b) and (d), data are for all dimers. The average dimer areas are Ajust-nucleated~0.93Aav (0.57Aav) and A2~0.88Aav (0.53Aav) for point-islands (near-square islands). The distributions are slightly skewed relative to a Gaussian (line fits).
