INTRODUCTION
As nanoscale graphitic structures, carbon nanotubes are of great interest not only for their electronic and mechanical properties, but also for their thermal properties. Because of their small size, quantum effects are important, and the low-temperature specific heat and thermal conductivity show direct evidence of 1-D quantization of the phonon bandstructure. Modeling of the low-temperature specific heat allows for determination of the on-tube phonon velocity, the splitting of phonon subbands on a single tube, and the interaction between neighboring tubes in a bundle. The thermal conductivity of nanotubes has been examined both theoretically and experimentally. Theoretical work predicts a room-temperature thermal conductivity that is larger than graphite or diamond. Measurements show a room-temperature thermal conductivity over 200 W/m K for bulk samples of single-walled nanotubes (SWNTs), and over 3000 W/m K for individual multiwalled nanotubes (MWNTs). Addition of nanotubes to epoxy resin can double the thermal conductivity for a loading of only 1%, showing that nanotube composite materials may be useful for thermal management applications.
The first part of this manuscript discusses theoretical and experimental work on the specific heat of nanotubes. The section ”Specific Heat” provides an introduction to specific heat. In the section ”Phonon Density of States,” the theoretically derived phonon density of states of na-notubes and nanotube bundles is compared to that of 2-D graphene and 3-D graphite. In ”Theoretically Derived Specific Heat,” the measured specific heat of nanotubes is compared to theoretical models.
The second part of this manuscript reviews the thermal conductivity of nanotubes. The first section provides an introduction to thermal conductivity. The section ”Thermal Conductivity: Theory” discusses theoretical treatments of the thermal conductivity. ”Measured K(T) of SWNTs” reviews measurements of the thermal conductivity of single-walled nanotubes, and ”Measured K(T) of MWNTs” reviews measurements of the thermal conductivity of multiwalled nanotubes. Finally, ”Applications” describes thermal conductivity measurements of nanotube-based composites.
Specific Heat
The specific heat C(T) of a material is a sensitive probe of the low-energy excitations. In 3-D graphite, 2-D graphene, and nanotubes, phonons are the dominant excitations, and the phonon specific heat Cph dominates C(T) at most temperatures. Cph depends on the phonon density of states r(o), and can be obtained by integrating p(o) together with a temperature-dependent convolution factor accounting for the temperature-dependent occupation of each phonon state[1]
At a given temperature T, the convolution factor decreases from a value of 1 at o=0 to a value of ~ 0.1 at ho=kBT/6, so that phonons above this energy do not appreciably contribute to the specific heat. In general, Eq. 1 must be evaluated numerically.
At low temperatures, Cph probes only the lowest energy phonons. These are the acoustic modes, whose dispersion can often be expressed as a power law, p(o)/ka. For a single such mode, Eq. 1 simplifies to
where d is the dimensionality of the system. For a linearly dispersing mode (a = 1), the specific heat is linear in T for a 1-D system, and shows the familiar Debye T3 behavior for a 3-D system.
Phonon Density of States
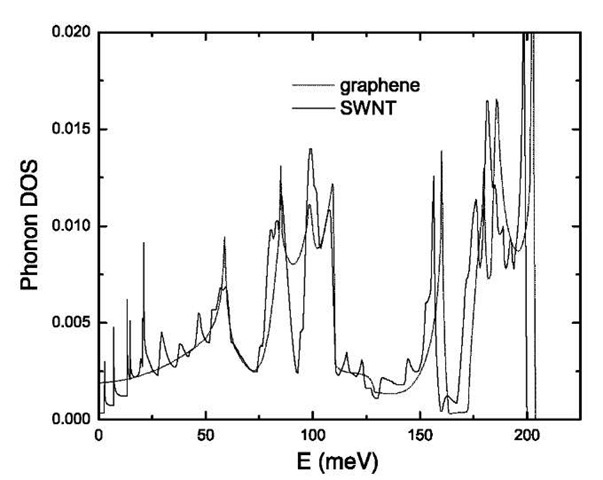
The phonon bandstructure of isolated nanotubes has been calculated by Saito et al.[2,3] and by Sanchez-Portal et al.[4] From the bandstructure, it is straightforward to calculate the phonon density of states. Fig. 1 shows the phonon density of states of a (10,10) nanotube, compared to the density of states of a single 2-D sheet of graphene. When a graphene sheet is ”rolled” into a nanotube, the 2-D bandstructure folds into a large number of 1-D subbands. For a (10,10) tube, for instance, the six phonon bands (three acoustic and three optical) of the graphene sheet become 66 separate 1-D subbands. A direct result of this folding is that the nanotube density of states has a number of sharp peaks as a result of 1-D van Hove singularities, which are absent in graphene and graphite. In spite of the presence of these singularities, the overall density of states is similar at high energies, so that the high-temperature specific heat should be roughly equal as well. This is to be expected: the high-energy phonons are more reflective of carbon-carbon bonding than the geometry of the graphene sheet.
Fig. 1 Phonon density of states of an isolated SWNT (solid line), compared to a 2-D graphene sheet.
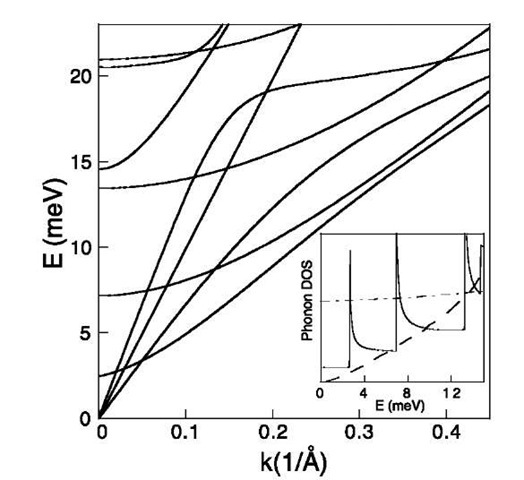
At low energies, the geometry of the nanotube causes the phonon structure to substantially differ from that of the parent graphene sheet. Fig. 2 shows the theoretically derived low-energy phonon bandstructure of an isolated (10,10) nanotube. There are four acoustic modes (those with O! 0 as k! 0). All four have a linear dispersion, o = vk, near the zone center. The longitudinal (LA) mode has v = 24 km/sec, the (doubly degenerate) transverse (TA) mode has v=9 km/sec, and the ”twist” mode has v =15 km/sec. The first (doubly degenerate) optical mode enters at 2.7 meV.
The inset to Fig. 2 shows the nanotube phonon density of states (solid line) derived from the bandstructure shown. Only the four acoustic modes are present below 2.7 meV, producing a constant density of states. At the band edge of each optical mode, the density of states displays a van Hove singularity characteristic of 1-D dispersion, and increases stepwise. By comparison, 2-D graphene and 3-D graphite have very different low-energy phonon structure. The dot-dashed line shows the phonon density of states for an isolated graphene sheet:[3] p(o) is large and roughly constant at low energy, and does not extrapolate to zero at zero energy. This is because a graphene sheet has an out-of-plane acoustic mode (corresponding to a sheet-rolling motion) that is quadratic in energy. For a 2-D system, this corresponds to a constant p(o). The phonon density of states for 3-D graphite, shown as the dashed line in the inset to Fig. 2, is significantly smaller than that of 2-D graphene, and approaches zero at k=0. This is because interlayer coupling introduces dispersion in the z direction, and moves low-energy states upward in energy. The characteristic energy scale for this process is the Debye energy ED? of the interlayer modes, which is roughly 10 meV.
Fig. 2 Low-energy phonon bandstructure of an isolated (10,10) SWNT. The inset shows the low-energy phonon density of states, compared to that of 2-D graphene and 3-D graphite.
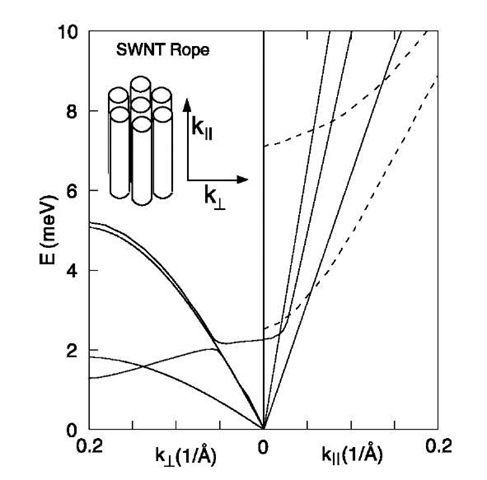
Fig. 3 Calculated low-energy phonon bandstructure of a SWNT bundle, for the case of graphite-like (”strong”) coupling.
By analogy to the case of graphite, intertube interaction in bundles should depress the low-energy density of states in SWNT bundles. The characteristic energy for this process is the Debye energy of intertube modes. Because of the heterogeneous nature of nanotube bundles, it is difficult to calculate these modes theoretically. Mizel et al.[5] considered the case in which the coupling is graphite-like. By adjusting standard coupling constants for graphite for the case of tubular structures, they derived a bandstructure that has 5 meV. However, because of issues of incommensurability between neighboring nanotubes, the true intertube coupling is likely to be weaker than this. Fig. 3 shows the 3-D dispersion of the nanotube acoustic modes calculated by Mizel et al.
Theoretically Derived Specific Heat
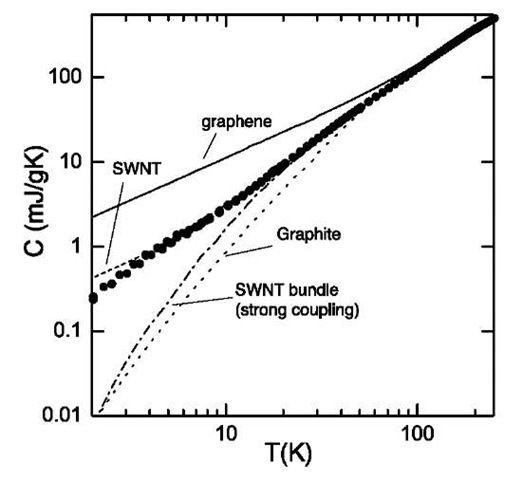
For a given p(o), it is straightforward to calculate C(T) using Eq. 1. The lines in Fig. 4 show the specific heat calculated from the known phonon bandstructure of graphene and graphite, from the predicted bandstructure of an isolated SWNT, and from the predicted bandstruc-ture of a SWNT bundle in the case of graphite-like (”strong”) coupling. At temperatures above ~ 100 K, the specific heat of all four materials is quite similar. However, at lower temperatures, the specific heats diverge substantially. The isolated graphene sheet displays the largest specific heat, which is roughly linear in T because of the 2-D quadratic sheet-rolling mode. The isolated nanotube specific heat is smaller, as a result of the absence of the rolling mode. At the lowest temperatures, the isolated nanotube C(T) is linear in T. The contribution of each acoustic mode to C(T) is can be analytically expressed:[6]
Fig. 4 Calculated specific heat (lines) of graphene, isolated SWNTs, graphite, and strongly coupled SWNT bundles. The solid points represent the measured specific heat of a bulk sample of SWNTs.
where pm is the linear mass density. Above ~ 8 K, the slope of C(T) increases, as the optical subbands begin to contribute. The linear behavior at low T is a direct signature of the 1-D quantized nature of the nanotube phonon bandstructure. Interlayer coupling (in graphite) and intertube coupling (in strongly coupled bundles) depresses the C(T) at low T. In real samples, the temperature at which the measured C(T) diverges from the single-tube curve provides measure of the actual in-tertube coupling.
Electronic Specific Heat
A metallic SWNT is a one-dimensional metal with a constant density of states near the Fermi level. At low temperatures, it will have an electronic heat capacity that is linear in temperature, with a magnitude given by.[6]
where vF is the Fermi velocity. Because there are four acoustic phonon modes, the ratio between the phonon and electron specific heat is
so that, as expected, the phonon contribution will dominate the electron contribution.
Measured Specific Heat of SWNTs
The solid circles in Fig. 4 represent the measured specific heat of a bulk sample of highly purified single-walled nanotubes over the range 2-300 K.[7] The measured C(T) data agree with all of the theoretical curves at high T, as is to be expected; this is a good confirmation that experimental errors such as sample contamination were not significant. At low T, the measured C(T) follows the predicted curve for isolated SWNTs over almost the entire temperature range, diverging below the single-tube curve only below ~ 5 K. This surprising result indicates that the tube-tube coupling in real samples is substantially weaker than would be expected from a straightforward analogy to graphite.
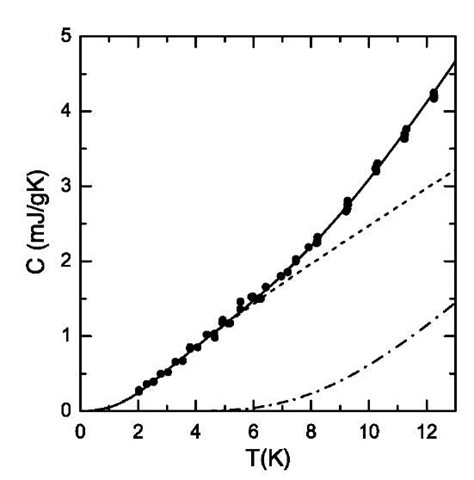
Fig. 5 highlights the specific heat data at low temperature. The measured C(T) shows a linear temperature dependence from 2 to 8 K, with an upturn above 8 K. This behavior is a direct signature of the 1-D quantized nature of the SWNT phonon bandstructure, as discussed above. The lines in Fig. 5 represent the results of fitting the measured data to a simplified theory that takes into account intertube coupling. The low-energy phonon structure is simplified to include two phonon modes: a fourfold-degenerate acoustic mode with (high) on-tube Debye energy ED and (low) transverse Debye energy ED?; and a doubly degenerate optical subband with a band minimum at Esub. The lines shown are obtained after varying all three parameters to obtain the best fit to the data. The dot-dashed line represents the contribution from the acoustic modes, with ED=92 meV and ED? = 1.2 meV. Its contribution is roughly cubic at low temperatures, then roughly linear above ~ 2 K, corresponding to the saturation of the intertube modes. The dashed line represents the contribution from the optical mode, with Esub=4.1 meV. This mode begins to contribute at ~ 7 K, and the sum of the two contributions (solid line) fits the data well over the entire range from 2-12 K, above which it can be expected that other optical subbands will begin to contribute.
Fig. 5 Measured specific heat of SWNTs at low temperature, fit with a simplified model. The fitting parameters are given in the text.
The values for the fitting parameters in this model are directly related to the mechanical properties of nanotube bundles. The measured value of ED (92 meV) agrees well with the value of 103 meV that can be derived from theory, confirming the high phonon velocity in the tubes, which is a direct result of their high Young’s modulus and low density. On the other hand, the value of ED? is much weaker than would be expected from a simple analogy to graphite. This indicates that coupling between the tubes in bundles is very weak, an issue that will need to be carefully considered for applications such as high-strength composites. The measured value of Esub (4.1 meV) is slightly larger than the theoretically derived value of 2.7 meV, which may be a result of mode stiffening due to radial tube-tube interaction. In fact, the measured value is in good agreement with theoretical calculations for nanotube bundles.[8] An unresolved issue is the seeming contradiction between the weak tube-tube coupling implied by the low transverse Debye energy, and the stiffening of the first optical mode. It may be that bundles are relatively well coupled radially, but are weak in shear. Detailed theoretical investigation of this matter is still needed.
THERMAL CONDUCTIVITY
Because of the high thermal conductivity of diamond and graphite, it is interesting to examine whether nano-tubes exhibit high thermal conductivity, a property that might complement their extraordinary electrical and mechanical properties. This property has been addressed theoretically for single tubes, experimentally for bulk samples of SWNTs, and experimentally for individual multiwalled nanotubes
In general, the thermal conductivity K is a tensor quality, but for this discussion, it is only important to consider the diagonal elements:
where C is the specific heat, and vz and t are the group velocity (v=do/dk) and relaxation time of a given phonon state. At low temperatures (T^ 0D), the relaxation time is determined by scattering off of fixed impurities, defects, sample boundaries, etc. and is roughly constant. Therefore in ordinary materials, the low-temperature thermal conductivity has the same temperature dependence as the specific heat. However, in anisotropic materials, this relationship does not strictly hold. Because the contribution of each state is weighted by the scattering time and the square of the velocity, the thermal conductivity preferentially samples states with high v and t. For instance, in graphite, the thermal conductivity parallel to the basal planes is only weakly dependent on the interlayer phonons. In SWNT bundles, it is likely that K(T) depends only on the on-tube phonons, rather than the intertube modes.
Thermal conductivity is of particular interest in low-dimensional systems. For a 1-D ballistic electronic channel, the electronic conductance is quantized, with a universal value of
Similarly, for a single ballistic 1-D channel, the thermal conductance is independent of materials parameters, and there exists a quantum of thermal conductance, which is linear in temperature.
Conditions for observation of this quantum were first examined in detail by Rego and Kirczenow.[9] Using lithographically defined nanostructures, Schwab et al.[10] confirmed this value experimentally.
At high temperatures, three-phonon Umklapp scattering begins to limit the phonon relaxation time. Therefore the phonon thermal conductivity displays a peak and decreases with increasing temperature. Umklapp scattering requires production of a phonon beyond the Brillouin zone boundary; because of the high Debye temperature of diamond and graphite, the peak in the thermal conductivity of these materials is near 100 K, significantly higher than for most other materials. In less crystalline forms of graphite, such as carbon fibers, the peak in K(T) occurs at higher temperatures, because defect scattering remains dominant over Umklapp scattering to higher tempera-ture.[11] In low-dimensional systems, it is difficult to conserve both energy and momentum for Umklapp processes,[12] and so it may be possible that Umklapp scattering is suppressed in nanotubes relative to 2-D or 3D forms of carbon.

