ABSTRACT
This paper presents experimental results on three kinds of concretes, plain concrete (PC), 1.5% and 3% steel fiber reinforced concrete (SFRC), subjected to dynamic tensile loading. The cylinder splitting (Brazilian disc) specimens are loaded by a modified Split Hopkinson Pressure Bar (SHPB) with various loading rates (100~500 GPa/s). From the experiments it is found that there is a significant enhancement in tensile strength with increasing loading rates. Crack gauges mounted on the specimen showed that the average fracture velocity of 3% SFRC during the test is 730 m/s whereas that of PC is 790 m/s. Both the tensile stress history and the recovered specimen have demonstrated that SFRC has superior resistance to crack initiation and crack propagation as compared with PC.
Keywords: Steel fiber reinforced concrete (SFRC); Brazilian Disc; SHPB; Fracture velocity
INTRODUCTION
Fiber reinforcement is one of the most important modification methods to alter the brittle nature of plain concrete (PC). The use of steel fiber reinforced concrete (SFRC) has been continuously increasing during the past decades because of its enhancement of material performance in toughness and crack control [1]. With the addition of steel fibers, SFRC shows an enormous increase in strength, toughness, and ductility from static mechanical tests [2]. As a result, SFRC has been widely used in many civil engineering structures. However due to its limitations in the flexibility and resistance to shrinkage cracking, it has been rarely used in bridge pavement.
The success of SFRC in structural engineering has encouraged the development of newer high performance materials for critical infrastructures subjected to extreme loadings. Among these loading cases, intense dynamic loading is a unique one because of the worldwide increase of terrorist attacks against civilian targets. It is thus critical to better understand the impact resistance of SFRC and methods to enhance its performance under such loadings [3].
Over the past few years, significant progress has been made in the characterization of dynamic properties of SFRC [4-7]. However, the tensile strength has rarely been measured. It is thus the objective of this work to quantify the dynamics tensile behaviour of PC and SFRC. We use the Brazilian disc sample and apply the dynamic load with a modified split Hopkinson pressure bar (SHPB) system. The influence of the loading rate and fiber volume fraction on dynamic tensile strength is studied. To illustrate the tensile failure process, crack velocities are monitored.
EXPERIMENT
Sample preparation and geometry
The concrete matrixes were designed for accommodating the volume fraction (Vf) of 0, 1.5% and 3% of steel fibers. The following materials were used in the fabrication of SFRC specimens: tap water, cement, steel fiber, standard sand, Silica fume, fly ash, water reducer and steel fiber. Tables 1 and 2 present the properties of raw material and the compositions of each component.
Table 1. The properties and manufactures of raw material
|
Properties |
|
|
|
|
|
Description |
Density g/cm3 |
Manufacture |
|
Cement |
Grade 42.5 |
- |
Huxin Cement Co., Ltd. |
|
Standard Sand |
Dia.: 0.25-0.65mm |
2.59 |
Xiamen ISO Standard Sand Co., Ltd. |
|
Silica Fume |
1250 Head |
2.15 |
GaofengMiners Powder Co., Ltd. |
|
Fly Ash |
Type I by JGJ28-86 |
2.2 |
Chonghui Fly Ash Co., Ltd. |
|
Water Reducer |
Poly Ling salt water reducer |
1.06 |
JinSheng Tci. and Tech. Co., Ltd |
|
Steel Fiber |
Dia.: 0.15-0.2mm Average length: 15mm |
7.8 |
Xintu Engineering Fiber Co., Ltd. |
Table2 The compositions of SFRC/PC
|
|
Water (W/B) |
|
Binder (B) |
|
Sand (S/B) |
Water Reducer (Solid Content) |
Steel Fiber (Vf) |
|
|
Cement (C) |
Silica Fume (SF/C) |
Fly Ash (FA/C) |
||||
|
1# |
0.2 |
1 |
0.3 |
0.25 |
1.18 |
1% |
0 |
|
2# |
0.2 |
1 |
0.3 |
0.25 |
1.18 |
1% |
1.5% |
|
3# |
0.2 |
1 |
0.3 |
0.25 |
1.18 |
1% |
3.0% |
The mixture was poured into a steel cubic mold (300 mm) for 2 hours. The block obtained was then cured in a standard condition of 20 °C and >95% relative humidity for 28 days. After curing, concrete cores with a nominal diameter of 50 mm were drilled from the block and then sliced to obtain discs with an average thickness of 24 mm. All the disc samples were polished afterwards resulting in a surface roughness variation of less than 0.5% of the sample thickness.
The modified Split Hopkinson Pressure Bar system
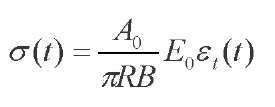
A 40 mm diameter SHPB system was employed as the loading apparatus in this study, as shown in Fig. 1. When the striker hit the incident bar, it generates an incident pulse in the incident bar. The incident wave travels through the flange without resistance because there is a gap between the flange and the rigid mass in the beginning. The incident pulse propagates along the incident bar to hit the sample, leading to reflected stress wave and transmitted stress wave. Denote the incident wave, reflected wave and transmitted wave by et, sr, and st. Based on the one-dimensional stress theory, and assuming the stress equilibrium prevails during dynamic loading (i.e., st +sr =et), we can determine the histories of the tensile stress a(t) within the sample as [8]:
where E0 is the Young’s modulus of the bar, and A0 is the area of the bar; R is the radius of the sample and B is the thickness of the sample.
Fig. 1. Schematics of the preloaded spit Hopkinson pressure bar (SHPB) system with the Brazilian disc specimen. In order to ensure single pulse loading, the momentum trap technique is adopted in our Hopkinson bar setup. Detailed explanation of the SHPB procedure and momentum trap can be found in the literature [9, 10].
EXPERIMENT RESULT
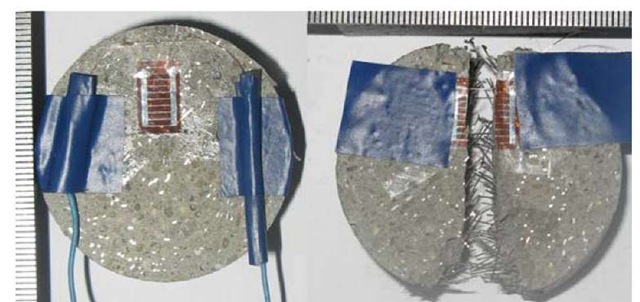
Fig. 2 shows the original and recovered SFRC specimens. The recovered crack gauge showed that the crack travels along the crack gauge. It also can be observed as the steel fibers are pulled-out from the fragments.
Fig. 2 The virgin and recovered SFRC specimen.
Dynamic force balance
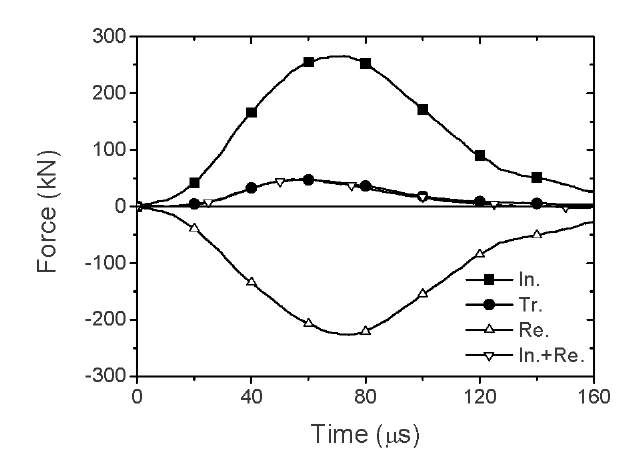
Fig. 3 shows the forces on both ends of the sample. The dynamic force on one side of the sample is the sum of the incident and reflected force waves, and the dynamic force on the other side of the sample is the transmitted force wave. It can be seen from Fig. 2 that the dynamic forces on both sides of the samples are almost identical during the whole dynamic loading period. We thus can use the equation mentioned above to determine the tensile strength.
Fig. 3. Dynamic force balance during a typical preloaded SHPB with the Brazilian disc specimen.
Effects of loading rate
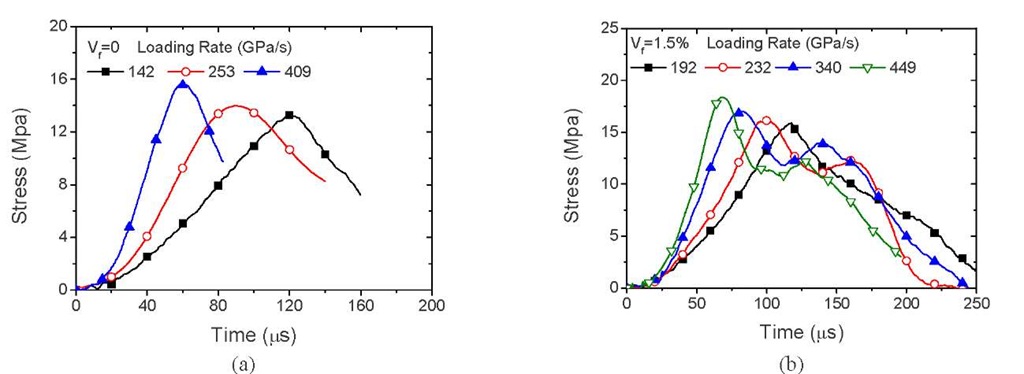
The tensile strength is the maximum value of the tensile stress history. There is a approximately linear region in a(t), and its slope is taken as the fracture loading rate, with which o varies. Fig. 4 shows some examples of stress versus time curves for different loading rates and two materials. One can observe how the maximum strength is reached for the three loading rates in different time due to the imposed loading rate. In the case of PC, the duration of the fracture process is about 120, 90 and 60 ^s for 142, 253 and 409 GPa/s, respectively; while for the 1.5% FRC, it has been obtained 120, 100, 80 and 68 ^s for 192, 233, 340 and 0.449 GPa/s, respectively.
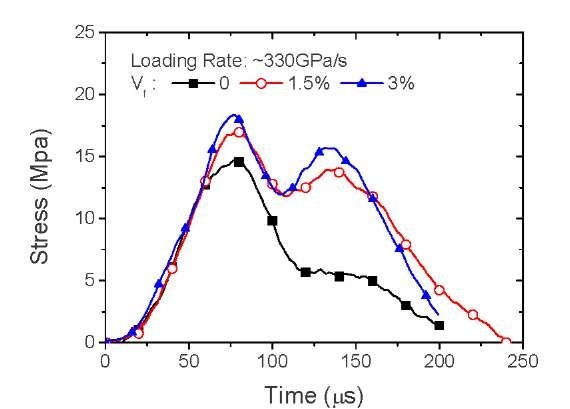
Fig.5 shows stress histories of different types of specimens with similar loading rate of 330 GPa/s. The tensile strength of the plain concrete is 14.7 MPa, while the one of 1.5% SFRC and 3% SFRC are 16.9 MPa and 19.3 MPa respectively. The post-peak ductility in the stress-time curve for the test of SFRC specimen shows the effect of reinforced fibers, as the steel fibers are being pulled-out from the materials. In addition, the post-peak ductility increases with increasing fiber volume fractions.
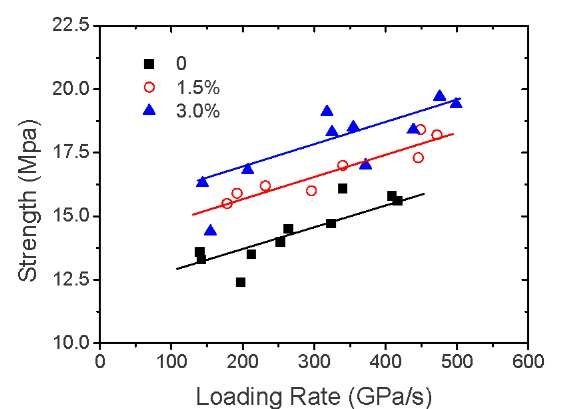
Fig.6 shows the conclusion of our tests. The tensile strength increase with increasing loading rates and fiber volume fractions. The slops of different materials are similar to each other.
Fig. 4. Stress versus time curves for different loading rates: (a) PC; (b) 1.5% SFRC
Fig. 5. Dynamic tensile histories of SFRC/PC specimens with various volume fractions.
Fig. 6. Tensile strength increase with increasing loading rates and fiber volume fractions.
Fracture velocity
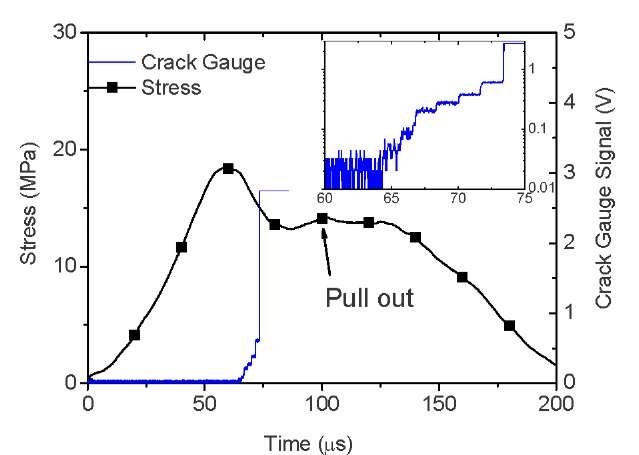
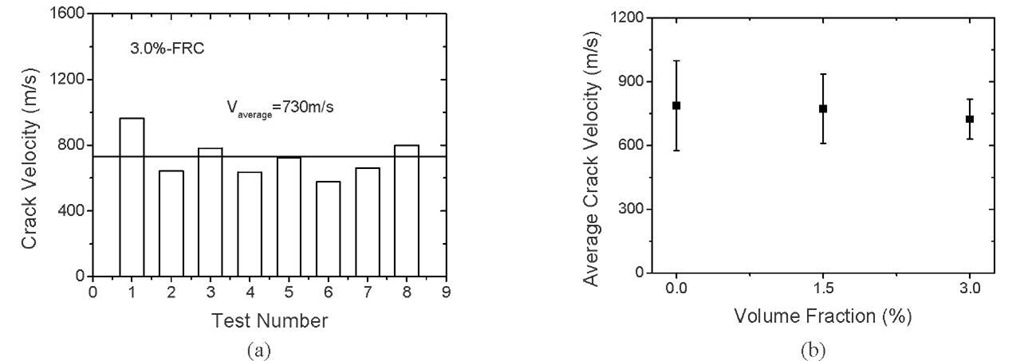
A crack gauge was mounted on the specimen during the test. The typical signal of the crack gauge and corresponding loading history are shown in Fig. 7. There is a significant post-peak ductility after the crack travels through the specimen, which indicates the pull-out of the fiber from the concrete matrix. The details of the crack gauge can be seen from the insert of Fig. 7. The distance between each wile in the crack gauge is 1.1 mm, and the time step can be measured by the jump of the crack gauge signal. From which, the crack velocity can be measured for each test, as shown in Fig. 8(a). The average crack velocities of three types of specimens are shown in Fig. 8(b). The average crack velocity of PC is 790 m/s where as the ones of 3% SFRC is 730 m/s. The phenomenon demonstrates that one of the important properties of SFRC is its superior resistance to cracking and crack propagation, which is also proved by both the tensile stress history and the recovered specimen.
Fig. 7. Typical loading history and corresponding crack gauge signal.
Fig. 8. The crack velocities of different conditions: (a) the crack velocity of each test, and (b) the effects of fibers’ volume fraction.
CONCLUSION
We present the dynamic tensile properties of PC, 1.5% SFRC and 3% SFRC with the loading rates from 100 to 500 GPa/s. The experiments were conducted on the modified SHPB system with the Brazilian disc specimens. The results show that there is a significant enhancement in tensile strength with increasing loading rates and the volume of steel fiber. Crack gauges mounted on the specimen show that the average fracture velocity of SFRC during the test is 730 m/s whereas that of PC is 790 m/s. The result demonstrates the fibers do substantially increase the post-cracking ductility, or energy absorption of the material.
![Schematics of the preloaded spit Hopkinson pressure bar (SHPB) system with the Brazilian disc specimen. In order to ensure single pulse loading, the momentum trap technique is adopted in our Hopkinson bar setup. Detailed explanation of the SHPB procedure and momentum trap can be found in the literature [9, 10]. Schematics of the preloaded spit Hopkinson pressure bar (SHPB) system with the Brazilian disc specimen. In order to ensure single pulse loading, the momentum trap technique is adopted in our Hopkinson bar setup. Detailed explanation of the SHPB procedure and momentum trap can be found in the literature [9, 10].](http://what-when-how.com/wp-content/uploads/2011/07/tmp1936_thumb_thumb.jpg)
