2.3
2.3.1
Narrow-band and wide-band encoding of audio signals
Audio engineers distinguish five categories of audio quality:
• The telephony band from 300 Hz to 3,400 Hz. An audio signal restricted to this band remains very clear and understandable, but does alter the natural sound of the speaker voice. This bandwidth is not sufficient to provide good music quality.
• The audio wide-band from 30 Hz to 7,000 Hz. Speech is reproduced with an excellent quality and fidelity, but this is still not good enough for music.
• The hi-fi band from 20 Hz to 15 kHz. Excellent quality for both voice and music. Hi-fi signals can be recorded on one or multiple tracks (stereo, 5.1, etc.) for spatialized sound reproduction.
• The CD quality band from 20 Hz to 20 kHz.
• Professional quality sound from 20 Hz to 48 kHz
Table 2.5 shows the bitrate that needs to be used for each level of audio quality, without compression.
2.3.2
Speech production: voiced, unvoiced, and plosive sounds
Speech sounds are characterized by the shape of the vocal tract which consists of the vocal cords, the lips, and the nose [B1]. The overall frequency spectrum of a speech sound is determined by the shape of the vocal tract and the lips (Figure 2.17). The vocal
Table 2.5 Uncompressed bitrate requirements according to audio quality
| Sampling | Quantization | Nominal | |
| frequency (kHz) | (bits) | bitrate (kbit/s) | |
| Telephony | 8 | 13 | 104 |
| Wide-band | 16 | 14 | 224 |
| Hi-fi | 32 | 16 | 512 mono (1,024 stereo) |
| CD | 44.1 | 16 | 705.6 mono (1,411 stereo) |
| Professional | 96 | 24 | 13,824 (5.1 channels) |

Figure 2.17 Human voice production.
tract introduces resonance at certain frequencies called formants. This resonance pattern carries a lot of information.
There are mainly three types of speech sounds: voiced, unvoiced,andplosive.
Periodically closing and opening the vocal cords produces voiced speech. The period of this closing and opening cycle determines the frequency at which the cords vibrate; this frequency is known as the pitch of voiced speech. The pitch frequency is in the range of 50-400 Hz and is generally lower for male speakers than for female or child speakers. The spectrum of a voiced speech sample presents periodic peaks at the resonance frequency and its odd harmonics (the formants). The voiced speech spectrum can be easily modeled by an all-pole filter with five poles or ten real coefficients computed on a frame length of
10- 30 ms.
During unvoiced speech, such as’s', ‘f’, ‘sh’, the air is forced through a constriction of the vocal cords; unvoiced speech samples have a noise-like characteristic and consequently their spectrum is flat and almost unpredictable.
Speech is produced by the varying state of the vocal cords, and by the movement of the tongue and the mouth. Not all speech sounds can be classified as voiced or unvoiced. For instance, ‘p’ in ‘puff’ is neither a voiced nor an unvoiced sound: it is of the plosive type.
Many speech sounds are complex and based on superimposing modes of production, which makes it very difficult to correctly model the speech production process and consequently to encode speech efficiently at a low bitrate.
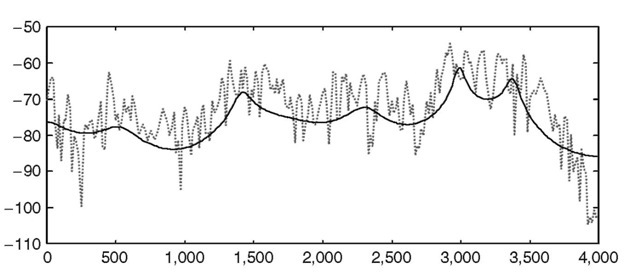
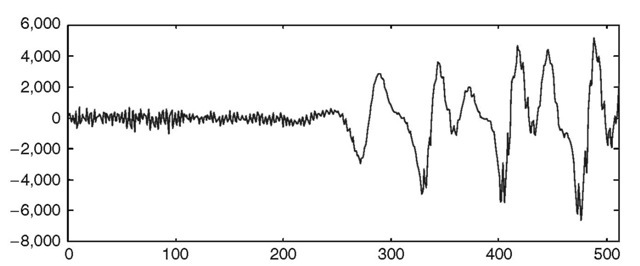
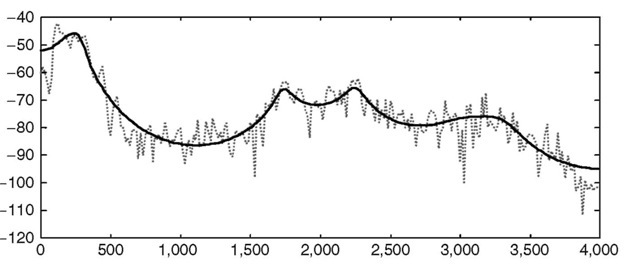
Figures 2.18-2.23 give some samples of voiced, unvoiced, and mixed speech segments, and their corresponding frequency spectrum associated with a 10th order LPC modeling filter frequency response.

Figure 2.18 Time representation of a voiced speech sequence (in samples).

Figure 2.19 Frequency spectrum of the voiced speech segment (dotted line) and the 10th order LPC modelling filter response.

Figure 2.20 Time representation of an unvoiced speech sequence (in samples).

Figure 2.21 Frequency spectrum of the unvoiced speech segment (dotted line) and the 10th order LPC modelling filter response.

Figure 2.22 Time representation of a mixed speech sequence (in samples).

Figure 2.23 Frequency spectrum of the mixed speech segment (dotted line) and the 10th order LPC modelling filter response.
2.3.3
A basic LPC vocoder: DOD LPC 10
By being able to distinguish voiced and unvoiced speech segments, it is possible to build a simple source filter model of speech (Figure 2.24) and a corresponding source speech coder, also called a vocoder (Figure 2.25). The detection of voiced segments is based on the autocorrelation of the processed frame after filtering through the LPC analysis filter. If the autocorrelation is rather flat and there is no obvious pitch that can be detected, then the frame is assumed to be unvoiced; otherwise, the frame is voiced and we have computed the pitch.
The DOD 2,400-bit/s LPC 10 [A8] speech coder (called LPC 10 because it has ten LP coefficients) was used as a standard 2,400-bit/s coder from 1978 to 1995 (it was subsequently replaced by the mixed excitation linear predictor, or MELP, coder). This vocoder has parameters as shown in (Table 2.6).

Figure 2.24 DOD LPC 10 voice synthesis for voiced and unvoiced segments (a source filter model of speech).

Figure 2.25 Basic principle of a source speech coder called a vocoder.
Table 2.6 DOD LPC 10 frame size, bit allocation and bitrate
| Sampling frequency | 8 kHz | ||
| Frame length | 180 samples = | 22.5 | ms |
| Linear predictive filter | 10 coefficients | = 42 | bits |
| Pitch and voicing information | 7 bits | ||
| Gain information | 5 bits | ||
| Total information | 54 bits per frame = | 2, 400 bit/s | |
The main disadvantage of source coders, based on this simple voiced/unvoiced speech production model, is that they generally give a very low speech quality (synthetic speech). Such coders cannot reproduce toll-quality speech and are not suitable for commercial telephony applications. The MELP coder made some progress by being able to model voice segments as a mix of voiced and unvoiced sounds, as opposed to a binary choice.
2.3.4
Auditory perception used for speech and audio bitrate reduction
The coders described previously attempt to approach the exact frequency spectrum of the source speech signal. This assumes that human hearing can perceive all frequencies produced by the speaker. This may seem logical, but human hearing cannot in fact perceive any speech frequency at any level. All acoustical events are not audible: there is a curve giving the perception threshold, depending on the sound pressure level and the frequency of the sound [A4, A9, A14]. Weak signals under this threshold cannot be perceived. The maximum of human hearing sensitivity is reached between 1,000 Hz and 5,000 Hz. In addition some sounds also affect the sensitivity of human hearing for a certain time. In order to reduce the amount of information used to encode speech, one idea is to study the sensitivity of human hearing in order to remove the information related to signals that cannot be perceived. This is called ‘perceptual coding’ and applies to music as well as voice signals.
The human ear is very complex, but it is possible to build a model based on critical band analysis. There are 24 to 26 critical bands that overlap bandpass filters with increasing bandwidth, ranging from 100 Hz for signals below 500 Hz to 5,000 Hz for signals at high frequency.
In addition a low-level signal can be inaudible when masked by a stronger signal. There is a predictable time zone, almost centered on the masker signal, that makes all the signals inside this area inaudible, even if they are above their normal perception threshold. This is called simultaneous frequency domain masking, which is used intensively in perceptual audio-coding schemes and includes pre- and post-masking effects.
Although these methods are not commonly used in low-bitrate (4-16 kbit/s) speech coders, they are included in all the modern audio coders (ISO MPEG-1 Layer I, II, III,3 MPEG-2 AAC, AC3, or Dolby Digital). These coders rely on temporal to frequency domain transformation (analysis filter bank) coupled to an auditory system-modeling

Figure 2.26 Usage of filter banks for audio signal analysis and synthesis.
procedure that calculates masking thresholds and drives a dynamic bit allocation function. Bits are allocated to each band in order to fit the overall bitrate and masking threshold (see Figure 2.26) requirements.
Today, audio signals can be efficiently encoded (almost CD-like quality [A9, A10, A11, A12]) in about 64 kbit/s for a single monophonic channel with the most advanced audio-coding (AAC) schemes. Wideband (20-7,000 Hz) speech and audio coders can use the same scheme to encode in only 24 kbit/s or 32 kbit/s (although there are some issues related to the analysis filter bank—overlap and add procedure in the decoder—that result in annoying pre-echo phenomena. This is mainly due to the nonstationary characteristic of the speech signal and is very perceptible when onset appears).
Some low-bitrate speech coders do not use the perceptual model for speech coding itself, but rather to better evaluate the residual error signal. Analysis by synthesis (ABS) speech coders (addressed later) ponders the error signal used in the closed-loop search procedure by a perceptual weighting filter derived from the global spectrum of speech. The function of this perceptual weighting filter is to redistribute the quantizing noise into regions where it will be masked by the signal. This filter significantly improves subjective coding quality by properly shaping the spectrum of the error: error noise is constrained to remain below the audible threshold when the correlated signal is present. In ABS decoders, a post-filter may also be used to reduce noise between the maxima of the spectrum (formants) by reducing the signal strength in these regions and boosting the power of formants. This significantly improves the perceived quality on the MOS scale, but there is a price to pay: post-filters do alter the naturalness (fidelity) of the decoded speech. An example of such a filter is given in the introduction to Section 2.7.
