Worked Examples
Example 5.1: A uniform cantilever beam subjected to a downward force
Consider the cantilever beam as shown in Figure 5.2. The beam is fixed at one end, and it has a uniform cross-sectional area as shown. The beam undergoes static deflection by a downward load of P = 1000 N applied at the free end. The dimensions of the beam are shown in the figure, and the beam is made of aluminium whose properties are shown in Table 5.1.
To make clear the steps involved in solving this simple example, we first used just one beam element to solve for the deflection. The beam element would have degrees of freedom as shown in Figure 5.1.
Step 1: Obtaining the element matrices The first step in formulating the finite element equations is to form the element matrices and, in this case, being the only element used, the element matrices are actually the global finite element matrices, since no assembly is required. The shape functions for the four degrees of freedom are given in Eq. (5.14). The element stiffness matrix can be obtained using Eq. (5.21). Note that as this is a static problem, the mass matrix is not required here. The second moment of area of the cross-sectional area
Figure 5.2. Cantilever beam under static load. Table 5.1. Material properties of aluminium
|
Young’s modulus, E GPa |
Poisson’s ratio, v |
|
69.0 |
0.33 |
about the z-axis can be given as
Since only one element is used, the stiffness matrix of the beam is thus the same as the element stiffness matrix:
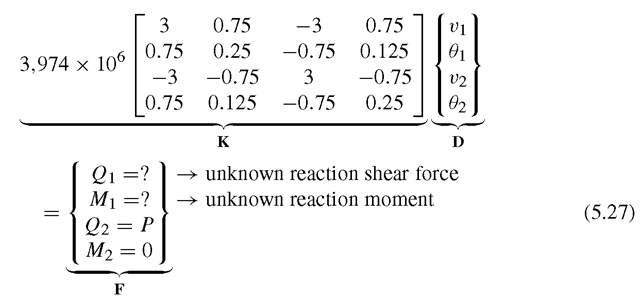
The finite element equation becomes
Note that, at node 1, the beam is clamped. Therefore, the shear force and moment at this node should be the reaction force and moment, which are unknowns before the FEM equation is solved for the displacements. To solve Eq. (5.27), we need to impose the displacement boundary condition at the clamped node.
Step 2: Applying boundary conditions The beam is fixed or clamped at one end. This implies that at that end, the deflection, vx, and the slope, θχ, are both equal to zero:
The imposition of the above displacement boundary condition leads to the removal of the first and second rows and columns of the stiffness matrix:
The reduced stiffness matrix becomes a 2 x 2 matrix of
The finite element equation, after the imposition of the displacement condition, is thus
where
and the force vector F is given as
Note that, although we do not know the reaction shear force Q1 and the moment M1, it does not affect our solving of the FEM equation, because we know V1 and θ1 instead. This allows us to remove the unknowns of Q1 and M1 from the original FEM equation. We will come back to calculate the unknowns of Q1 and M1, after we have solved the FEM equations for all the displacements (deflections and rotations).
Step 3: Solving the FE matrix equation The last step in this simple example would be to solve Eq. (5.31) to obtain v2 and θ2. In this case, Eq. (5.31) is actually two simultaneous equations involving two unknowns, and can be easily solved manually. Of course, when we have more unknowns or degrees of freedom, some numerical methods of solving the matrix equation might be required. The solution to Eq. (5.31) is
After v2 and θ2 have been obtained, they are substituted back into the first two equations of Eq. (5.27) to obtain the reaction shear force at node 1:
and the reaction moment at node 1:
This completes the solution process of this problem.
Note that this solution is exactly the same as the analytical solution. We again observe the reproduction feature of the FEM that was revealed in Example 4.1. In this case, it is because the exact solution of the deflection for the cantilever thin beam is a third order polynomial, which can be obtained easily by solving the strong form of the system equation of beam given by Eq. (5.59) with fy = 0. On the other hand, the shape functions used in our FEM analysis are also third order polynomials (see Eq. (5.14) or Eq. (5.2)). Therefore, the exact solution of the problem is included in the set of assumed deflections. The FEM based on Hamilton’s principle has indeed reproduced the exact solution. This is, of course, also true if we were to calculate the deflection at anywhere else other than the nodes. For example, to compute the deflection at the centre of the beam, we can use Eq. (5.12) with x = 0.25, or in the natural coordinate system, ξ = 0, and substituting the values calculated at the nodes:
To calculate the rotation at the centre of the beam, the derivatives of the shape functions are used as follows:
Note that in obtaining dN/dx above, the chain rule of differentiation is used together with the relationship between x and ξ as depicted in Eq. (5.1).
Case Study: Resonant Frequencies of Micro Resonant Transducer
Making machines as small as insects, or even smaller, has been a dream of scientists for many years. Made possible by present lithographic techniques, such micro-systems are now being produced and applied in our daily lives. Such machines are called micro-electro-mechanical systems (MEMS), usually composed of mechanical and electrical devices. There are many MEMS devices, from micro actuators and sensors to micro fluidic devices, being designed and manufactured today. The technology has very wide applications in communication, medical, aerospace, robotics, and so on.
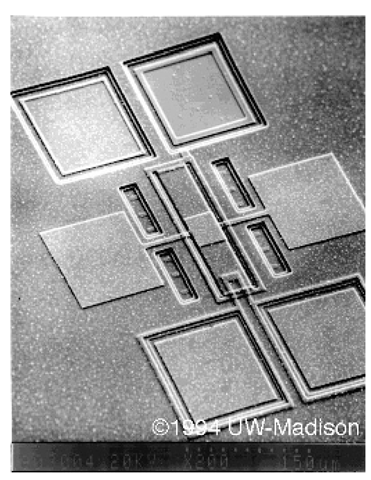
One of the most common micro-electro-mechanical (MEMS) devices is the resonant transducer. Resonant transducers convert externally induced beam strain into a beam resonant frequency change. This change in resonant frequency is then typically detected by implanted piezoresistors or optical techniques. Such resonant transducers are used for the measurement of pressure, acceleration, strain, vibration, and so on. Figure 5.3 shows a micrograph of a micro polysilicon resonant microbeam transducer.
Figure 5.3. Resonant micro-beam strain transducer
Figure 5.4. Bridge in a micro resonant transducer.
Figure 5.3 shows an overall view of the transducer, but the principle of the resonant transducer actually lies in the clamped-clamped bridge on top of a membrane. This bridge is actually located at the centre of the micrograph. Figure 5.4 shows a schematic side view of the bridge structure. The resonant frequency of the bridge is related to the force applied to it (between anchor points), its material properties, cross-sectional area and length. When the membrane deforms, for example, due to a change in pressure, the force applied to the bridge also changes, resulting in a change in the resonant frequency of the bridge.
It is thus important to analyse the resonant frequency of this bridge structure in the design of the resonant transducer. We use the beam element in the software ABAQUS to solve for the first three resonant frequencies of the bridge. The dimensions of the clamped-clamped bridge structure shown in Figure 5.5 are used to model a bridge in a micro resonant transducer. The material properties of polysilicon, of which the resonant transducer is normally made, are shown in Table 5.2.
Figure 5.5. Geometrical dimensions of clamped-clamped bridge.
Table 5.2. Elastic properties of polysilicon
|
Young’s Modulus, E |
169 GPa |
|
Poisson’s ratio, ν |
0.262 |
|
Density, ρ |
2300 kg m-3 |
Figure 5.6. Ten element mesh of clamped-clamped bridge.
Modelling
The modelling of the bridge is done using one-dimensional beam elements developed in this topic. The beam is assumed to be clamped at two ends of the beam. The meshing of the structure should not pose any difficulty, but what is important here is the choice of how many elements to use to give sufficient accuracy. Because the exact solution of free vibration modes of the beam is no longer of a polynomial type, the FEM will not be able to produce the exact solution, but an approximated solution. One naturally becomes concerned with whether the results converge and whether they are accurate.
To start, the first analysis will mesh the beam uniformly into ten two-nodal beam elements, as shown in Figure 5.6. This simple mesh will serve to show clearly the steps used in ABAQUS. Refined uniform meshes of 20,40 and 60 elements will then be used to check the accuracy of the results obtained. This is a simplified way of performing what is commonly known as a convergence test. Remember that usually the greater the number of elements, the greater the accuracy. However, we can’t simply use as many elements as possible all the time, since, there is usually a limit to the computer resources available. Hence, convergence tests are carried out to determine the optimum number of elements or nodes to be used for a certain problem. What is meant by ‘optimum’ means the least number of elements or nodes to yield a desired accuracy within the acceptable tolerance.
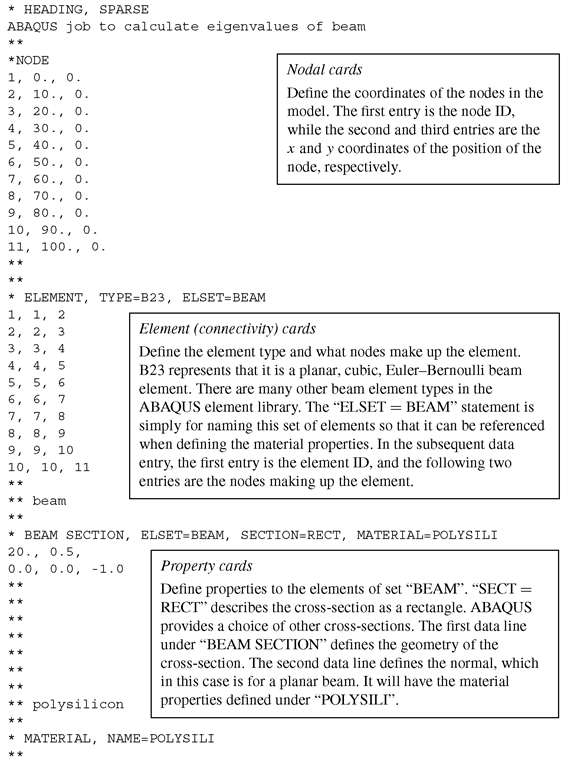
ABAQUS Input File
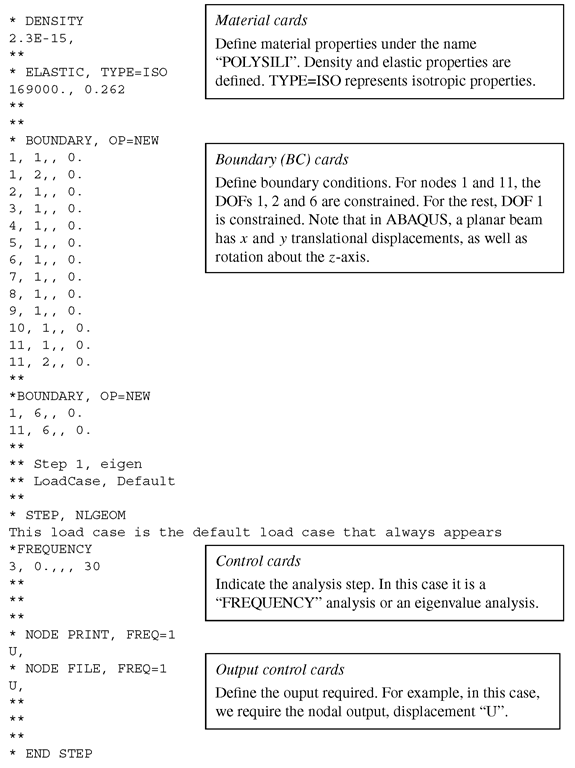
The ABAQUS input file for the above described finite element model is shown below. In the early days, the analyst had to write these cards manually, but now it is generated by the preprocessors of FEM packages. Understanding the input file is very important both for undersanding the FEM and to effectively use the FEM packages. The text boxes to the right of the input file are not part of the input file, but explain what the sections of the file meant.
The input file above shows how a basic ABAQUS input file is set up. Note that all the input file does is provide the information necessary so that the program can utilize them to formulate and solve the finite element equations. It may also be noticed that in the input file, there is no mention of the units of measurement used. This implies that the units must definitely be consistent throughout the input file in all the information provided. For example, if the coordinate values of the nodes are in micrometres, the units for other values like the Young’s modulus, density, forces and so on must also undergo the necessary conversions in order to be consistent, before they are keyed into the preprocessor of ABAQUS. It is noted that in this case study, all the units are converted into micrometres to be consistent with the geometrical dimensions, as can be seen from the values of Young’s modulus and density. This is the case for most finite element software, and many times, errors in analysis occur due to negligence in ensuring the units’ consistency.


