Now that we’ve defined electromagnetic waves and have an indication of how photons might be detected, let’s look at how EM waves are created. There are several major sources of electromagnetic radiation, all ultimately associated in some form with the acceleration (change of energy) of charged particles (mostly electrons). For remote sensing, these can be divided into three categories:
• Individual atoms or molecules that radiate line spectra;
• Hot, dense bodies that radiate a continuous "blackbody" spectrum; and
• Electric currents moving in wires (aka, antennas).
Line spectra
Single atoms or molecules emit light in a form called line spectra. An atom or molecule that is reasonably isolated (such as in a gas at ordinary temperatures and pressures) will radiate a discrete set of frequencies called a line spectrum. Conversely, if we pass radiation exhibiting a continuous spectrum of frequencies through a gas, we find that a discrete set of frequencies is absorbed by the gas, leading to a spectrum of discrete absorption lines.
The wavelengths radiated (and absorbed) are characteristic of the atom or molecule in question, and thus present a powerful tool for determining the composition of radiating (or absorbing) gases. Line spectra analysis accounts for much of our knowledge of the chemical composition of stars (including the sun).
The processes of absorption and emission of photons is reasonably well explained by the Bohr model of the atom, developed at the beginning of the 20th century, which uses the familiar atom-as-solar-system construct. This model has a nucleus at the center of the atom composed of heavy protons (+) and neutrons. The lighter electrons (-) orbit the nucleus at well-defined radii, which correspond to different energy levels. The closer they orbit the nucleus, the lower (more negative) their energy levels. As energy is given to the electrons, the radii of their orbits increase until they finally break free. Bohr hypothesized that the radii of the orbits were constrained by quantum mechanics to have certain values (really, a constraint on angular momentum). This produces a set of discrete energy levels that are allowed for the electrons. Bohr also claimed that the emission and absorption of energy (light) by an atom could only occur for transitions between the discrete energy levels allowed to electrons. Figure 2.9 illustrates the concept that photons are emitted (or absorbed) in changes of these discrete energy levels.
A few pages of mathematics in the topic give the formula for the energy of the electrons orbiting in hydrogen-like atoms:
where n = the quantum number: 1,2,3,____, Z = the atomic number, m = the electron mass, and e = the electron charge. The remaining terms are constants, and for Z = 1, we find that for hydrogen,
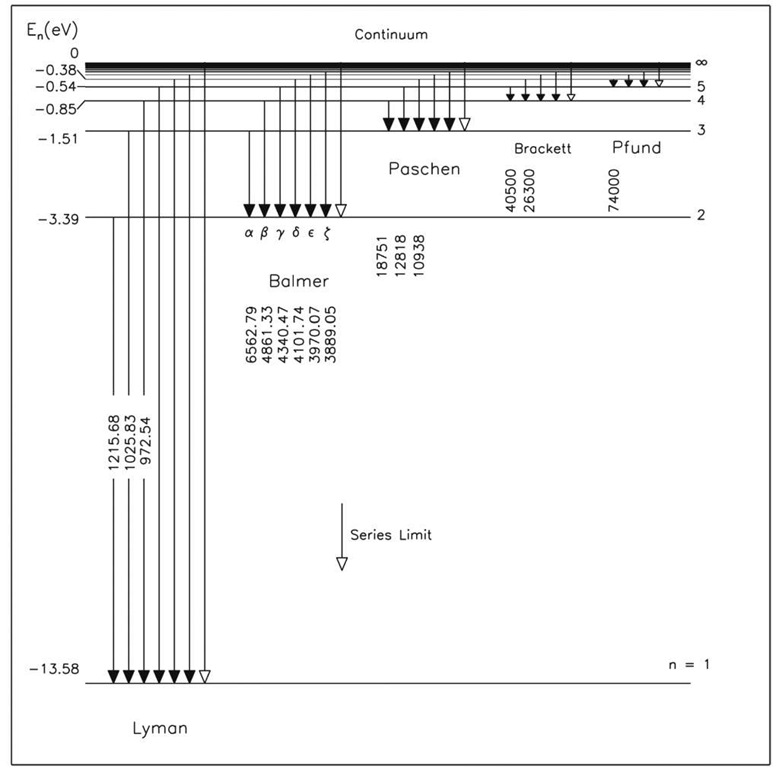
Figures 2.10 and 2.11 illustrate energy levels in Bohr’s model of the hydrogen atom. We find that the ion-ization energy, the energy necessary to remove the electron from its "well," is 13.58 eV. If the electron gains somewhat less energy, it may move up to an excited state, where n > 1. For example, if an electron beginning in the ground state gains 10.2 eV, it will move up to the n = 2 level. If the electron gains an energy of 13.58 eV or more, the atom will be completely ionized.
Figure 2.9 Bohr Postulate: Photons are produced/destroyed by discrete transition in energy.
Dropping down from n = 2 to n = 1, it will emit a photon of 10.19 eV energy, at a wavelength
If![]() is expressed in electron-volts (eV), which it usually is, then the constant"hc" in the numerator can be written as
is expressed in electron-volts (eV), which it usually is, then the constant"hc" in the numerator can be written as
 and thus the wavelength
![]() is given by
is given by
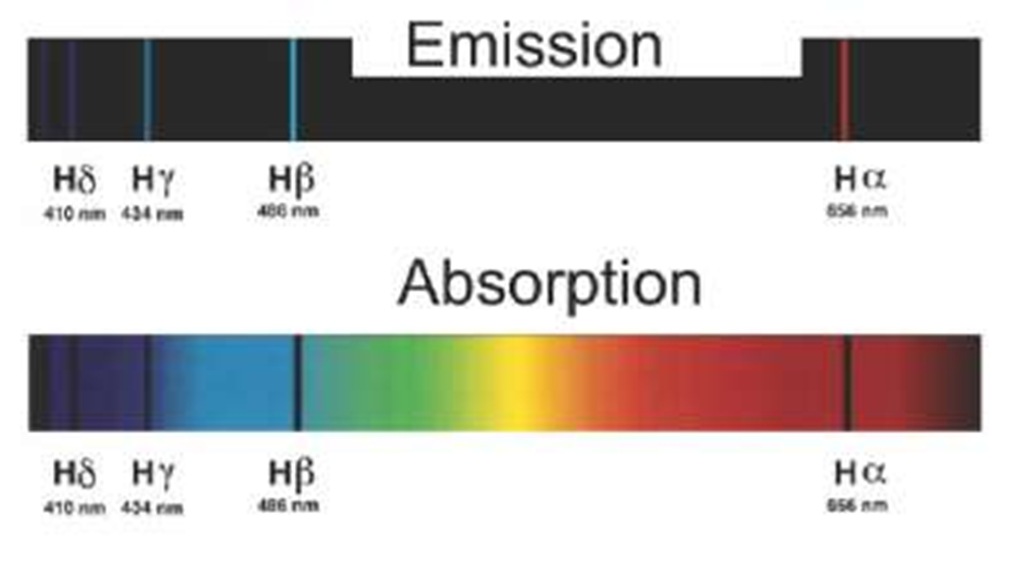
In general, transitions will occur between different energy levels, resulting in a wide spectrum of discrete spectral lines. Transitions from (or to) the n =1 energy level (the ground state) are called the Lyman series. The n = 2 to n =1 transitions compose the Lyman alpha (a) transition. This ultraviolet (UV) emission is one of the primary spectral (emission) lines of the sun’s upper atmosphere. The emission (or absorption) lines in the visible portion of the sun’s spectrum are the Balmer series, transitions from n > 2 to n = 2. Higher-order series are of less importance for our purposes.
Figure 2.10 An energy-level diagram of the hydrogen atom, showing the possible transitions corresponding to the different series. The numbers along the transitions are wavelengths in units of angstroms, where 1 nm = 10 A.
Figure 2.11 The Balmer series: Hydrogen spectra in the visible region, in emission and absorption.
Though the Bohr model was ultimately replaced by the solution of the Schrodinger equation and a more general form of quantum mechanics, it successfully predicts the observed energy levels for one-electron atoms and illustrates the quantum nature of the atom and associated energy levels. It is also a good beginning for understanding the interesting spectral characteristics that reflected and radiated light may exhibit in remote sensing applications.
Blackbody radiation
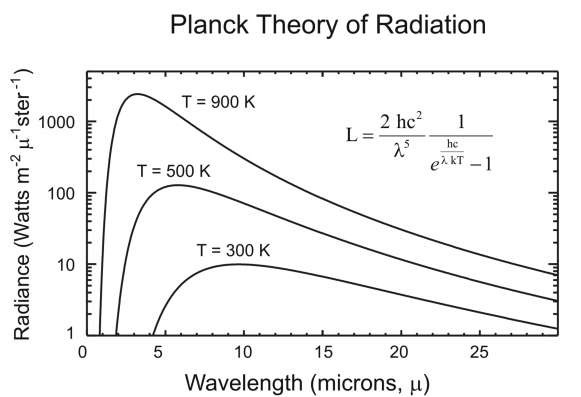
Blackbody radiation is emitted by hot solids, liquids, or dense gases and has a continuous distribution of radiated wavelength as shown in Fig. 2.12. The curves in this figure give the radiance L in dimensions of Power / unit area • wavelength • solid angle, or units of Watts / m2 | ster. The radiance equation is
It is a little easier to decipher the nature of the formula if it is rewritten slightly:
where the dimensionless term:![]()
![]() is defined. We see that the shape of this function of wavelength
is defined. We see that the shape of this function of wavelength![]() is unchanging as temperature changes; only the overall amplitude changes (and of course, the location of the peak in wavelength).
is unchanging as temperature changes; only the overall amplitude changes (and of course, the location of the peak in wavelength).
Real materials will differ from the idealized blackbody in their emission of radiation. The emissivity![]() of a surface is a measure of the efficiency with which the surface absorbs (or radiates) energy and lies between 0 (for a perfect reflector) and 1 (for a perfect absorber).
of a surface is a measure of the efficiency with which the surface absorbs (or radiates) energy and lies between 0 (for a perfect reflector) and 1 (for a perfect absorber).
Figure 2.12 Blackbody radiation as a function of wavelength.
A body that has![]() is called a "blackbody." In the infrared, many objects are nearly blackbodies—in particular, vegetation. Materials with
is called a "blackbody." In the infrared, many objects are nearly blackbodies—in particular, vegetation. Materials with![]() are called gray bodies. Emissivity
are called gray bodies. Emissivity![]() will vary with wavelength.
will vary with wavelength.
Note that some topics employ another form of Planck’s Law, featuring an extra![]()
The difference is that the dependence on angle of the emitted radiation has been removed by integrating over the solid angle. You can do this for blackbodies because they are "Lambertian" surfaces by definition—the emitted radiation does not depend upon angle, and![]()
For our purposes, two aspects of the Planck curves are of particular interest: the total power radiated, which is represented by the area under the curve, and the wavelength at which the curve peaks![]()
The power radiated (integrated over all wavelengths) is given by the Stefan-Boltzmann law:
Wien’s Displacement Law gives the wavelength at which the peak in radiation occurs:
for a given temperature T. The constant a has the value
which gives![]() in meters if T is in Kelvin.
in meters if T is in Kelvin.
Example:
Assume that the sun radiates like a blackbody (which is not a bad assumption, although we must choose two slightly different temperatures to match the observed quantities).
(a) Find the wavelength![]() at which this radiation peaks. The solar spectral shape in the visible is best matched by a temperature of
at which this radiation peaks. The solar spectral shape in the visible is best matched by a temperature of![]()
(b) Find the total power radiated by the sun. The Stefan-Boltzmann law is best served by an "effective temperature" of
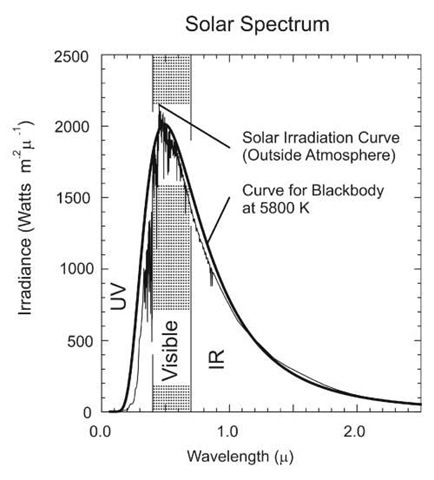
The spectrum peaks at![]() as illustrated in Fig. 2.13.
as illustrated in Fig. 2.13.
(b) Next we can calculate R, the power emitted per![]() of surface. We use:
of surface. We use:
and we assume that![]() (blackbody). Evaluating, we get:
(blackbody). Evaluating, we get:
To find the total solar power output we must multiply by the solar surface area,
![]() is the mean radius of the sun. Hence the total solar power output is:
is the mean radius of the sun. Hence the total solar power output is:
The sun’s spectrum is shown in Fig. 2.13 with the spectrum of a 5800 K blackbody superimposed.
Figure 2.13 The solar spectrum, based on the spectrum of Neckel and Labs, "The solar radiation between 3300 and 12500 Angstrom," Solar Physics, 90, 205-258, 1984. Data file courtesy of Bo-Cai Gao, NRL. The peak occurs at about 460 nm (blue).
Figure 2.14 Solar spectrum as observed on Mount Haleakala.
A somewhat different perspective on the visible band of the solar spectrum is obtained from an illustration created at the University of Hawaii. The dark lines superimposed on the rainbow scale, known as Frauenhofer lines, are solar-absorption features, due to the cool hydrogen, helium, and other elements just above the surface of the sun. These correspond to the dips in the solar irradiation curve illustrated above.


