In the previous topic we looked at the illumination of objects by sunlight and the reflectance or scattering of light from those objects. As we follow the photons along their paths, we move in sequence from the atmosphere (in this section) through optical systems (in the next section) and then on to the detectors.
There are three limiting factors that the atmosphere introduces into remote sensing. These are absorption (typically by atomic and molecular processes), scattering (primarily due to aerosols like dust, fog, and smoke), and turbulence (due to fluctuations in the temperature and density of the atmosphere).
Atmospheric absorption: wavelength dependence
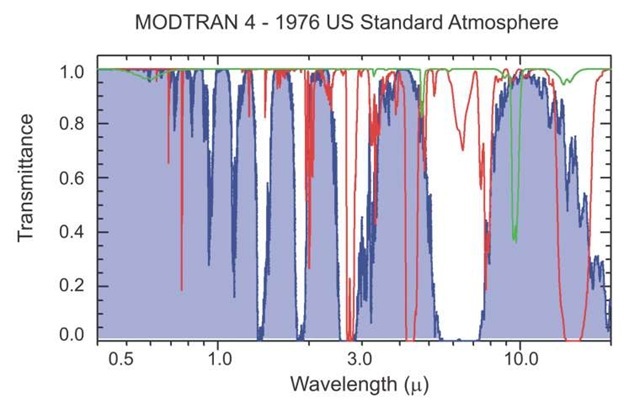
The atmospheric factor that most limits Earth observation is absorption—particularly absorption by water, carbon dioxide, and ozone, in roughly that order. Figure 3.12 shows atmospheric absorption calculated for a standard atmosphere at ground level (note that the horizontal axis is logarithmic). The calculations were done with MODTRAN, the standard USAF code for modeling atmospheric absorption and scattering. Regions shaded dark blue are atmospheric windows, that is, spectral regions that are largely transparent to EM radiation. By contrast, regions such as the spectral range from![]() are dominated by water absorption. The atmosphere is opaque in this spectral range. Ozone shows its presence in a small spectral absorption band centered at 10 ^m.
are dominated by water absorption. The atmosphere is opaque in this spectral range. Ozone shows its presence in a small spectral absorption band centered at 10 ^m.
Figure 3.12 Atmospheric absorption. Transmission curves calculated using MODTRAN 4.0, release 2. The U.S. standard atmosphere, 1976, is defined in the NOAA publication with that title, NOAA0S/T-1562, October 1976, Washington DC, stock # 003-017-00323-0.
Atmospheric scattering
Electromagnetic radiation (photons) is scattered by various particles in the Earth’s atmosphere. This scattering is caused by collisions between the photons and scattering agents that range from molecules (and atoms), suspended particulates (aerosols), and clouds (water droplets). Scattering is somewhat arbitrarily divided into three domains as a function of the relationship between the wavelength and the size of the scattering agents (atoms, molecules, and aerosols).
Rayleigh, or molecular, scattering in the optical spectrum is primarily caused by oxygen and nitrogen molecules, whose effective diameters are much less than optical wavelengths of interest. Typical molecular diameters are 1-10 A. The process of Rayleigh scattering is highly dependent on wavelength. The probability of scattering interactions is inversely proportional to the fourth power of wavelength ![]() This is illustrated in Fig. 3.13. The bottom-most (dashed) curve in the figure is the Rayleigh scattering term.
This is illustrated in Fig. 3.13. The bottom-most (dashed) curve in the figure is the Rayleigh scattering term.
The preferential scattering of blue wavelengths explains why the clear sky (i.e., with low humidity and few aerosols) appears blue in daylight. The blue wavelengths reach our eyes from all parts of the sky. This is why photographers who want to take clear panoramic photographs with black-and-white film use a yellow or red filter: it allows the less-scattered light to be captured on film for a sharper overall image. It is a strong motivating factor in choosing the wavelength response for satellite imagers, which typically exclude blue wavelengths.
Figure 3.13 Atmospheric scattering diagram.
As the relative size of the scattering agent increases, the scattering processes evolve toward Mie scattering. The dependence of the scattering probability on wavelength decreases, and the scattering directionality evolves as well. For Ray-leigh scattering, the probability of scattering is roughly equal in all directions; as the particle size increases, the probability of forward scattering increases. Mie scattering produces the almost white glare around the sun when a lot of particulate material is present in the air. It also gives the white light from mist and fog. Important Mie scattering agents include water vapor and tiny particles of smoke, dust, and volcanic ejecta—all particles comparable in size to the visible and infrared wavelengths used in remote sensing. Mie scattering is important in the determination of the performance of IR systems, particularly in littoral (coastal) environments. Depending upon the size distribution, shape, and concentration of scattering particles, the wavelength dependence varies between![]()
Scattering agents that are still larger (more than 10x the photon wavelength) cause particles to scatter independently of wavelength (non-selective in Fig. 3.13). This happens with the water droplets and ice crystals of which clouds and fog are composed, showing itself in the gray hues of fog. Such scattering causes the sunlit surfaces of clouds to appear a brilliant white. Large smog particles, if not possessing special absorption properties, turn the color of the sky from blue to grayish white.
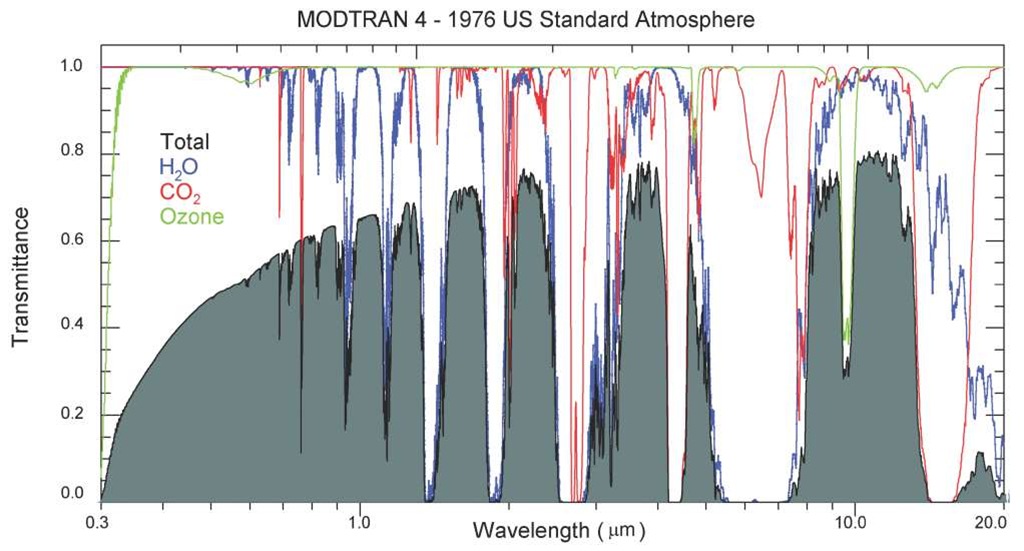
The combined effects of scattering and absorption are illustrated in Fig. 3.14. The figure is designed to indicate the impact of atmospheric absorption on light transmitted from ground to space, as would be observed by a high-altitude satellite.
Figure 3.14 Atmospheric absorption and scattering. Transmission curve calculated using MODTRAN 4.0, release 2. Conditions are typical of mid-latitudes, with the 1976 U.S. standard atmosphere assumed. The overall broad shape is due to scattering by molecular species and aerosols.
Note that the spectral range is extended beyond that in the illustration above. The absorption due to ozone becomes very significant below 0.35 ^m, and the atmosphere is opaque to sunlight below 0.3 ^m, due to the ozone layer at altitudes of 20-40 km. Note that, overall, the atmosphere is more transparent in the long-wave infrared![]() than in the visible spectrum
than in the visible spectrum![]()
Atmospheric turbulence
The third limiting factor in remote sensing through the atmosphere—atmospheric turbulence—is the answer to the question, why do the stars twinkle? Figures 3.15 and 3.16 illustrate.
Light propagating through the atmosphere will encounter small perturbations of density and temperature, due to atmospheric turbulence. Small irregularities in density produce variations in the index of refraction, which in turn cause small fluctuations in the direction in which the light propagates (Snell’s law), on the order of one part in a million. These irregularities in the atmospheric boundary layer (the bottom of the atmosphere) have characteristic scale sizes of tens of meters, and fluctuate on timescales of milliseconds to seconds. The impact of atmospheric turbulence is much greater for telescopes looking up through the atmosphere than for sensors looking down at Earth.
Figure 3.15 The apparent position of a star will fluctuate as the rays pass through time-varying light paths.
Figure 3.16 shows how atmospheric turbulence affects stellar observations. Adaptive optics technology (not developed here), uses optical technology to compensate for the flickering direction of the incoming light. Figure 3.16 shows the "first light" image for the adaptive-optics system on the 3.5-m telescope at the Starfire Optical Range, taken in September 1997. The image on the left is the uncompensated image; the compensated image is on the right.
In summary, three environmental factors constrain the resolution possible with an imaging system: absorption, scattering, and turbulence.
Figure 3.16 This astronomical I band (850 nm) compensated image of the binary star Kappa-Pegasus (k-peg) was generated using the 756-active-actuator adaptive-optics system. The two stars are separated by 1.4544 ^rad. The images are 128 x 128 pixels; each pixel subtends 120 nanoradians. The FWHM of the uncompensated spot is about 7.5 ^rad —about 5 times the separation of the two stars.13 Note on nomenclature: Astronomy IR bands are H (1.65 |im), I (0.834 |im), J (1.25 |im), and K (2.2 |im).


