1. Introduction
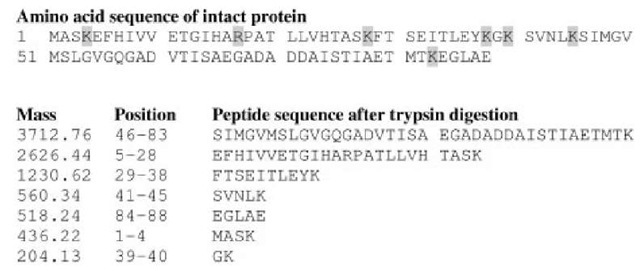
Mass spectrometry-based protein identification is one of the core techniques in proteomics. It is based on the comparison of peaks in mass spectra with calculated theoretical masses for proteins as derived from their primary structure. By cutting the protein to identify with a specific endoprotease or chemical reaction, a mixture of peptides is generated. The peptide masses are measured in a mass spectrometer. The cutting procedure is then simulated on all proteins in a protein sequence database and the theoretical mass fingerprints generated are compared to the one acquired on the mass spectrometer (Figure 1). For reviews on protein fingerprinting, also known as peptide mass fingerprinting, see (Henzel et al., 2003) and Article 12, Protein fingerprinting, Volume 5. Peptide fingerprinting, or peptide fragment fingerprinting, is based on similar principles, but instead of measuring the peptide masses only, the individual peptides are fragmented in the mass spectrometer yielding peptide fragment fingerprints. Peptide fingerprinting is reviewed elsewhere in this topic (see Article 3, Tandem mass spectrometry database searching, Volume 5), and there is a separate tutorial on the subject (see Article 17, Tutorial on tandem mass spectrometry database searching, Volume 5). Nevertheless, there are several points mentioned below that are valid also for peptide fingerprinting.
For satisfactory protein identification it is important to consider the different steps of the workflow since there are several factors that are important to achieve a successful identification. This tutorial will give an overview of the process and some hints on how to succeed with protein fingerprinting.
2. Experimental setup
A working experimental setup is the first key to success and sample preparation is described thoroughly in Article 14, Sample preparation for MALDI and electrospray, Volume 5. The most basic prerequisite is that there has to be sufficient protein for the analysis. Trypsin digestion of the sample will work well only if the protein concentration is sufficient. Nowadays this is more critical than the sensitivity of the mass analyzers as the mass spectrometers are usually sensitive enough. An efficient digestion is important for extraction of the protein fragments from gel slices. If the protein is still in the gel, there will not be any sample signal, no matter how sensitive the mass spectrometer is. It is even more important for the actual fingerprinting to have as complete cleavage as possible. Some missed cleavages are inevitable, but if two or more have to be considered for each peptide, there will be too many possible masses for efficient identification of most proteins. Efficient sample ionization and sensitive and well-calibrated mass analysis are as important for the analysis. For protein fingerprinting, currently the standard mass spectrometer is of the matrix-assisted laser desorption ionization-time-of-flight (MALDI-ToF) type, see Article 7, Time-of-flight mass spectrometry, Volume 5.
Figure 1 Theoretical tryptic digest of a protein. The arginines and lysines are marked in gray in the amino acid sequence
3. Peak extraction and deisotoping
When the mass spectra have been acquired, the first task is to convert the spectra into peak lists. Mass spectra are a mixture of sample signal and noise and it is not straightforward to do the peak picking. Every peptide will yield a cluster of peaks due to the isotopic distribution, and only the monoisotopic peak should be used for the fingerprinting, see Figure 2. As illustrated in Figure 2 it is often quite easy to select the strongest peaks, but on the lower end of the scale, it is almost impossible to differentiate signal from noise. Peak extraction is normally performed using computer software, which is most often bundled with the mass spectrometer. The peak picking software work quite differently and they also have parameter settings, which will influence the results. If the algorithms are set to be very sensitive they usually extract more background as well as more sample peaks. This can be good in some and bad in other cases, therefore it is worthwhile to search with several peak lists extracted from the same mass spectrum (Rognvaldsson et al., 2004).
4. Peak lists filtering
Mass spectra also contain matrix or solvent peaks depending on the ionization source, and in addition peptide peaks derived from contaminants such as trypsin autolysis peaks and keratins are common in the samples. It is a good idea to remove as many of the contaminant peaks as possible, provided they can be identified. Still, removal of sample peaks is undesirable and it is sometimes worthwhile to search both using the raw peak list and a filtered peak list. Basic filters for trypsin are often included in the database matching programs, but for more extensive filtering one will have to find out what contaminants are often present in the lab by overlaying peak lists. This can be performed manually or automatically (Levander et al., 2004).
Figure 2 Raw MALDI-ToF spectrum and selected monoisotopic peaks with signal-to-noise threshold set at 2.0. The x axis is m/z and y is the signal intensity
At the same time as performing the filtering of peak lists, the identified contaminants can also be used to recalibrate the spectra, if this is not automatically included in the database search, as it is in the Aldente search engine, for example, (www.expasy.org/tools/aldente/).
5. Database searching
There are numerous different computer programs that perform matching of the peak list with theoretical peak lists derived from the protein database (see Article 12, Protein fingerprinting, Volume 5). The matching itself is trivial, and the difference between the different algorithms is rather on the scoring level. If all peaks in a spectrum would match all theoretical peaks of a protein, there would not be much ambiguity in the identification process. However, the normal result is that only a fraction of the peaks match, and that many of the theoretical peaks cannot be found in the spectrum or are outside the mass range for which spectra are acquired. There will be some peak matches to many proteins, and the scoring algorithm will try to tell, which is the best protein candidate for the peak list. The algorithms should also account for the possibility that there are several proteins in the sample. It is desirable to have some kind of measure of how likely the protein hit is to be random or correct, and probability-based algorithms should preferentially be used. Mascot from Matrix Science (www.matrixscience.com) is probably the most used search engine today, but several other search programs also provide probabilistic scoring.
Irrespective of the choice of database search program, there are several important parameters to set:
The choice of database is most critical. If the protein or a closely related one is not in the database the search will not be successful. If the analyzed protein is from an organism with a sequenced and annotated genome, one can opt to search only that proteome. A problem that can arise is that the protein has not been correctly annotated even if the genome sequence is published. Sometimes searching also in sequences from related organisms can be helpful. It is also possible to find conserved proteins even for organisms that have not been sequenced if the sequence similarity to a known protein is high enough. It is also a good idea to search a large protein database with proteins from several organisms, since it is quite unlikely that a protein from the organism analyzed ends up as a top candidate by chance.
Mass tolerance is an important factor. The mass accuracy of the mass spectrum determines how small the search window can be, that is, which mass error can be tolerated for a peak match. If the mass tolerance window is small, fewer proteins will have to be scored, since there will be fewer random matches than with a large mass error. On the other hand, if the mass window is set too small, one will risk missing hits when the calibration is worse than expected. It is so often that the mass calibration varies quite a lot over a MALDI target plate, and it is necessary to perform several searches with different mass tolerances to find the right protein. Some scoring algorithms utilize the fact that the mass error tends to be linear and makes a correlation of the error which is included in the score (Egelhofer et al., 2002, Gasteiger et al., 2005).
Amino acid modifications to consider have to be marked .Chemical modification of amino acids will change the mass for a peptide, and if it is not considered, the peptide mass will not be matched. Fixed amino acid modifications are those that can be expected to be true for all (or most) amino acids of one kind, for example, reduction and alkylation of cysteins in 2D gels will impose carbamidomethylation. Variable modifications are those that appear on some amino acids, but not all. Methionine oxidation is a modification that is very frequent and variable methionine oxidation is of a standard setting. There are many natural modifications of proteins, and it could be teasing to set some of these as variable in the search. However, for each variable modification the number of possible masses quickly rises for a peptide, and this makes the search less specific. If a peptide contains a few amino acids that could all be modified independent of each other, the number of combinations rises quickly.
Finally, missed cleavages for the enzyme should be considered, but as for the variable modifications, the number of possible masses quickly rises if many missed cleavages are allowed.
6. Validation of the results
The protein fingerprinting experiment will usually return one or more candidate proteins with scores. The main task is then to determine which hits are true and which are false. To start with one can set a score cutoff in which the false-positive occurrence is within tolerable levels for the particular experiment. A hit that does
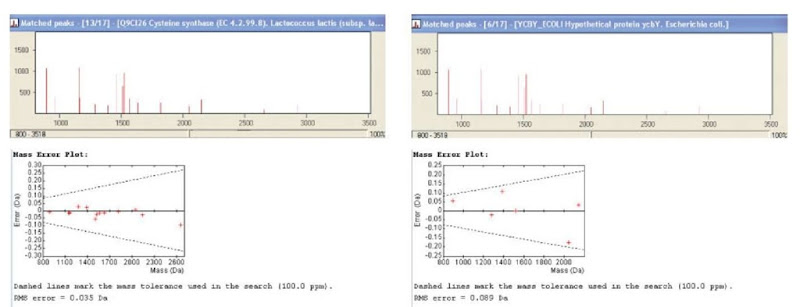
not pass the cutoff but has a good score can then be manually inspected with regard to factors that were not included in the scoring of the search program. If the strong peaks in the spectrum match the protein and the mass error is systematic these are good indications of a true protein hit (Figure 3). Tryptic peptides with a C-terminal arginine are usually quite strong too. However, for certainty, validation with peptide fingerprinting is often required.
Figure 3 Database matches with a MALDI-ToF peak list. In the spectra the matched peaks are in dark red and the unmatched peaks in light red. To the left is the correct hit. The large spectrum peaks are covered in the match and the mass error is linear. Fifty percent of the protein sequence was covered (not shown). To the right is a false hit. Even though some of the large peaks are covered, the protein coverage is only 11% and the mass error is irregular


