ABSTRACT
This paper deals with phase transformations that occur in a Cu-Al-Be single-crystal specimen of shape memory subjected to a tensile test. Two different techniques are used to experimentally evidence these phase transformations: the grid method to obtain strain maps and infrared thermography to deduce heat source distributions from temperature fields. Some typical strain and heat source maps obtained during the loading and unloading phases are discussed and interpreted.
INTRODUCTION
Many studies aimed at studying martensitic microstructures that appear in shape memory alloys (SMA) are available in the literature. Classic means such as microscopes are generally employed to observe them, but the recent development of full-field measurement techniques has made it possible to observe phase appearance and transformation during mechanical tests. The spatial distribution of the phases on the surface of the specimens can be observed by analyzing the contrast in the strain or in the heat source maps. This is due to the fact that the strain level generally varies from one phase to each other and that first-order phase transformation is a phenomenon that is accompanied by latent heat. In Refs. [1-2] for instance, digital image correlation has been used to observe phase transformation in SMA specimens. Phase transformation is accompanied with latent heat that can be deduced from temperature variation fields measured with infrared cameras. This property has been used in Ref. [3] for instance to study phase transformations by combining infrared thermography with digital image correlation.
The aim of the current work is to analyse the response of a SMA specimen subjected to a tensile test using two different full-field measurement techniques: the grid method and infrared thermography. These techniques are complementary since they provide strain and temperature maps, respectively. These maps can be determined at different steps of the load, thus enabling us to analyse the evolution of these quantities when the applied stress increases. These two techniques are described in the first part of the paper. Some typical strain and heat source maps obtained during a tensile test performed on a Cu-Al-Be single-crystal specimen are then shown and discussed.
FULL-FIELD MEASUREMENT TECHNIQUES USED
Grid method
The grid method consists first in depositing a crossed grid on the surface under investigation in order to track the evolution of the grid as loading increases and to deduce the 2D strain fields. The grid is deposited using the procedure described in [4]. The pitch of the grid is equal to 0.2 mm along both directions. Processing images of grids classically provides phase evolution maps of this periodical marking. This phase evolution is then unwrapped and becomes directly proportional to the displacement [5]. Recently, it has been shown that the metrological performance of this technique could be significantly improved by getting rid of grid marking defects which unavoidably occur when grids are printed on their support [6-7]. In particular, a very good compromise is obtained between resolution in strain and spatial resolution. Typically, the resolution is strain is nearly 10-4 for a spatial resolution equal to 30 pixels. In addition, calculations are performed pixelwise, thus allowing to detect very localized phenomena. In the current case, a 12-bit/1040×1376 pixel SENSICAM camera connected to its companion software CamWare is employed. The small strain maps are obtained directly from the images of the grids taken by the camera. Full details on small strain calculation can be found in [5][6] for unidirectional and crossed grids, respectively.
Since large strains must be measured in the current work, the in-plane Green-Lagrange strain tensor E is calculated. In practice, small strain increments are measured using the procedure described in [7]. Assuming that local rotations are small, the Hencky strain tensor H is then deduced by adding these small strain increments. The Green-Lagrange E is finally deduced using the following relationship between E and H
where I is the second-order unit tensor.
Temperature and heat source field determination with an infrared camera
Very small temperature changes on the surface of the specimen under load (painted in black to increase thermal emissivity) are detected since the Noise Equivalent Temperature Difference (NETD) of the camera used in this study (a Cedip Jade III-MWIR featuring a 240×320 IR sensor matrix) is nearly 20 mK. For the thermomechanical analysis of materials, the temperature change is however not really the relevant information since it is the consequence of various phenomena among which phase transformation. Hence heat sources must be determined from these temperature fields using a suitable strategy whose main steps are as follows.
The temperature evolution is governed by the bi-dimensional version of the heat diffusion equation, which is suitable for thin flat specimens [8]
where 8 (x, y, t) is the temperature variation with respect to a reference temperature field measured in practice just before the beginning of the test, s(x, y, t) is the heat source field produced by the material, p is the mass per unit volume, C the specific heat and k the thermal conductivity of the material, which is assumed to be isotropic. t a time constant characterizing the heat exchange with ambient air by convection. This latter quantity is determined experimentally during a simple return to room temperature. In the current study where phase transformations occur, source s is mainly due to phase transformation. The objective here is to retrieve the heat source distribution in order to characterize the phase transformation throughout the specimen. Thermal images are processed using the same procedure as that described in [9]. By integrating in time and dividing by pC, a field of "heat" expressed in °C is obtained.
SPECIMEN PREPARATION AND TESTING CONDITIONS
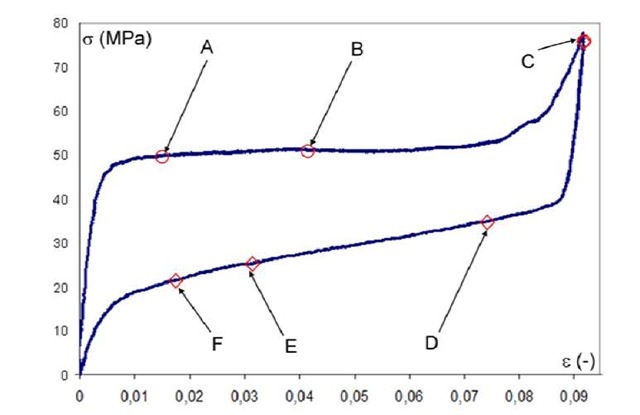
The specimen under test was made of a Cu-Al-Be single-crystal SMA (dimensions: 0.94×17.78x72mm3). The test consisted of a loading-unloading uniaxial test at room temperature. During loading, the strain rate was equal to 0.064 %/s and the maximum strain reached was equal to 9%. The duration of the loading phase was 141.2 s and the maximum stress reached was 73 MPa. The specimen was then unloaded back to zero stress, with a stress rate equal to -0.50 MPa/s up to 20 N. The experiments were performed two times to check that very similar responses were obtained. A typical stress-strain curve obtained during one of these three tests is shown in Figure 1.
TYPICAL RESULTS AND DISCUSSION
Stress-strain curve
A typical stress-strain curve is shown in Figure 1. A classic plateau during which austenite transforms into martensite is clearly visible. A hysteresis loop also occurs. The idea is to observe the strain maps at some points chosen during the loading (points A, B and C in Figure 1) and loading phases (points D, E and F) of the curve in order to analyse the microstructure evolution and its link with the global mechanical response of the specimen. Thermal measurements are also analysed to establish the link that exists between strain and heat source maps.
Figure 1. Typical stress-strain curve obtained
Loading phase
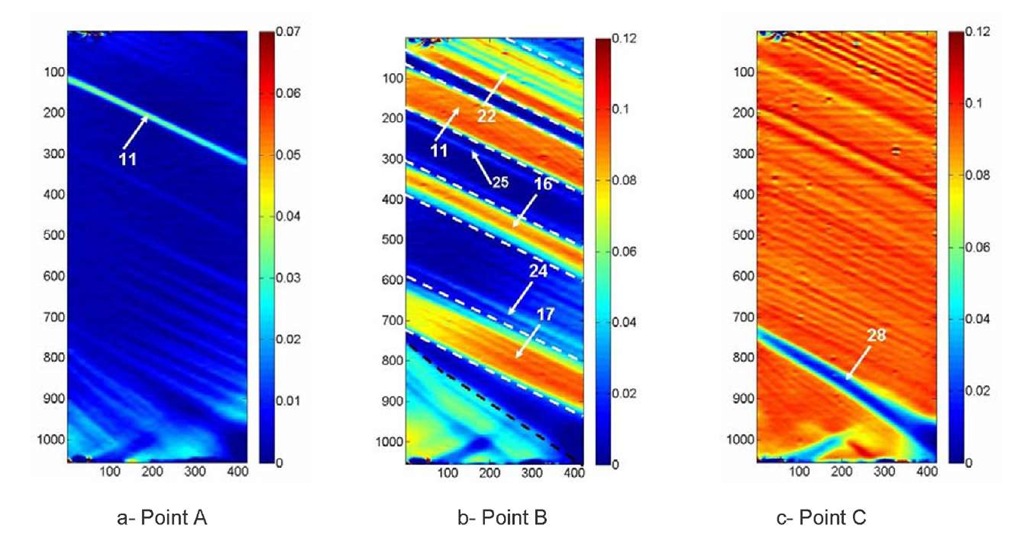
Three typical longitudinal strain maps collected during the loading phase are shown in Figure 2. At the beginning of the test, the specimen is completely composed of austenite which only slightly elastically deforms because of the loading which is applied. Some martensite needles first appear at Point A, which is located at the beginning of the plateau of the curve. Several parallel needles can be easily seen at the bottom part of the specimen as well as along its right-hand side. The strain amplitude in these very thin needles that is given in these figures is however probably not the actual one. It is in fact certainly underestimated because of the nature of the image processing which is used here to retrieve the strain maps. This procedure is based on a windowed Fourier analysis which cannot correctly identify very small events [6-7]. These local significant strain level increases are due to austenite/martensite phase transform which is accompanied by a sudden strain change in the maps, thus revealing the event that has occurred. A needle is very clearly visible at the top of the specimen (see Needle 11 on the Figure). The strain level in this needle is much higher than the strain level observed in the other needles. Its thickness is also greater.
Point B is located at the middle of the plateau. About one half of the austenite has been transformed at this stage. Martensite clearly appears in the red bands in Figure 2-b. Comparing Needle 11 between Figures 1-a and 1-b clearly shows that the displacement of the austenite/martensite transformation front is greater at the bottom of the band than at its top. The strain level in the bands is not completely homogeneous. For instance, the strain level in Band 17 is greater along its right-hand side, thus illustrating the fact that martensite develops from the right to the left. The lower strain level at the left-hand side of this band means that there is a mixture of martensite and austenite in this region. Some intermediate strain levels can be observed at the very top of the strain map at Point B, thus probably revealing that very thin martensite needles are developing in this zone at this stage of the test. The so-called habit planes correspond to the boundary between austenite and martensite. Most of the habit planes are parallel. The habit plane located at the bottom of band 17 exhibits a different orientation. This is probably due to the more complicated state of stress in this region because of the bottom grip which is very close.
Point C is located at the very end of the loading stage. Almost all the austenite has been transformed into martensite at this stage. However, a residual region of pure untransformed austenite still remains in this zone (Band 28). The amplitude of the longitudinal strain is globally the same above and below this austenite band. However, comparing the transverse strain fields in these two regions leads to a significant difference between these two regions (the corresponding figures are not shown in this paper): -4% at the top and -6% at the bottom. This is due to the fact that the martensite variants are certainly not the same from one region to each other. The color shade in the martensitic zone is probably due to the fact that different martensite variants exist and that the twinning plane between these variant is nearly parallel to the habit plane.
The austenite/martensite transformation is accompanied by a heat source localized in the region where this transformation occurs. This heat source can be detected by a suitable processing of the temperature variation maps captured by the infrared camera. Comparing strain maps and heat source maps shows that the phenomena are logically linked in the specimen.
Figure 2. Typical longitudinal strain maps measured during the loading phase
Unloading phase
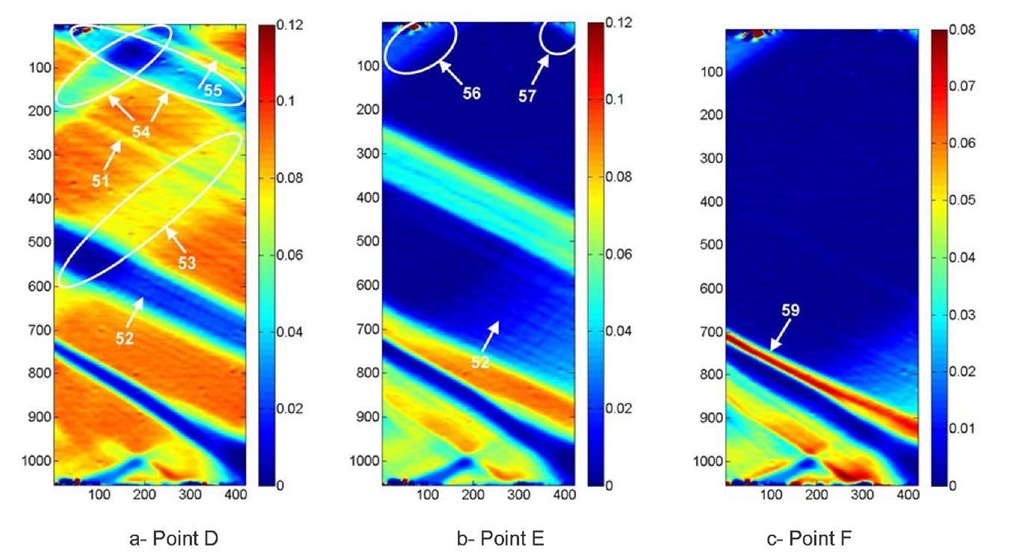
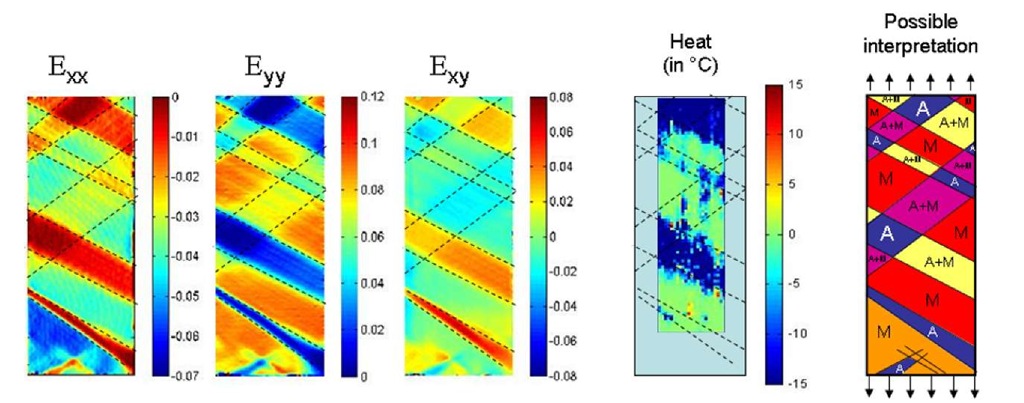
Some other strain maps taken during the unloading phase of the test are shown in Figure 3. Point D is located just after the sudden change of slope level observed in the unloading phase of Figure 3-a. Interestingly, the strain pattern is different of that observed during the loading phase. In particular, some X-shaped microstructures are clearly visible (see for instance Region 55). This particular microstructure corresponds to austenite appearance in the martensite block. The strain level is the lowest at the crossing between the two branches. It is approximately the same as the color in pure austenite in Figure 3-a above, thus showing that pure austenite has appeared here. The strain level in the other parts of these branches lies between the strain level in austenite and in martensite. This is certainly due to the fact that both phases are mixed in this zone. The strain level in Region 53 is lower than in the surrounding martensite and much greater than in the branches the X-shaped zone 55. This is due to the fact that the percentage of austenite in this zone is certainly much lower than the percentage of martensite. These results are confirmed by thermal measurements. Figure 4 presents a comparison between the in-plane strain maps and the heat source map near point D. This figure enables us to identify the zones which were subjected to the reverse transformation (from martensite to austenite). Based on both measurements, an interpretation in terms of microstructures is proposed on the right-hand part of Figure 4.
The strain map at Point E illustrates the fact that the greatest part of martensite is transformed into austenite at this stage. The size of Region 52 has increased. It is also interesting to note that the strain level is slightly greater near the right-hand side compared to the left-hand side, as in Figure 4-a. However, this region stretches significantly along the horizontal direction in Figure 4-a compared to Figure 4-b. This means that the length of the martensite needles that are mixed with austenite in this zone become shorter at Point E, thus showing that they are withdrawing. Interestingly, some traces of the X-shaped region are also still visible in zones 56 and 57.
Point F is located close to the end of the hytheresis loop. A wide austenitic region now clearly appears since it corresponds to the blue zone in the map. It is bordered by martensite bands at the bottom. Some traces of the X-shaped region are still visible at the top right and left corners of the specimen. As in the preceding case, the strain level just above Region 59 and along the right-hand side border is slightly higher than in the other parts of the austenitic zone. Again, it is proposed to interpret this result by the fact that martensite needles progressively withdraw. Finally, the strain pattern is more complex at the bottom of the specimen. This is certainly due to the fact that it is located close to the grips.
Figure 3. Typical longitudinal strain maps measured during the unloading phase
Figure 4. In-plane strain maps and corresponding heat source map measured during the unloading phase, and possible interpretation in terms of martensitic microstructures
CONCLUSION
The grid method and infrared thermography have been combined to investigate the mechanical response of a Cu-Al-Be single crystal specimen subjected to a tensile test. Various martensitic microstructures are clearly revealed by these techniques, especially the grid method with which very small details can be distinguished. The difference between the loading and unloading phases of the hysteresis loop of the strain-stress curve is illustrated by different microstructures that occur during these phases. Identifying the martensite variants that appear in during the test will be the next step of this study.


