ABSTRACT
The high manganese TWIP (twinning induced plasticity) steels exhibit very high mechanical properties compared to others grades. Indeed they have a mechanical strength that can attain 1.5 GPa and fracture strain that can go up to 60%. However the governing damage mechanisms that maximize their ductility are not well understood. To have a better understanding of these mechanisms, in situ tensile tests have been carried out at the European Synchrotron Radiation Facility. During tensile test no necking can be observed which has already been observed on this type of steel. Moreover, the number of cavities in a given volume do not deeply evolve during the deformation meaning that nucleation of voids is weak in the TWIP steel considered. This leads to a maximal number at fracture very low compared to other steels (interstitial free steel, dual phase,…). Morever, the growth of cavities according to local strain seems to be equivalent to other austenitic or ferritic steels. At last, shear bands can be observed in the sample which seems to be correlated with some of the cavities.
Introduction
High manganese austenitic steels are promising candidates in automotive industry due to their excellent mechanical properties. In effect, they exhibit at the same time very high strength (higher than 1000 MPa in tension) and high ductility (about 50% at room temperature). Thus they can absorb a lot of plastic energy before failure due to their unusual work-hardening capacity. This comes from the fact that their stacking fault energy is low enough to permit at the same time deformation by twining and by dislocation gliding without any martensitic transformation that could be detrimental for the ductility. Concerning their fracture behaviour, these alloys do not usually exhibit necking at room temperature but slant fracture because they seem to be sensitive to shearing.
Even if the Fe-Mn-C alloys have been developed for a long time now (Hadfield in 1880 already presented the Fe-Mn-C alloys), their deformation and fracture behaviour are still not well understood and there is a real need to investigate them with novel techniques such 3D X Ray tomography permitting to observe in 3 dimensions the damage mechanisms. Recently, the same type of steel has been investigated by post mortem 3D tomography but on a shearing deformation mode [1]. This study is more dedicated to tensile tension and the evolution of the damage is quantitatively carried out for different strains.
Experimental Procedure
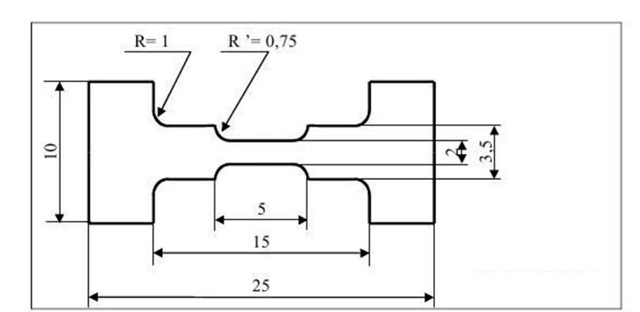
The TWIP steel was cut from a 1mm thick sheet obtained by hot rolling and annealing thermal treatment. The designation of the steel is Fe-22Mn-0.6C (composition in mass percent, balance iron). This steel if fully austenitic at room temperature with an average grain size diameter of about 2-3 ^m. Micro tensile specimens have been machine by spark discharge according to the Figure 1.
Fig 1 Specimen dimensions for in situ X ray tomography
X ray microtomography has been used to quantify damage during in situ tensile tests. The tomography set up is the one located at the ID15 beam line at the European Synchrotron Radiation Facility (ESRF) in Grenoble, France. Tomography acquisition was realised with a voxel size of 1.6 ^m3. Initial reconstructed volumes were median filtered and simply thresholded to differentiate by absorption difference the material from the voids. In order to correlate the distribution of voids with the strain, local values of the strain is obtain by considering the minimal section area S and using the relation:
With S0 the initial section of the sample. The local strain is then calculated at each step. Using this equation implies that the volume fraction of the voids considered is small enough to keep the total volume unchanged. The beginning of the tensile test is carried out with a stress triaxiality of 0.33. Anyway, after some deformation, the triaxiality can evolve. This is considered by using the Bridgman formula [2] considering the curvature radius of the surface of the sample RS:
a being the radius of the minimal section.
Results and discussion
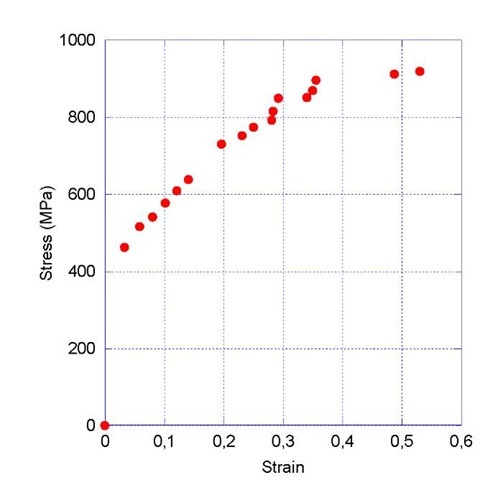
The tensile curve of the sample submitted to tensile test is given in Figure 2. As it can be seen, the mechanical properties of the steel are outstanding with a yield strength of about 460 MPa, an ultimate tensile strength of about 920MPa and a fracture strain of about 0.55. One can notice also the high hardening due to the twinning phenomenon. These values are in accordance with the supplier specifications and explain their promising use in safety parts in automotive industry.
Fig. 2 Stress/strain curve obtain during the in situ tensile test
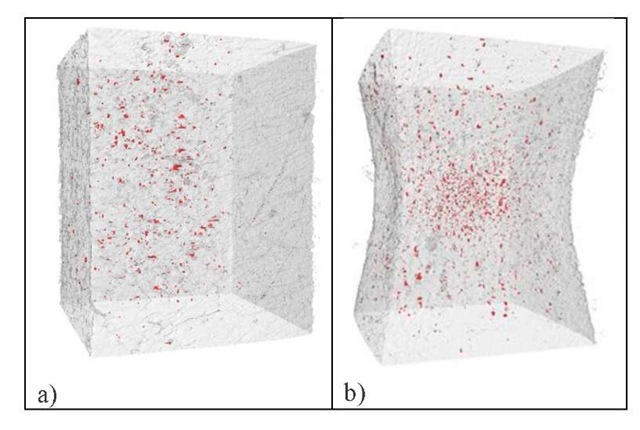
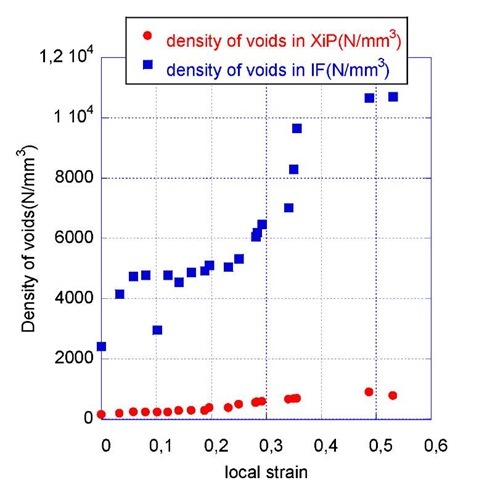
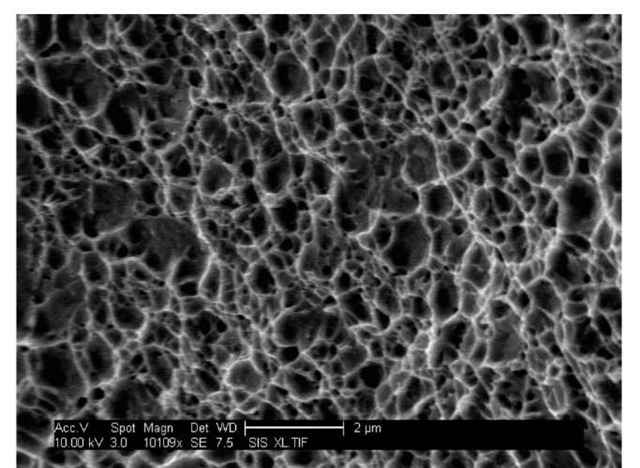
Anyway, figure 3 shows the 3D tomography of the TWIP steel investigated just before the final fracture. For the sake of comparison, the same state for a DP steel from [3] is also shown and the voids are underline by a red color. The difference in fracture behavior between steel with a ferritic matrix and the TWIP austenitic steel is then obvious. When the first one exhibits an important necking and a very high density of voids before fracture, the TWIP steel shows no localization of the deformation and only a small density of voids. This qualitative observation is checked by plotting the number of voids as a function of the local strain in figure 4. This number is compared with the same experiment on an interstitial free steel. This steel has been chosen for comparison in order to have two monophased steels. The different damage behavior is here straight forward. The IF steel exhibits a three steps damage with a high density of cavities for small strains then a step increase for larger strains and finally a saturation of the number of cavities before fracture. This last step is due to coalescence phenomenon leading to the fracture of the sample. The austenitic TWIP steel exhibits a very different behavior: it contains only a small number of voids and shows only a small increase of this number up to the fracture of the sample. It is worth noticing that the number of voids at fracture is quite different between the two steels: around 10000 per mm3 in the case of the IF and 1000 per mm3 for the TWIP steel. This density of voids is very low considering all other type of ductile material at fracture [4, 5, 6]. Anyway, looking at the fracture surface explains partly this point. In fact, the fracture surface of this austenitic steel is characterized by dimples exhibiting a very small diameter (figure 5). Thus smallest dimples are not seen by using this spatial resolution of about 1,6 ^m3 and the number of cavities must be then larger than the one measured. Experiments with better spatial resolution are thus needed to characterize perfectly the damage behavior of such a steel.
Fig. 3 3D views of the damage at the center of the specimen strained at a) £ioc=0.5 (just before fracture) b) DP steel just before fracture.
Fig. 4 Density of voids as a function of the local strain for the TWIP steel and a ferritic one.
Fig. 5 SEM fractography of the in situ tensile test
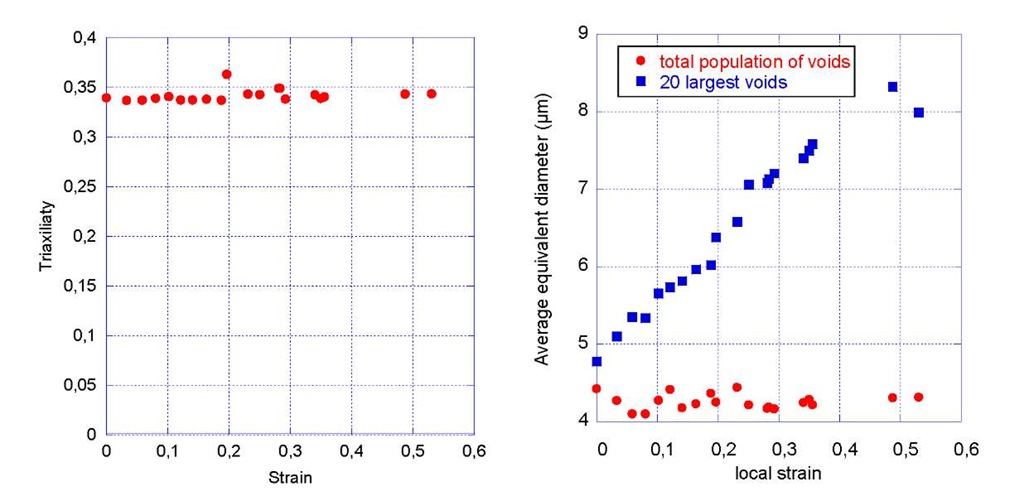
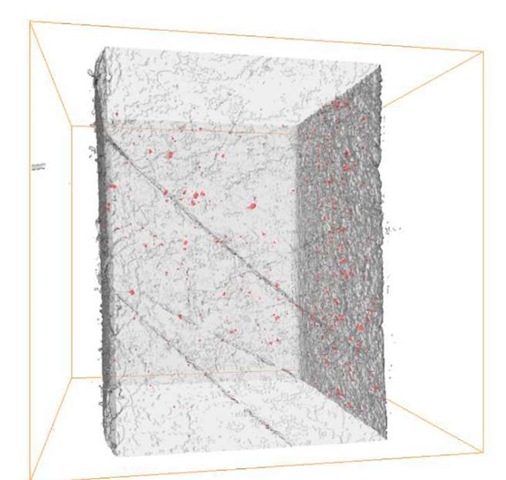
Anyway, as it could be deduced from the absence of necking even at strain close to fracture, the triaxiality in the TWIP steel remains almost constant as it can be seen in Figure 6. Thus considering the Rice and Tacey law, the cavity growth should be limited in the case of TWIP steel, nucleation should be thus the major phenomenon governing the damage behavior. To check that point the evolution of the cavity size is calculated from the 3D images and plotted as a function of the local strain. It can be seen that if the entire population of cavities is considered, the average diameter of the cavity remains constant. This could be due to the fact that in that case, nucleation is also considered. Thus it is worth considering only the 20 largest voids. It leads to the conclusion that growth is experienced during the deformation. This growth is almost equivalent to the one experienced by other steel grade. Thus either the mechanisms governing the growth of cavities is different from the others steels and then growth is possible for low triaxiality or locally the triaxiality could be higher than the macroscopic one. One more interesting feature about the damage behavior of these TWIP austenitic steel is shown in figure 7. This figure shows a 3D picture of the TWIP steel just before fracture. It is clearly seen some shear bands in the material. This is in accordance with previous study on the same alloy but in a different stress state [1]. Primary observations seem to indicate that voids are preferentially situated on these shear bands. Thus we could think that due to these shear bands, the triaxiality could be locally higher involving some growth of the cavities.
Fig. 6 a) Evolution of the triaxiality during the tensile test and b) Evolution of the average equivalent diameter with the local strain
Fig 7 3D picture of the TWIP steel just before fracture showing shear bands
Conclusions and perspectives
3D X ray tomography has been used to get a better insight of an austenitic TWIP steel. It shows that although the triaxiality remains constant equal to 0.33, some cavity growth is experienced. This could be due to the presence of shear bands involving an increase of the local triaxiality and permitting cavity growth. Moreover, the evolution of the number of cavities is different from other steel. However due to the small size of the cavities, tomography with higher resolution is needed to have a better idea of the real number of voids and to propose a clear scenario for the final fracture.
