ABSTRACT
A new type of architectured materials, namely « monofilament entangled materials », were studied in order to have a better understanding of their behavior under compressive loading and damping. The materials studied in this paper were made of an entanglement of a single steel wire. Their complex internal architecture was investigated using X-ray computed tomography. The evolution of the number of contacts per unit of volume, as well as of the density profile, were followed during the compression test in order to compare it to the mechanical results. Dynamical Mechanical Analysis (DMA) was performed to characterize the evolution of the loss factor of this material with the frequency and the volume fraction. It was shown that this material present an interesting strength/loss factor ratio. A discrete element model was proposed to model the mechanical properties of this material.
Introduction
Playing with the architecture of a material is a clever way of tailoring its properties for multifunctional applications. A lot of research have been made, in the past few years, on what is now referred to as « architectured materials » (metal foams [1], entangled materials, steel wool [2], etc), mostly for their capacity to be engineered in order to present specific properties, inherent to their architecture. In this context, some studies have been carried out concerning entangled materials [3], but only a few on monofilament entangled materials [4-6]. Such a material, with no filament ends, could exhibit interesting properties for shock absorption, vibration damping and ductility.
Because of the complex architecture of these materials, X-ray computed tomography is used in this paper as a main characterization method. This technique enables a 3D non destructive microstructural characterization of the material [2], which can be coupled with an in-situ mechanical characterization. Different parameters can be measured from the acquired 3D data: density profiles, number of contact per unit of volume, volume fraction. From the 3D images, a discrete element model [7] is finally defined in order to be able to model the structural and mechanical behaviors of this material.
Samples and procedures
In this study, entanglements were manually produced, using different wire diameters and yield strengths (Table 1) and placed into a cylindrical die with a 15 mm diameter. The samples were initially 35 mm high with a 5% volume fraction. They were then submitted to a constrained (inside a PVC die) in-situ compressive test within the laboratory tomography presented in more details [8] and shown in Figure 1 -A.
Table 1 Properties of the used wires
|
Material |
Diameters (m) |
Yield strength (MPa) |
|
Stainless steel 304L |
127, 200 and 280 |
200 |
|
Pearlitic steel |
120 |
4000 |
The samples were compressed, step by step, with a compression rate of 0.5 mm/s and for each step, samples were unloaded. From the displacement of the grips and the initial length and diameter of the wires, it was possible to calculate the "theoretical" volume fraction of the sample during compression tests (starting at 5%). A 3D volume was acquired and reconstructed (Figure 1-B) for both the loaded and unloaded state. Each image had a 24 ^m resolution. During the whole compression test, a stress-strain curve was acquired and the strength of the entangled media was characterized by discharge modulus measurements (slope of the curve at the first moment of the discharge).
Dynamic Mechanical Analysis was also performed on a set of sample with various volume fractions, for frequencies ranging from 1 to 100 Hz. We then obtained the loss factor that could be used to calculate the specific strength/loss factor ratio.
Figure 1: A) In-situ experimental compressive device, B) example of a reconstructed 3D volume
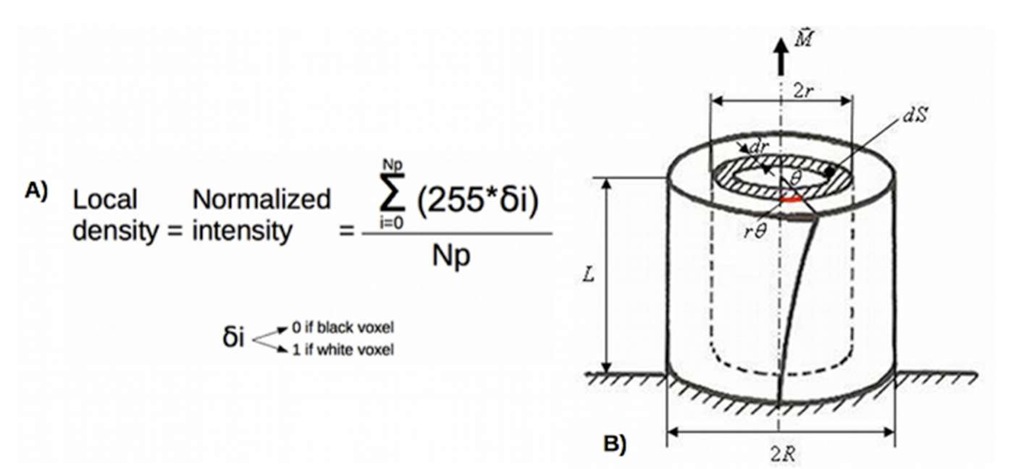
In order to link, the internal architecture to the global mechanical strength of the samples, a microstructural analysis was performed based on the 3D images. The homogeneity of the sample was first studied by monitoring the evolution of the radial density profile. The 3D data were first treated to obtain a binary image where the wire appeared as white voxels, and the air as black. By measuring a local density, as shown in Figure 2-A, for each consecutive tube with a thickness dr (Figure 2-B), we obtained an indicator of the local volume fraction at a distance r of the axis of the die.
Figure 2: A) Local density equation, where Np is the total number of voxels, B) Principle of the recursive density measurement
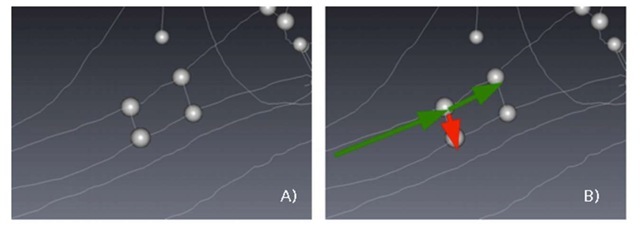
From the binary 3D images, it was also possible to measure the number of contacts per unit of volume. The data was first reduced to its center-line (skeletonization of the wire architecture). The whole structure then consisted in a list of segments and nodes where one contact corresponded to a H-like structure, an example of which is shown in Figure 3-A. By counting the number of segments shorter than the diameter of the wire (definition of a contact point), we could estimate the number of contacts per unit volume. This count could be refined if one considers that, if the distance between two short segments is smaller than the diameter of the wire, those two segments belong to the same contact point (Figure 3-B). After refinement, this calculation was applied to both the loaded and unloaded states, for each volume fraction.
Figure 3: A) H-like structure corresponding to a simple contact, B) Refinement of multiple contact
From those measurements, it was possible to link the evolution of the internal microstructure to the mechanical behavior of this material and thus, have a better understanding of the behavior of the entangled media under compressive loading.
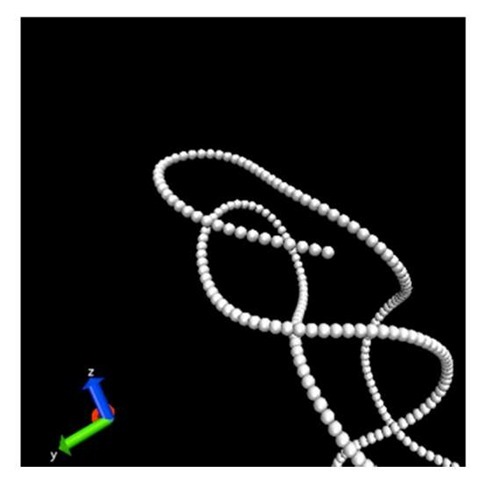
In parallel to the experimental testing and microstructural analysis, a model was defined in order to reproduce the experimental process using a discrete element method. In this model, the wire was represented by a succession of spherical elements (bead-like model) with the same diameter as the wire (Figure 4).
Figure 4: Bead-like representation of the wire
Numerical sample could be generated (i) from a random walk algorithm, or, (ii) from experimental 3D images. In the latter case, the 3D data could either be discretized numerically, using their skeleton, or manually, following the wire by hand. This way, it was possible to obtain a description of the initial structure that corresponds exactly to the experimental samples.
Two consecutives elements along the wire were bonded by a FENE [9] (finite extensible nonlinear elastic) potential, preventing two parts of the wire to cross each other. Friction plays an important role in the comprehension of the behavior of entangled media. It was taken into account via a Coulomb/Hertz interaction [10-12] (Figure 5), allowing to accurately model both the compressive and the hysteretic behavior. The first parenthesized term is the contact force between two particles and the second parenthesized term is the tangential force.
At each "Molecular dynamic timestep", the tangential force, which corresponds to a "history" effect, is updated to account for the tangential displacement between the particles for the duration of the time they are in contact.
Figure 5: Expression of the granular force between two particles in contact with:
delta = d – r = overlap distance of 2 particles
Kn = elastic constant for normal contact
Kt = elastic constant for tangential contact
gamma_n = viscoelastic damping constant for normal contact
gamma_t = viscoelastic damping constant for tangential contact
m_eff = Mi Mj / (Mi + Mj) = effective mass of 2 particles of mass Mi and Mj
Delta St = tangential displacement vector between 2 spherical particles which is truncated to satisfy a frictional yield criterion
n_ij = unit vector along the line connecting the centers of the 2 particles Vn = normal component of the relative velocity of the 2 particles Vt = tangential component of the relative velocity of the 2 particles
In our model configuration, the sample is contained within a cylindrical die like in the experiment. Regarding friction, the die interacts in the same way as the constitutive elements of the wire. Two pistons were then created in order to apply the displacement along the axis of the cylinder. It was finally possible to fit the model’s parameter using the static experimental results, as well as the dynamic ones (application of a sinusoidal displacement).
From this model, stress-strain curves could be plotted as well as density profiles in order to compare them to the experimental ones.
Results and discussion
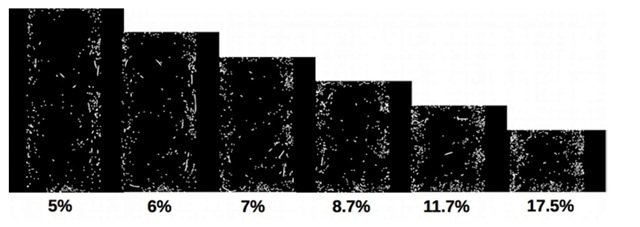
A qualitative study of the 3D data was performed in order to have a first look at the compressive behavior of monofilament entangled materials. From the tomography data, it was possible to extract a median section of the sample along the axis of compression in order to follow qualitatively the evolution of the microstructure through the mechanical test.
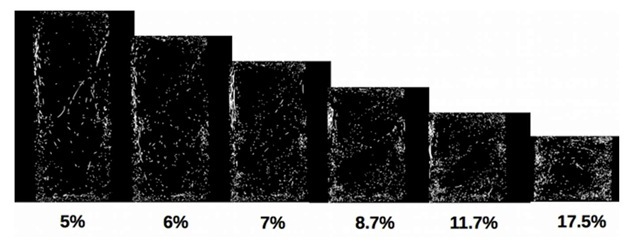
Figure 6: Evolution of the cross section of a monofilament entangled sample (stainless steel, 200^m diameter) as a function of the volume fraction
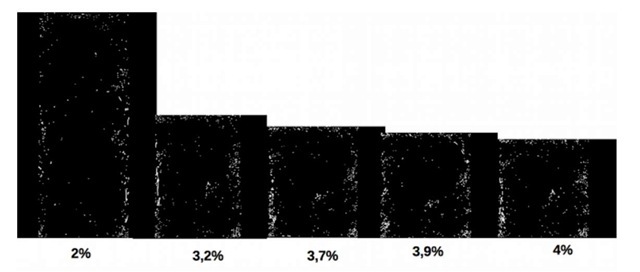
Figure 7: Evolution of the cross section of a monofilament entangled sample (stainless steel, 127[^m diameter) as a function of the volume fraction
In the case of stainless steel wire, a follow-up of the deformation was performed for two diameters (Figure 6 and 7). First, we can notice, for both diameters, that the distribution of the wire through the volume of the sample is heterogeneous. The local density seems higher at the contact with the mold and the pistons and smaller in the center. The increase of the volume fraction does not appear to radically change this heterogeneous distribution. Nevertheless, the sample with the smaller diameter (127 ^m) seems slightly more homogeneous than the one with a 200^m diameter. This was expected since smaller wire diameter means smaller curvature radius and thus easier arrangement of the wire for the same mold radius.
Figure 8: Evolution of the cross section of a monofilament entangled sample (pearlitic steel, 120^m diameter) as a function of the volume fraction. The volume fractions are different from the one for the stainless steel because of technical limitations.
In the case of the pearlitic steel (Figure 6-B), we can notice that the profile is even more heterogeneous. Due to the very high yield strength of the wire, the curvature radius is very large and the wire ends up on the outer volume of the mold.
Qualitatively, we can already notice the heterogeneous nature of monofilament entangled materials submitted to a constrained compression test, as well as the influence of the diameter and yield strength of the constitutive wire.
Conclusion
In this study, a set of methods was defined in order to characterize the behavior of entangled media and more particularly, of monofilament entangled materials. The mechanical behavior of such a material can now be linked to its microstructure, which was showed to be more or less heterogeneous, depending on the wire’s characteristics. Both mechanical and microstructural behaviors can also be modeled using a discrete element method, taking into account friction.

