INTRODUCTION
This article describes how the technology of geographic information systems (GIS) can be used as a tool to integrate various types of community-level data to address local problems. The purpose of the article is to present an approach that can be replicated by others. This approach is based on community-wide collaborative sharing of resources, data, and research applications with an aim to enhance the health and well-being of the local area population. Although the example used relates to health, the approach can be used to deal with any “event” or series of events in the community.
BACKGROUND
A GIS is a set of hardware and software for inputting, storing, managing, displaying, and analyzing geographic or spatial data or any information that can be linked to geographic location, such as events, people, or environmental characteristics (Bailey & Gatrell, 1995; Burrough & McDonnell, 1998). The advantages of GIS as an information system pertain to its ability to handle spatial data; integrate data from many sources; uncover spatial patterns and relationships by superimposing different data layers and viewing data at different levels of aggregation; and conduct spatial analyses to test hypotheses and make predictions. Significant advances in the field of GIS and spatial statistics in the last 20 years have enabled researchers to undertake a more extensive examination of the spatial component of a wide variety of applications. The visualization and analytic capabilities of a GIS enable the user to examine and model the interrelationship between spatial and nonspatial etiologic factors in a variety of events ranging from house sales to crime activity to breast cancer.
The American Community Survey (ACS; 2002) is an ongoing survey conducted by the U.S. Census Bureau. Data are collected monthly and are used to provide annually adjusted estimates of the current population based on an approximate 2.5% sample, with oversampling for small governmental units, such as American Indian Reservations. Full implementation of the survey will begin in 2004 (Census, 2003). ACS data forms the source of population data for the current study.
Despite the fact that ACS does not provide complete population counts, it can be used to derive community profiles, emphasizing relative proportions in each population subgroup. It can also be used as a mechanism for measuring changes and trends in the population in the interval between decennial census counts.
The Health Geographics Program at Baystate Medical Center in Springfield, Massachusetts, takes a comprehensive approach to the implementation of services, research, and community applications utilizing GIS. Because of its collaboration, giving access to community and hospital data, the program was contracted by the U.S. Census Bureau to undertake two case studies to demonstrate the utility of annually adjusted data from the American Community Survey.
The case study described here utilizes the ACS population and housing data in a GIS to improve breast cancer intervention programs. Previous research has clearly established that by lowering the rate of late-stage disease with increased mammography screening, breast cancer mortality can be reduced (Feig, 1988; Marchant, 1994). Furthermore, there is evidence that socioeconomic and cultural disparities in breast cancer screening exist (Katz, Zemencuk, & Hofer, 2000; O’Malley, Kerner, Johnson, & Mandelblatt, 1999; Phillips, Kerlikowske, Baker, Chang, & Brown, 1998). Several investigators have applied GIS and spatial analysis in the past to identify etiologic factors in breast cancer and late-stage breast cancer (Brody et al.,1997; Gardner, Joyce, & Melly, 1999; Kulldorff, Feuer,Miller, & Freedman, 1997; Lewis-Michl et al., 1996; Melly, Joyce, Maxwell, & Brody, 1997; Roche, Skinner, & Weinstein, 2002; Selvin, Merrill, Erdmann, White, & Ragland, 1998; Sheehan et al., 2000; Timander & McLafferty, 1998).
THE GIS APPROACH
The main functions of a GIS are data integration, visualization, exploration, statistical analysis, and modeling (Bailey & Gatrell, 1995). These functions can be combined in a systematic approach to solve problems. This approach can be outlined as follows:
1. Integrate data from multiple sources
2. Visualize the data with maps
3. Explore patterns further with spatial statistics
4. Generate hypotheses
5. Test hypotheses with mathematical modeling
We will describe how this approach was applied to the case study referred to above.
CASE STUDY: INVESTIGATING LATE-STAGE BREAST CANCER
The aim of the study was to create a profile of communities in Springfield in need of increased breast cancer screening. Specifically, we wanted to identify parts of the city with high rates of late-stage disease as well as identify socioeconomic and demographic factors in late-stage disease. This information would aid resource allocation by focusing intervention efforts on high-risk areas. Furthermore, it would allow the design of “culturally appropriate” (Healthy People, 2000) screening programs.
Applying the GIS approach, the first step was to gather and integrate data from three different sources. Geographic data were obtained from the City of Springfield Planning Department. This consisted of geographic boundaries and street locations that would be used in the geocoding process described later. ACS housing and population data provided aggregate information on demographic and socioeconomic characteristics of women over 40 by police sector (Table 1). Police sectors were used for this case study, because this was the smallest geographic unit for which ACS data were available. There are nine police sectors in Springfield. Breast cancer case data from the Springfield’s two hospital oncology registries gave information on the dates and stages at diagnosis and home addresses for all patients diagnosed at these two hospitals. Together, these registries capture 95% of all cases of breast cancer in the city.
Cases were staged according to the American Joint Cancer Committee (AJCC; AJCC, 1997). Cases were defined as “late stage” if they were Stage 2 or greater. This definition captures all cases that should have been detected earlier had mammography been performed. A total of 891 breast cancer cases were diagnosed during 19951999, with 194 of these defined as late stage.
All data for the study were converted to dBASE IV format to be read into the GIS. Geographic data was in the form of ArcView (ESRI, 1999) shapefiles. Geographic and tabular data were imported into the GIS using ArcView. ArcView was used for all GIS functions. Geocoding of case locations was based on the patient’s street address, using the City of Springfield streets shapefile as the reference database. Mapping of case locations was based on patient’s home address. Mapping was done at a small enough scale so that individual patient addresses could not be determined from the map, in order to preserve patient confidentiality.
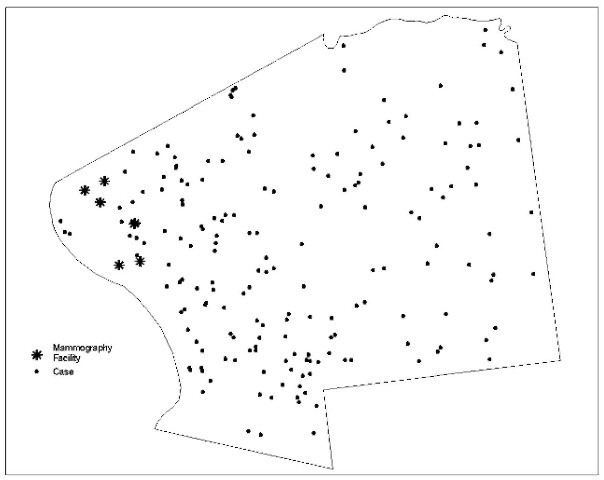
The next step in the GIS approach was to visualize the data. This was done by mapping the data in ArcView. We chose a dot map to display the geographic distribution of cases of late-stage disease and indicate areas of concentration. This would show where raw numbers of cases were greatest and more resources were needed, e.g., where mobile mammogram units and educational or other intervention programs would be likely to have the highest yield. Visual examination of the map in Figure 1 reveals no apparent clustering.
Table 1. ACS variables
| Variable | Universe |
| Proportion for each race (white, black, etc.) | Women > age 40 |
| Proportion Hispanic | |
| U. S.-born, foreign-born, Puerto Rican born | |
| Naturalized citizens, noncitizens | |
| Linguistically isolated | |
| Married, unmarried | |
| Unemployed | |
| Employing public transportation to work | |
| High school diploma | |
| Below poverty level (12.5K) | |
| Using food stamps | |
| Receiving public assistance | |
| Median income | Households |
| Vacant | Housing |
| Median value |
Figure 1. Dot map depicting the locations of late-stage breast cancer cases and mammography facilities in Springfield, Massachusetts

Clustering can be formally tested in the next step, exploring patterns further with spatial statistics. In this study, we used the spatial scan statistic (Kulldorff et al., 1997; Kulldorff, Rand, Gherman, Williams, & DeFrancesco, 1998). This technique employs a systematic, iterative “searching” of space conceptually with overlapping circles, counting cases and people, and revealing areas of unusually high rates, or clusters. The software used to perform this analysis was SATScan, a free, publicly domain program (Kulldorff, Rand, Gherman, & DeFrancesco, 1998). Preliminary findings from this study showed no statistically significant spatial clustering of cases. From the results of this visual and statistical examination, we concluded that rather than concentrating resources in specific parts of the city, a more global approach to intervention seemed warranted.
We were also interested in whether the location of mammogram facilities influenced the rate of late-stage disease in the different police sectors. This has been shown to be a factor in screening (Athas & Amir-Fazli, 2000). Using ArcView, we overlaid a map of their locations onto the dot density map of cases (Figure 1). Although case location did not appear related to mam-mography facility location, we would later test this relationship with formal statistical modeling.
To estimate the risk of getting late-stage disease, case data were aggregated or summed to the police-sector level for which population estimates were available. The total number of cases of late-stage breast cancer for each sector were divided by the ACS population estimates for the total number of women over 40 (the population at risk for breast cancer) for that sector. This represented the prevalence rate of late-stage disease.
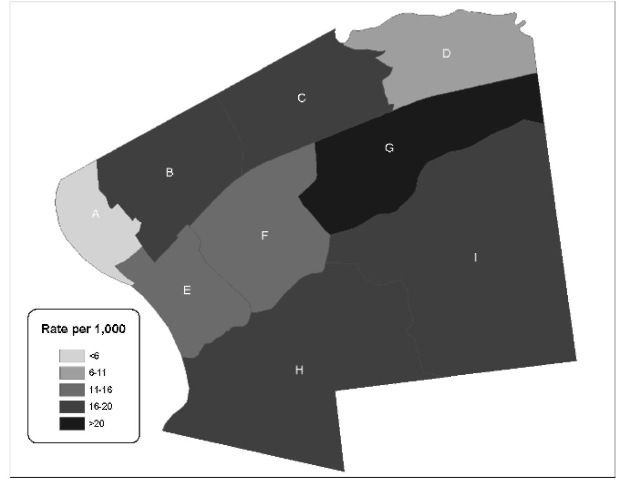
We mapped these rates in the GIS using choropleth maps to look for areas with unusually high rates. A choropleth map is used to display quantities for various geographic areas. Figure 2 shows the rate of late-stage breast cancer per 1,000 women over 40 in each police sector. Darker shades indicate police sectors with higher rates of late-stage disease. According to this map, Sector G has the highest rate. We needed to investigate what characteristics of this sector make women at higher risk for late-stage disease.
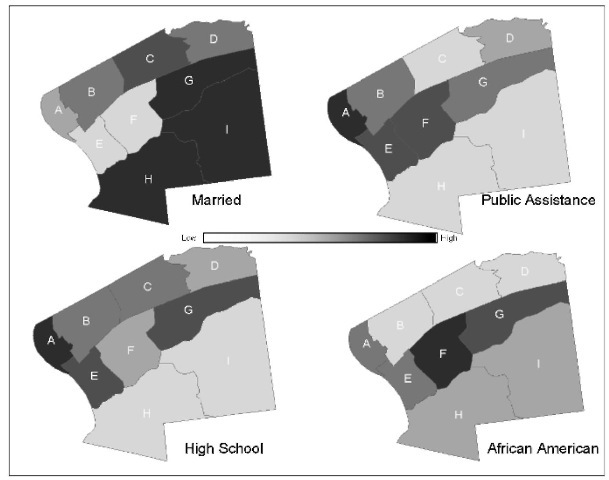
To generate hypotheses about etiologic factors in late-stage disease, the next step in the GIS approach, we compared the choropleth map of late-stage disease by sector, with maps showing the distribution of various demographic and socioeconomic sector characteristics. Pattern similarities would indicate a possible relationship between these characteristics and the risk of late-stage breast cancer. Figure 3 shows the proportion of women over 40 who are married, receive public assistance, have a high school diploma, or are African American. Darker shades on the maps represent higher concentrations of these populations, and vise versa. Similar maps (not shown) were generated for other ACS demographic and socioeconomic variables listed in Table 1. The sector with the highest rate of late-stage disease (Sector G) had among the highest rates of African American or married women or those with a high school diploma or receiving public assistance. This generated the hypothesis that socioeconomic and demographic factors are related to late-stage disease.
Figure 2. Choropleth map showing the rate of late-stage breast cancer per 1,000 women over 40 (darker shades indicate higher rates)

The final step in the GIS approach was to use mathematical modeling to test hypotheses about cause-effect relationships. To accomplish this, a spatial regression was conducted to identify sector demographic and socioeconomic characteristics that made women at particularly high or low risk for late-stage disease. Spatial regression was conducted using the S-PLUS for ArcView extension (Insightful, 2000). This technique is helpful in sorting out the effect of various factors not necessarily apparent by mapping, and identifying characteristics of high-risk population subgroups. The unit of analysis for the regression analysis was police sector. The dependent variable was the rate of late-stage disease per thousand women over 40. Independent variables were the ACS estimates for sector population and housing characteristics from Table 1, as well as the number of mammogram facilities.
Four factors were predictive of late-stage disease: African American race, presence of a high school diploma, and foreign born or married status in women over 40. These factors were all positively related to the rate of late-stage disease: the risk of a woman’s getting late-stage disease was greater in sectors with higher rates of African American, married, or foreign-born women, or those with a high school diploma. The number of mammogram facilities in a sector did not affect the rate of late-stage disease in that sector.
The results of this study can help in the allocation of resources and the design of culturally appropriate intervention programs. Areas of the city with high concentrations of cases or populations at highest risk of late-stage disease (e.g., African Americans or foreign born) can be targeted for increased resources for screening intervention such as education programs or mobile mammogram units. The fact that high school graduation was a risk factor in late-stage disease indicates that program materials should be geared to a higher educational level so as not to discourage more educated women from participating. The importance of foreign birth suggests potential avenues for reaching high-risk women through various national cultural organizations, such as the Greek Cultural Council in Springfield. The increased risk for African American women suggests working with African American organizations, many of which already target specific health problems.
Figure 3. Rates of women over age 40 in Springfield, Massachusetts, according to various socioeconomic and demographic factors from the American Community Survey (darker shades indicate higher rates).

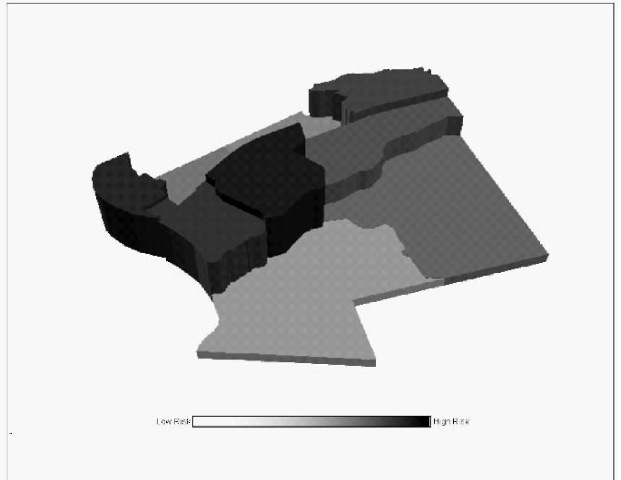
Figure 4. Three-dimensional map of locations of high-risk populations for late-stage breast cancer in Springfield, Massachusetts (darker and taller sectors are higher risk)

Although the ACS data used are only preliminary estimates based on one year of survey data on a relatively small sample of the population, they demonstrate the importance of socioeconomic factors in the geographic distribution of late-stage disease, which is relevant to the design of intervention programs.
FUTURE TRENDS
With future advances in GIS technology, many of the functions of database management (such as importing data, joining tables, creating new variables, calculating new fields) as well as visualization (mapping) and analytic functions can be automated, and the entire process can be saved in the GIS for future use with updated or entirely different data sets. The ability to model the process described in this paper, then edit, save, and recall it is a new feature in the latest version of ArcGIS (ESRI, 2004).
Although not yet fully implemented throughout the country, the American Community Survey holds the most promise as a source of up-to-date U.S. population estimates for the type of application we have described. Data used in the present study were a special tabulation provided by the American Community Survey as part of our contract. However, the first data products for the smallest areas and populations throughout the United States will be available publicly in 2009. Once data products are produced for a population group or area, they will be updated each year (Census, 2003). The ACS will completely replace the Long Form of the next U.S. Decennial Census in 2010.
CONCLUSION
This article demonstrates how each of the main GIS functions outlined by Bailey and Gatrell can be implemented in an approach to address a particular community health problem. Geographic and population data can be used in a GIS to create a visual demographic profile of communities by providing denominators for the calculation and visualization of risks (incidence or prevalence rates), identifying the size and location of high-risk populations, and providing information on socioeconomic and demographic characteristics that can be used in analysis to identify risk factors for late-stage disease. It facilitates the design of culturally appropriate intervention and prevention programs. It enables the creation of community demographic profiles by identifying the size and geographic location of high-risk population subgroups. This is a tremendous aid for public health or other community agency planning and resource allocation.
The approach described here can be applied with any census geography (tracts, block groups, etc.) for which ACS or other population estimates (e.g., the Decennial Census) are available. This enhances its usefulness for a number of purposes and geographic scales. The broad utility of the ACS in providing accurate and timely data on the population and the economic environment in which it exists make it an essential tool in health care as well as other current community issues, such as homeland security. As ACS implementation continues to expand throughout the country, these benefits will become widely available to state and local public officials and agencies. Hopefully, this article will stimulate them to utilize these data in significant ways to improve and protect the health and well-being of our population.
KEY TERMS
ACS (American Community Survey): An ongoing survey conducted by the U.S. Census Bureau that collects detailed demographic and socioeconomic information on a sample of the population.
Choropleth Map: A color-coded map, also called a “thematic” map, in which geographic areas are portrayed in different hues or intensities according to their values on some quantities.
Culturally Appropriate: Refers to an unbiased attitude in organizational policy that values cultural diversity in the population served. Reflects an understanding of the diverse attitudes, beliefs, behaviors, practices, and communication patterns that could be due to race, ethnicity, religion, socioeconomic status, historical and social context, physical or mental ability, age, gender, sexual orientation, or generational and acculturation status. Includes awareness that cultural differences may affect health, and includes the effectiveness of health care delivery. Knowledge of disease prevalence in specific cultural populations, whether defined by race, ethnicity, socioeconomic status, physical or mental ability, gender, sexual orientation, age, disability, or habits (Healthy People, 2000).
Dot Map: A map in which the geographic locations of events, people, or other entities are depicted as points or dots.
Geocoding: A function of the GIS through which the geographic location of an address is given a set of geographic coordinates by reference to a standard geographically referenced database. These coordinates are then used for mapping.
Geographic Information System (GIS): A computer-based set of tools for capturing (collecting), editing, storing, integrating, analyzing, and displaying spatially referenced data (Bailey & Gatrell, 1995).
Late-Stage Breast Cancer: Breast cancer in an advanced stage, usually defined as involvement of regional lymph nodes or size larger than 2 cm.
Spatial Regression: A spatial analytic technique modeling the relationship of various factors to the geographical distribution of some attribute measured on a continuous scale.
Spatial Scan Statistic: A cluster detection statistic that uses a moving window to compare the number of events or case locations inside versus outside the window. This statistic can identify geographic clustering of disease cases or geographic areas with unusually high or low rates of disease.
