Broadly speaking, image enhancement algorithms fall into two categories: those that operate in the "spatial domain", and those that operate in the "frequency domain". Spatial processing of images works by operating directly on an image’s pixel values. In contrast, frequency domain methods use mathematical tools such as the Discrete Fourier Transform to convert the 2D function an image represents into an alternate formulation consisting of coefficients correlating to spatial frequencies. These frequency coefficients are subsequently manipulated, and then the inverse transform is applied to map the frequency coefficients back to gray-level pixel intensities.
In this topic, we discuss a variety of common spatial image processing algorithms and then implement these algorithms on the DSP. Image enhancement per se sometimes means more than enhancing the subjective quality of a digital image, as viewed from the vantage point of a human observer. The term may also refer to the process of accentuating certain characteristics of an image at the expense of others, for the purpose of further analysis (by either a computer or human being).
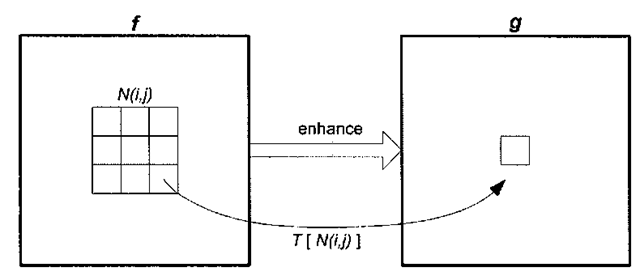
Spatial processing methods are one of the most common forms of image processing, as they are relatively simple but quite effective. The general idea is to enhance the appearance of an image / by applying a gray-level transformation function T that maps the input pixels of/ to output pixels in an image g, as shown in Figure 3-1.
Figure 3-1. Image enhancement via spatial processing.
If the neighborhood N(i,j) consists of a single pixel, then this process entails a remapping of pixel intensities. If r denotes the input pixel values and s denotes the output pixel values, then
where T is a monotonic mapping function between r and s, and
and thus
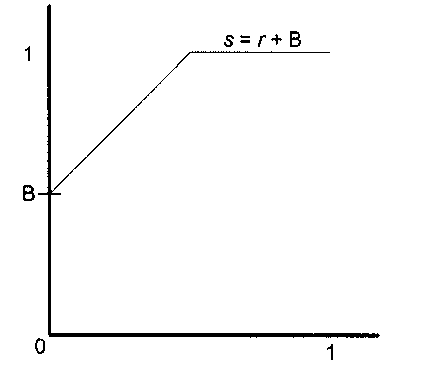
These types of spatial transform functions, where the transform function T is based solely on the input pixel’s value and is completely independent of location or neighboring pixel values, are called point-processing operations. For example, consider the case of brightening an image by adding a constant B to each pixel in the image f. Assuming pixel values are normalized to lie within the range [0,1], the gray-level transformation function would look something like Figure 3-2, where the brightening is accomplished by the addition of a constant value B to each pixel intensity. Another point-processing operation, which is the focus of this topic, is histogram modification. We can treat the population of image pixels as a random variable, and with this in mind, the histogram of a digital image is an approximation to its probability density function (PDF). The image histogram, the discrete PDF of the image’s pixel values, is defined mathematically as:
Figure 3-2. Image brightening transformation function.
where
• q = bits per pixel, and k = 0,1,2,…, 27-l
• rik = number of pixels in image with intensity k
• N = total number of pixels in image
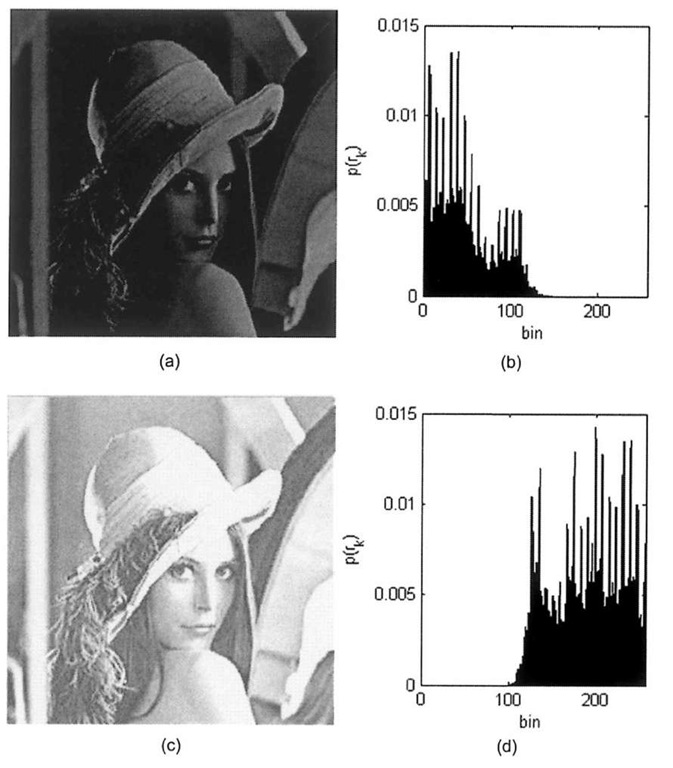
The histogram function bins the number of pixels for each possible r*; for example an 8-bit image histogram has 256 bins to cover the spectrum of gray-levels ranging from 0 to 255. The division by the total number of pixels in the image yields a percentage for each particular pixel value, hence the fact that the image histogram is in fact the discrete PDF of the 2D image function f(i,j). Inspection of the histogram is a reasonable first indicator of the overall appearance of an image, as demonstrated by Figure 3-3, which shows a dark and bright image along with their associated histograms.
This topic explores three image enhancement algorithms that feature manipulation of the input image’s histogram to produce a qualitatively better looking output image: contrast stretching, gray-level slicing, and histogram equalization.
Figure 3-3. Comparison of dark vs. bright images, (a) Dark image, (b) Dark image histogram, (c) Bright image, (d) Bright image histogram.


