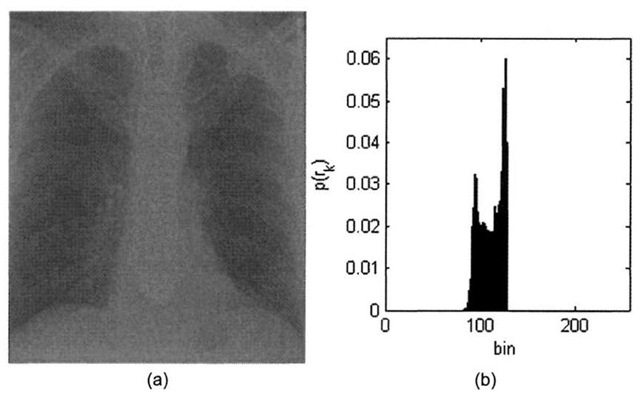
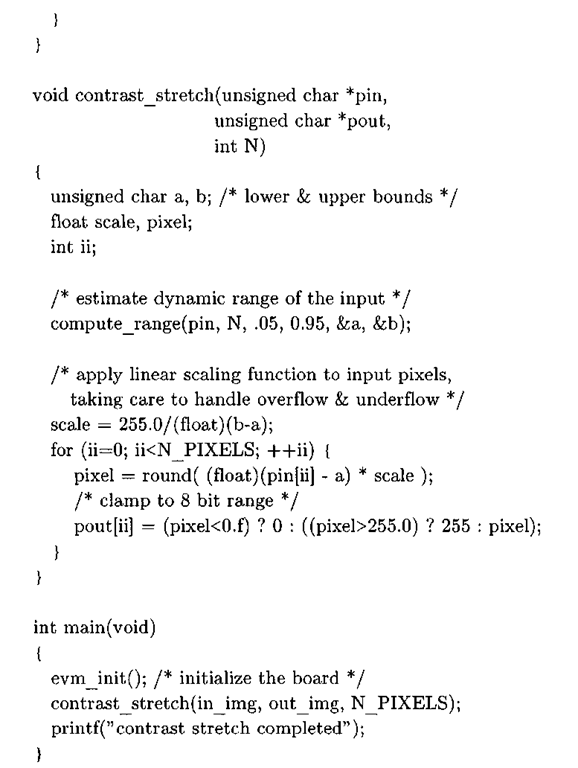
The contrast of an image is a measure of its dynamic range, or the "spread" of its histogram. The dynamic range of an image is defined to be the entire range of intensity values contained within an image, or put a simpler way, the maximum pixel value minus the minimum pixel value. An 8-bit image at full contrast has a dynamic range of 28-l=255, with anything less than that yielding a lower contrast image. Figure 3-4 shows a low- contrast 8-bit x-ray image with a dynamic range of 49, along with its histogram.
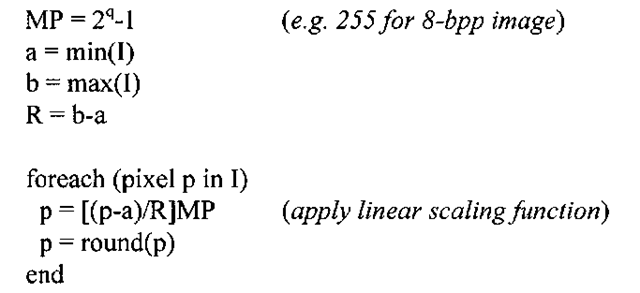
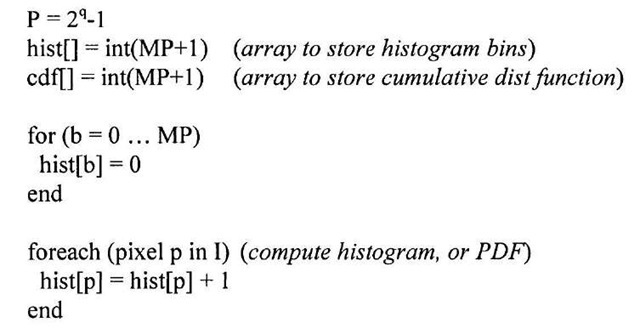
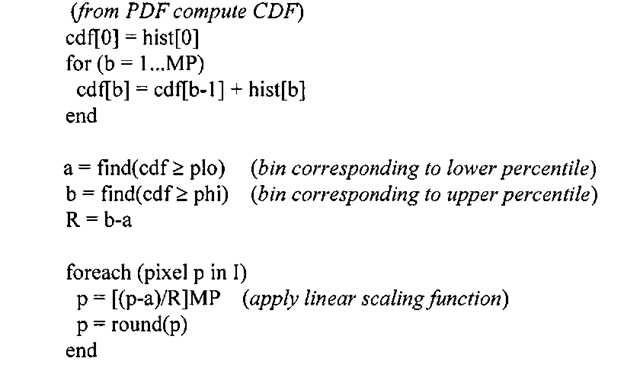
The minimum pixel value in Figure 3-4a is 81, and the maximum pixel value is 127. Increasing the dynamic range entails "stretching" the histogram in Figure 3-4b by applying a linear scaling function that maps pixel values of 81 to 0, maps pixel values of 127 to 255, and scales pixel intensities that lie within the range [82-126] accordingly. The contrast-stretch algorithm essentially pulls the boundaries of the original histogram function to the extremes. This process is detailed in Algorithm 3-1.
Algorithm 3-1: Contrast Stretch
INPUT: q-bit image I
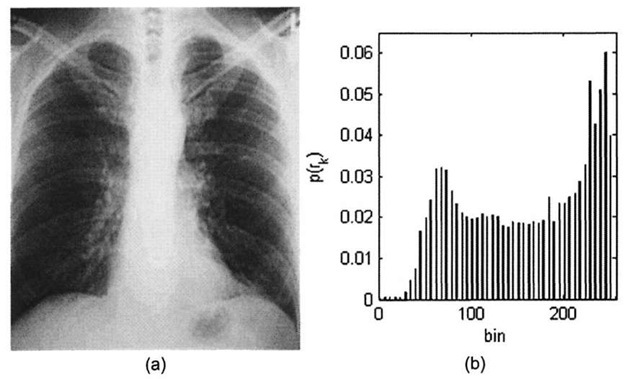
Contrast stretching the image in 3-4a along the lines of Algorithm 3-1 produces what is shown in Figure 3-5. The image now takes on the full 8-bit range, and correspondingly the new histogram is spread out over the range 0-255, resulting in an image that subjectively looks far better to the human eye. However, the drawback to modifying the histogram of an image in such a manner comes at the expense of greater "graininess." If the original image is of rather low-contrast and does not contain much information (i.e. most of the pixels fall into a rather small subset of the full dynamic range), stretching the contrast can only accomplish so much.
Contrast stretching is a common technique, and can be quite effective if utilized properly. In the field of medical imaging, an x-ray camera that consists of an array of x-ray detectors creates what are known as digital radiographs, or digital x-ray images. The detectors accumulate charge (which manifests itself as a larger pixel intensity) proportional to the amount of x-ray illumination they receive, which depends on the quality of the x-ray beam and the object being imaged. A high-density object means less x-rays pass through the object to eventually reach the detectors (hence the beam is said to be attenuated), which results in such higher density areas appearing darker.
Figure 3-4. X-ray image courtesy of SRS-X, http://www.radiology.co.uk/srs-x. (a) Low contrast chest x-ray image, (b) Low contrast histogram.
Figure 3-5. (a) Contrast-stretched chest x-ray image, (b) Modified histogram.
Likewise, the beam will not be as attenuated when passing through low-density areas and here the image will appear bright, as the detectors accumulate comparatively more charge. When displaying the acquired image, it is common to reverse the polarity of the image by creating the negative, which is why the dense areas (bone) in Figure 3-4a and 3-5a appear white and the less dense areas (soft tissue and background) appear dark. The overall quality of the radiograph is directly related to the characteristics of the detectors and the amount of x-ray exposure the detectors absorb. Too little illumination and the image appears dark and of low-contrast. More illumination means greater contrast and a better quality image, with a larger delta between pixel intensities corresponding to the bony areas and the background (compare the quality of 3-4a with that of 3-5a). Too much illumination however, will saturate the image, a condition where most of the pixel values will be clustered in the upper portion of the dynamic range and a loss of information occurs, due to clamping of grayscale intensities. Such a situation is analogous to using too high of a flash level when taking photographic images, thereby producing a "washed out" image.
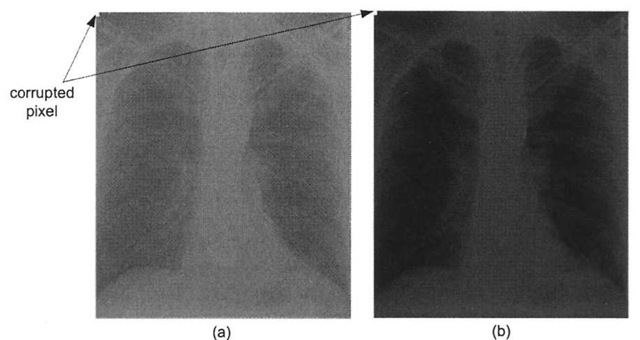
In certain medical imaging applications such as fluoroscopy, repeated radiographs are taken of a patient. Because the patient is subjected to larger amounts of x-ray radiation, it is advantageous to acquire the radiographs using the least amount of x-ray exposure as possible, while still obtaining images of the required contrast. Here the contrast stretching technique can be quite useful, as employing this histogram modification technique allows acquisition systems to obtain useful images while reducing the amount of x-ray exposure to the patient. However, one major drawback with the contrast-stretching algorithm is its susceptibility to noise – a single outlier pixel can wreak havoc with the output image. Figure 3-6 shows the same low-contrast chest radiograph and the results of enhancing the radiograph via the contrast stretching process, but this time the image suffers from outlier noise. As exhibited here, the presence of just a few outlier pixels dramatically reduces the overall effectiveness of the linear scaling function – in fact in this case, it is nullified completely. One problem with digital radiograph detectors is so-called "shot" or "salt and pepper" noise, whereby the image is corrupted with certain pixels taking on the maximum or close to maximum pixel value. For example, if even a single detector fails to accumulate charge during the acquisition process, perhaps because of a transient condition or due to insufficient x-ray illumination, the estimated dynamic range is artificially high, and the linear scaling function fails to remap the pixels properly, as demonstrated in Figure 3-6b.
Applying a small amount of intelligence during estimation of the dynamic range of the input image can help ameliorate this problem. Instead of blindly computing the dynamic range in Algorithm 3-1 using just the minimum and maximum pixel values, a more robust and adaptive technique is to use the 5th and 95th percentiles of the input values when deriving the dynamic range of the input image.
Figure 3-6. Noise reducing the effectiveness of contrast-stretching, (a) Corrupted low-contrast x-ray image, (b) The presence of the single noisy pixel prevents the scaling function from stretching the histogram. In fact, in this case it actually shrinks the histogram, thereby reducing the contrast!
Yet another strategy is to locate the histogram peak and then march in both directions until only a small number of pixel intensities are rejected. These boundary points are then used as the dynamic range of the input. The percentile scheme is outlined in Algorithm 3-2.
Algorithm 3-2: Adaptive Contrast Stretch
INPUT: q-bit image I, percentile range plo and phi)
MATLAB Implementation
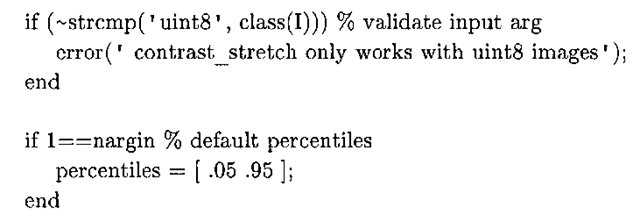
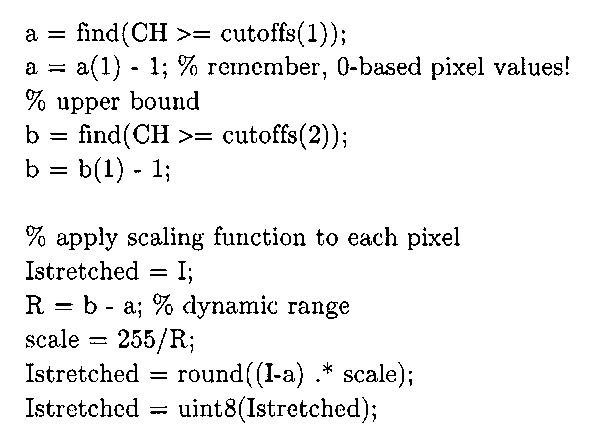
A MATLAB implementation of Algorithm 3-2, with parameterized percentile inputs, is given in Listing 3-1. This M-file does not use any functions from the Image Processing Toolbox.
Listing 3-1: contrast_stretch.m
function Istretched = contrast_stretch(I, percentiles)
N = length(I(:));
% total # of pixels
I = double(I);
% many MATLAB functions don’t work with uint8 H = histc(I(:), 0:255);
% image histogram
% find the 2 bins that correspond to the specified percentiles cutoffs = round (percentiles .* N); CH = cumsum(H);
% lower bound
Figure 3-7 demonstrates the effectiveness of this more robust algorithm, using the same corrupted chest x-ray image from Figure 3-6a. This image’s first pixel is completely saturated, simulating the situation of a detector in an x-ray camera failing to collect charge. Applying Algorithm 3-1 fails to yield an improved image, as illustrated in Figure 3-6b. However, the improved algorithm, using the default percentiles (5% and 95%) in Listing 3-1, does manage to return an enhanced image, albeit at the cost of some bony structure near the patient’s ribs.
Displaying contrast enhanced gray-scale images using the Image Processing Toolbox is extremely easy. Assuming that the variable I refers to an image matrix, the following MATLAB command can be used to display a stretched image:
Note that MATLAB assumes all pixel values are normalized to lie within the range [0, 1] if I is of type double. For integer "classes" (MATLAB parlance for data types) such as uint8, uintl6, and so on, the range is defined to be [0, 2bpp-l]. For uint8, bpp is 8 and for uintl6, bpp is 16. The imshow command only displays the contrast-stretched image; it does not modify the pixels. To actually apply the scaling function to the pixel values, you can use the Image Processing Toolbox functions stretchlim and imadjust, as so:
The stretchlim function can be used to determine the limits for contrast stretching an image (variables a and b in Algorithms 3-1 and 3-2). The imadj ust function adjusts the pixel intensities by applying a scaling function, mapping pixel values specified by the second input argument to the pixel values specified by the third input argument, stretchlim (I) returns an array with the minimum and maximum pixels in I, and if the third argument is empty, imadj ust defaults to [ 0 1].
Figure 3-7. Adaptive contrast-stretching algorithm, (a) Corrupted low-contrast x-ray image, (b) Result from applying algorithm 3.1. (c) Result from MATLAB adaptive contrast stretching function, an implementation of Algorithm 3-2.
So the above MATLAB statement maps the minimum pixel value to 0, and the maximum pixel value to the largest possible intensity the image can take on (255 for uint8, 65536 for uintl6, and 1.0 for double) – in other words Algorithm 3-1.
TI C67xx Implementation and MATLAB Support Files
One of the many challenges when developing embedded systems is getting test data into the system. This problem is particularly acute with image processing applications, as the sheer size of the input data oftentimes precludes certain methods like compiling data directly into the executable (e.g. directly initializing an array containing the image pixels). In our first C6x implementation, we use some of Code Composer Studio’s built-in file I/O facilities to bring image data into our program and also to save the processed data. While CCStudio does provide traditional C file I/O functionality through its standard C library, like fopen, fwrite, and their ilk, these functions are so terribly slow that it is not viable to use them for transferring even moderate amounts of data. This section describes how to use one such means of circumventing the standard C library – subsequent topics describe the usage of other technologies, including Real-Time Data Exchange (RTDX) and High-Performance Interface (HPI).
On the CD-ROM in the Chap3\contrast_stretch directory is a project named, appropriately enough, contrast_stretch.pjt. This project can be used as a template for other simple EVM projects, as it is about as bare bones as a CCStudio project can be, consisting of just a "linker command" (. cmd) file and a single C source file. The project does not utilize any DSP/BIOS facilities, and links to four other libraries: the runtime support library (rts6701. lib), image processing library (img62x. lib), peripheral support library (dev6x.lib), and driver library (drv6x. lib).
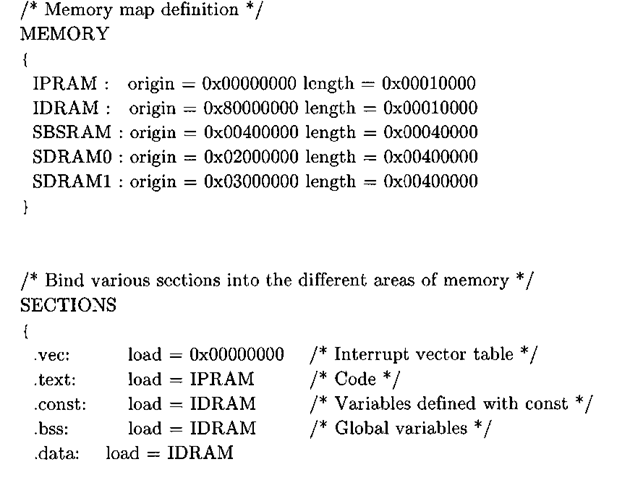
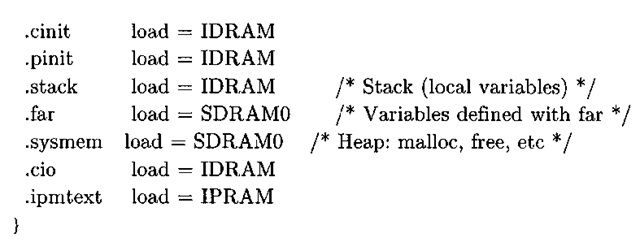
The linker command file, contrast_stretch.cmd, is shown in Listing 3-2. This file contains directives for the TI linker, and serves a few purposes. If the project uses DSP/BIOS, then the CCStudio configuration tool creates this file automatically, and the developer should not manually modify it. However, since this application does not utilize DSP/BIOS, a hand-crafted linker file is necessary.
Listing 3-2: C6701 EVM linker command file.
The memory section of the linker command file delineates the memory map, and the nominal values for the location and size of the memory banks come directly from the documentation1’2. The first two memory sections, the internal program RAM (i pram) and internal data RAM (idram), are located on the chip, while the last three sections define off-chip memory segments accessed via the external memory interface (EMIF) controller. For this example, we will be using the synchronous burst static RAM (sbsram) to store buffers that do not fit in internal RAM. The section part of the linker file binds different sections of the program to the memory sections previously mentioned.
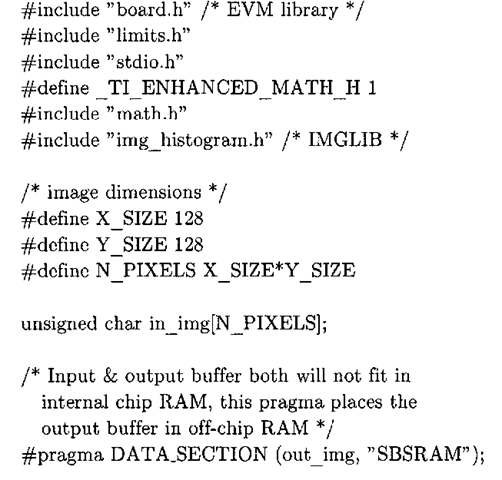
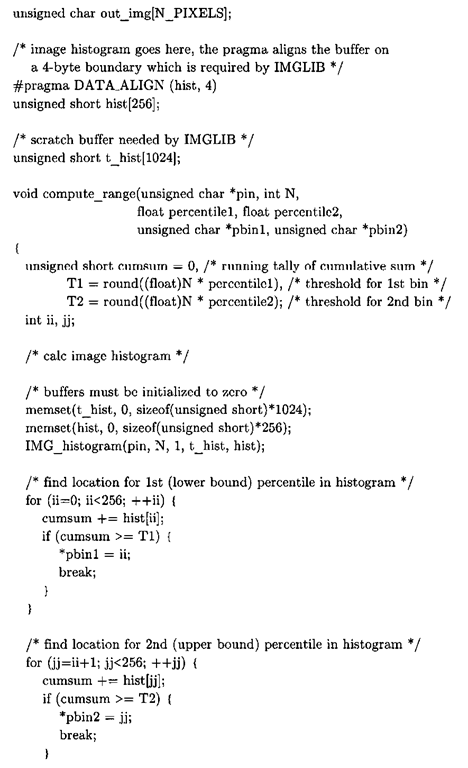
Listing 3-3 is the full contents of the main source module for this project, contrast_stretch. c. This C program is a direct port of the MATLAB function given in Listing 3-1.
Listing 3-3: contrast_stretch. c
The program uses flattened arrays to store images, an idiom employed in most of the other C and C++ examples presented in this topic. As explained in 1.5, in contrast to the MATLAB convention of storing 2D data in column-major format, in C this data is stored in row-major format. Therefore, indexing into a flattened image buffer requires an understanding of some basic pointer arithmetic. To access a pixel at row i and column j of an image with N columns, the following statement is used:
The image dimensions for this project are hard-coded to 128×128. Due to the size of the resultant image buffers, not all of the image data fits in internal RAM. The DATA_SECTION pragma, or compiler directive, tells CCStudio to allocate space for the symbol in the specified section, which in the case of out_img is the SBSRAM, or external RAM, portion of the memory map. The linker must know about the specified memory bank, so either the hand-crafted linker command file contains the requisite definitions or in the case of DSP/BIOS, the memory segment must be configured appropriately through the IDE.
There are two other global buffers, both of which are used for computing the histogram of the image. The IMGLIB function IMG_histogram requires two buffers: one to contain the histogram bin counts upon return (hist), and another temporary scratch buffer of length 1024 (t_hist). Moreover, the documentation3’4 states that the histogram buffer must be aligned on a 4-byte boundary, which is specified in the source code via the DATA_ALIGN pragma.
All of the grunt work is performed within two functions: compute_range and contrast_stretch. The compute_range function starts by calculating the discrete PDF of the image data via IMG_histogram. IMG_histogram is used in lieu of a C-coded histogram function for performance reasons – all of the IMGLIB functions are heavily optimized and will offer better performance metrics than C code. The next step is to use the discrete PDF to compute bounds of the linear scaling function that stretches the contrast of the image. To that end, we use the cumulative distribution function (CDF). The CDF is closely related to the probability density function; simply put, the CDF of a random variable (in this case the set of pixel values in the input image) is a nondecreasing function yielding the probability that a random variable (pixel intensity) takes on a value less than or equal to some number. This code stores the current value of the CDF in cumsum, and in conjunction with the specified percentile ranges calculates the lower and upper bounds needed to stretch the histogram. Finally, contrast_stretch, which initially invoked compute_range, uses the returned bounds a and b to apply the scaling function to each image pixel.
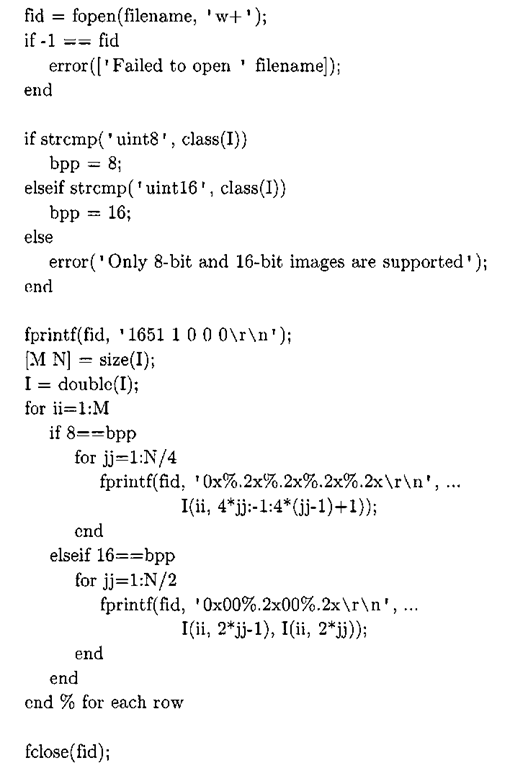
To test the program, we need to first load pixel data onto the DSP and then extract the processed image data. To do this, we will use the data I/O facilities of CCStudio to send a block of image data stored in a text file located on the host directly into a memory location on the target (EVM). The MATLAB function save_ccs_data_file, shown in Listing 3-4, generates an ASCII text file from an image matrix that can be used by CCS to import data into the DSP5.
Listing 3-4: MATLAB function to save image matrix to CCS data file.
function save_ccs_data_file(I, filename)
The CCStudio file format dictates that each line contains a single word (32 bits) of data. The save_ccs_data_f ile function supports both 8-bit (uint8) and 16-bit (uintl6) pixel formats. The in img buffer in the EVM program is defined as an array of unsigned chars, so to use save_ccs_data_file to generate an input file for use with the EVM program, the string ‘uint8′ should be passed in as the second argument. Since each word consists of four bytes (32 bits), each line in the output text file contains four pixels worth of data.
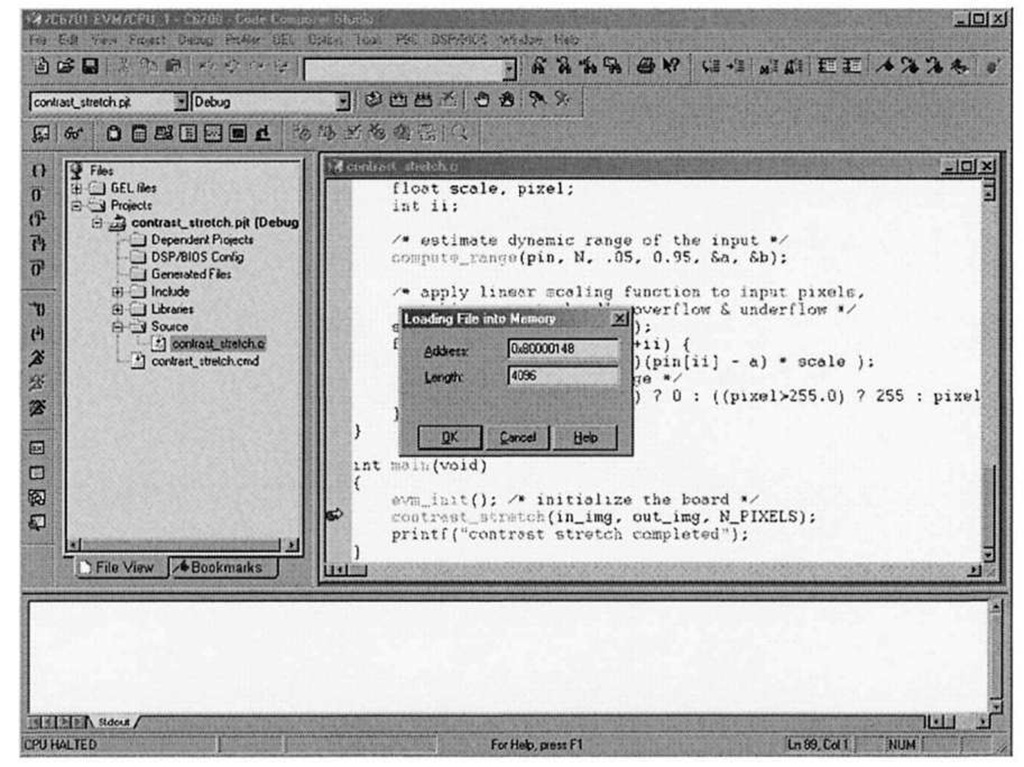
Figure 3-8. Code Composer Studio File|Load facility. After typing in.img for the address, CCStudio automatically replaces the string with the actual address. Notice the address maps to the SBSRAM portion of the memory map defined by the linker command file.
The function assumes little-endian ordering - that is, bytes are numbered from right to left within a word, with the more significant bytes in a word having a larger address. The C6x architecture is unique in that it is bi-endian, meaning that depending on the build options it can be either little or big endian. In order for save_ccs_data_file to work correctly, the build options for the project must be set to little endian (which is the default setting). A sample data file with the corrupted x-ray image pixels from Figure 3-6a can be found in the project directory under the name xray.dat, and this input data is used in the following screen captures to illustrate the usage of the program.
After building the project and loading the executable program onto the DSP, set a breakpoint in main where contrast stretch is called. Upon running the program, the debugger will stop at this line. By using the File|Data|Load menu item, we can send a block of data to the DSP, given a CCStudio data file containing the raw data, the memory address of where to place the block of data, and the length of that data block.
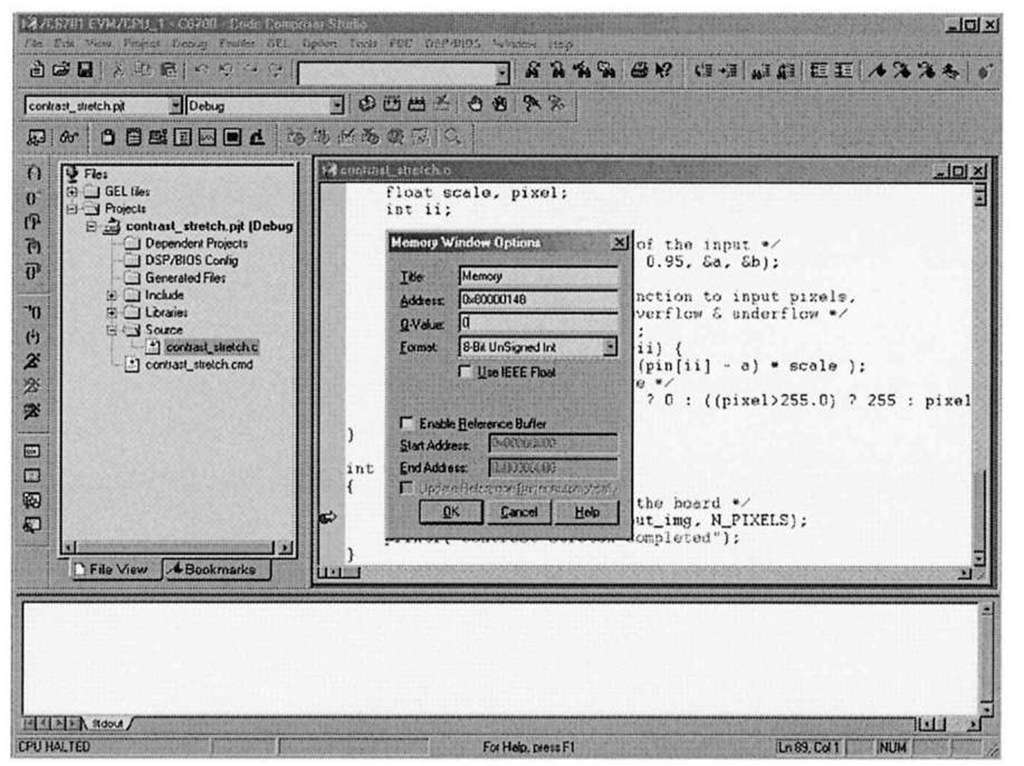
Figure 3-9. Code Composer Studio view memory configuration. As in the case with the File I/O dialog, CCStudio automatically replaces in_img with the actual address.
When the "Load Data" dialog comes up, choose the "Hex" file format, as this is the format that save ccs data f ile uses when it formats the input data. The next dialog allows the user to specify where in memory the data should be placed, by asking for the destination memory address and data length. Figure 3-8 is a CCStudio screen capture illustrating how to send image data into the in_img array, assuming an image with dimensions 128×128. Since each word contains four bytes, the data file actually contains 128×128/4 = 4096 elements.
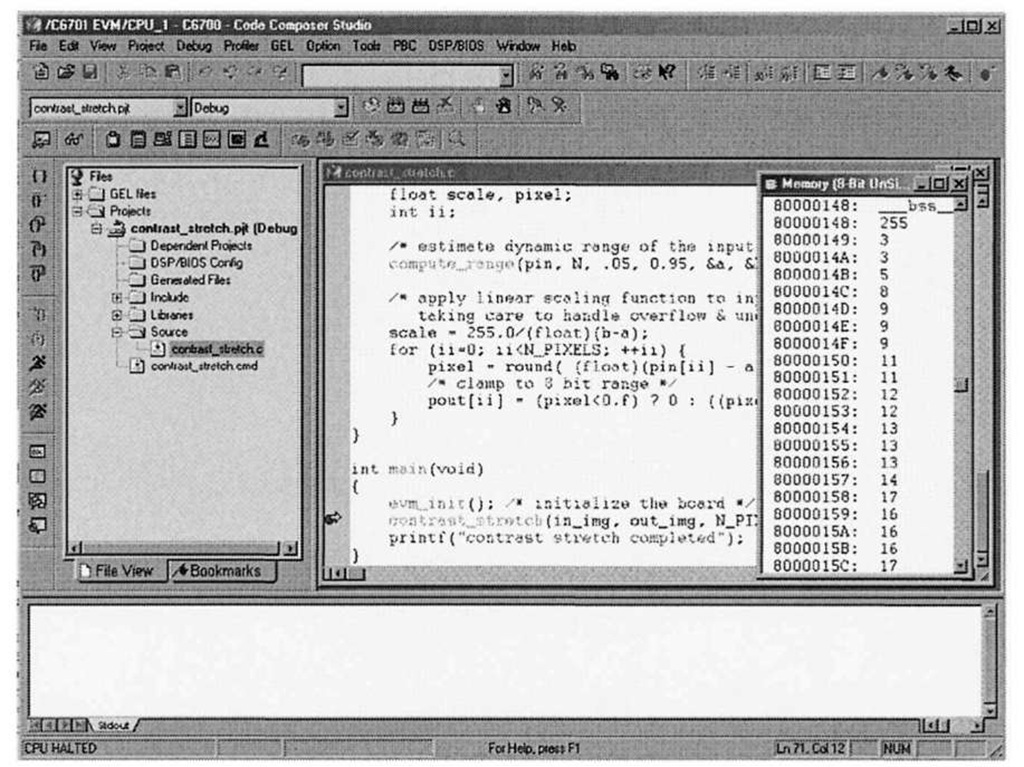
You can verify that the pixel data transferred correctly into the in_img array by using one the most helpful debug facilities offered by the CCStudio IDE – the ability to peer into memory and display array data in a large variety of formats. Selecting View|Memory brings up the dialog box shown in Figure 3-9. Figure 3-10 shows what happens after setting the memory window options to display the contents of in img in an 8-bit unsigned integer format. Note that the first pixel value is 255, corresponding to the top-left corrupted pixel from Figure 3-6a. The CCStudio memory viewer is an important debugging tool in your arsenal – it is far easier to inspect the contents of data arrays in this type of block format, as opposed to the "quick watch" option, which is more geared towards examination of scalar variables. In fact, one can visualize image data directly within CCStudio, as we shall see in 4.3.1.
Figure 3-10. Contents of in_img input buffer. The corrupted x-ray image from Figure 3-6a was used as input data, and the first value in the array reflects the obvious outlier pixel intensity (255).
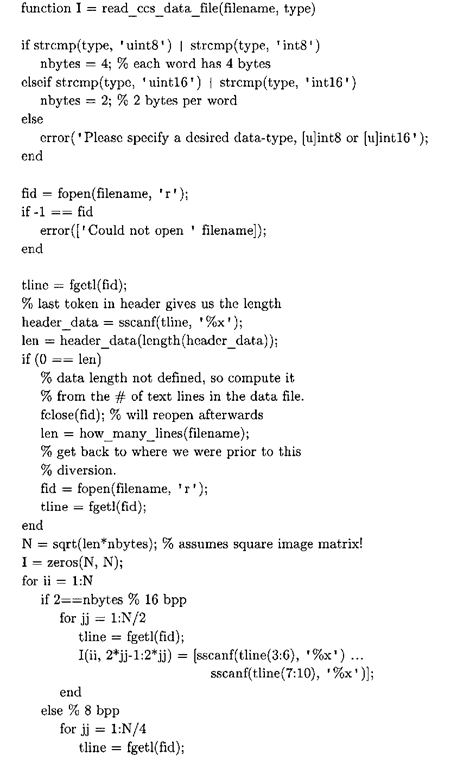
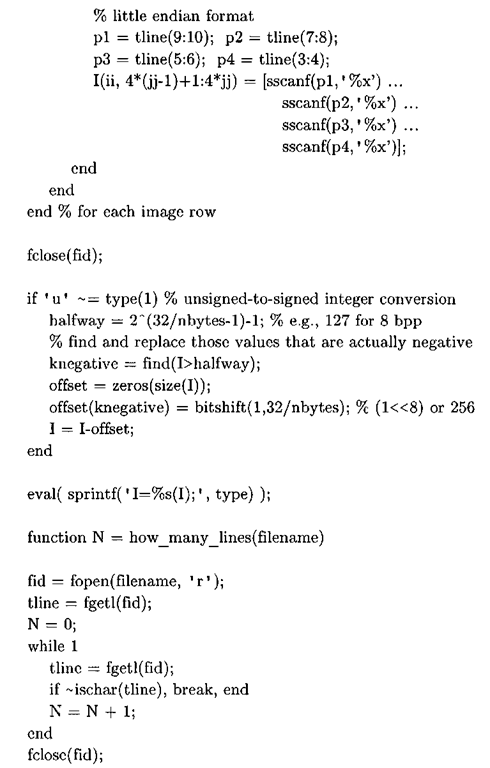
By stepping over contrast_stretch in the debugger we execute the function and proceed to process the image. Upon return, we can save the contrast stretched image data to a file on the host machine using the File|Data|Save menu selection. Specify the memory address as out img and the length as 4096. The MATLAB function read_ccs_data_file, shown in Listing 3-5, can then be used to parse this CCStudio data file (hex format) and resize the data into an image matrix. This matrix can then be viewed using standard MATLAB commands like imagesc, image, or imshow.
Listing 3-5: read ccs data file.m
The read_ccs_data_file function supports both signed and unsigned 8 or 16 bit integer formats, and is specified in the second argument (type). This M-file actually consists of two functions: the main entry function read_ccs_data_f ile, and a MATLAB subfunction how_many_lines. Subfunctions may only be called from functions residing in the same M-file, and there can be multiple subfunctions within a single M-file. In this fashion, MATLAB subfunctions are reminiscent of static functions in the C language, where functions marked with the static keyword are only visible to those functions residing in the same C file, or more strictly speaking, the same translation unit.
More interesting to the implementation of read_ccs_data_f ile is the use of MATLAB’s eval facility at the tail end of the function to perform double-to-integer and unsigned-to-signed data conversion. The built-in eval function offers incredible convenience and takes advantage of the MATLAB interpreter to execute a string containing a MATLAB expression. It is used in a variety of contexts, for instance as a quasi function pointer or to condense C-style switch statements or long if-then-else blocks into a single line of code. For example, in read_ccs_data_f ile, the statement
evaluates to one of:
• I = uint8(I); % double to unsigned 8-bit integer conversion
• I = int8(I); % double to signed 8-bit integer conversion
• I = uintl6(I); % double to unsigned 16-bit integer conversion
• I = intl6(I); % double to signed 16-bit integer conversion depending on the value of type.
