In this topic, the focus shifts to image analysis, which in some respects is a more difficult problem. Image analysis algorithms draw on information present within an image, or group of images, to extract properties about the scene being imaged. For example, in machine vision applications, images are analyzed to oftentimes determine the orientation of objects within the scene in order to send feedback to a robotic system. In medical imaging registration systems, radiographs, or slices from 3D volumes, are analyzed or fused together by a computerized system to glean information that a clinician or medical device may be interested in, such as the presence of tumors or the location and orientation of anatomical landmarks. In military tracking systems, interest lies in identifying targets, such landmarks, enemy combatants, etc. There are many other real-world applications where image analysis plays a large role.
Generally speaking, image analysis boils down to image segmentation, where the goal is to isolate those parts of the image that constitute objects or areas of interest. Once such objects or regions have been separated from the image, various characteristics (e.g. center-of-mass or area) can be computed and used towards a particular application. Many of these algorithms utilize various heuristics and localized domain knowledge to help steer the image processing algorithms to a desired solution, and therefore it is essential for the practitioner to be well-grounded in the basics. Universally applicable image segmentation techniques general enough to be used "straight out of the box" do not exist – it is almost always the case that the basic algorithms must be tweaked so as to get them to work robustly within a particular environment. In this topic we discuss some of the basic algorithms that aid in the segmentation problem. First, the topic of edge detection is introduced, and an interactive embedded implementation featuring real-time data transfer between a host PC and embedded target is provided. After an initial exploration of classical edge-detection techniques,we move on to image segmentation proper, and in turn will use some of these algorithms to develop a more flexible and generalized classical edge detector.
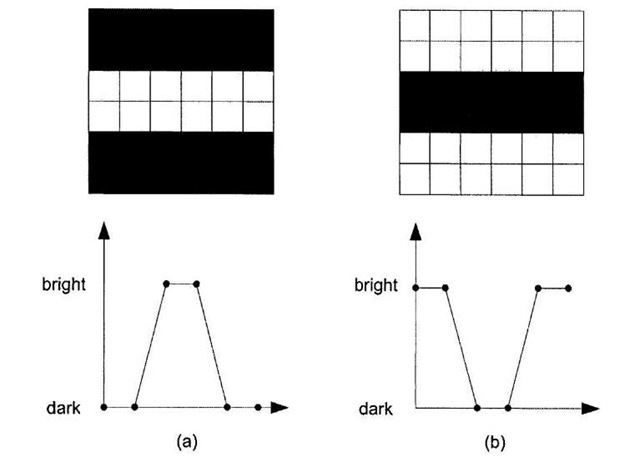
In a monochrome image, an edge is defined as the border between two regions where large changes in intensity occur, as shown in Figure 5-1. An input image may be edge enhanced, meaning which the image is processed so that non-edges are culled out of the input, and edge contours made more pronounced at the expense of more constant areas of the image. A more interesting problem is that of edge detection, whereby an image processing system autonomously demarcates those portions of the image representing edges in the scene by first edge enhancing the input and subsequently utilizing a thresholding scheme to binarize the output.
From Figure 5-1 it is apparent that the key to detecting edges is robustly locating abrupt changes in such intensity profiles. Thus it is not terribly surprising that edge enhancement filters are predicated on the idea of utilizing local derivative or gradient operators. The derivative of the intensity profile from a scan-line of an image is non-zero wherever a change in intensity level occurs, and zero wherever the image is of constant intensity. The gradient of an image V/ at location (x,y) is
where Gx and Gy are the partial derivatives in the x and y directions, respectively. Discrete gradients are approximated with finite differences, i.e.
Given this approximation, the convolution kernel that produces the above central first difference is then [1 0-1]. This kernel yields a response for vertical edges.
Figure 5-1. Vertical edges in simulated digital image, (a) Intensity profile of a vertical line through a white stripe on a dark background, (b) Intensity profile of a vertical line through a dark stripe on a white background.
Figure 5-2. Derivative of scan-line through house image, (a) Dashed line indicates the horizontal scan-line plotted in this figure, (b) Intensity profile of the scan-line, plotted as a function of horizontal pixel location. The abrupt change in intensity levels at around pixel locations 50 and 90 are the sharp edges from both sides of the chimney, (c) Numerical derivative of this intensity profile, obtained using central first differences. This signal can be obtained by convolving the intensity profile with [1 0-1], and the sharp peaks used to gauge the location of the edges.
The transposition of this kernel gives an approximation to the gradient in the orthogonal direction, and produces a response to horizontal edges:
An example of how these gradient kernels operate is shown in Figure 5-2. In this example, a scan-line from a row of an image is plotted in 5-2b, and the gradient of this signal (which in one dimension is simply the first derivative) is shown in Figure 5-2c. Note that the gradient exhibits distinct peaks where the edges in this particular scan-line occur. Edge detection could then be achieved by thresholding – that is, if![]() , mark that location as an edge pixel. Extending the central first difference gradient kernel to a 3×3 (or larger) size has the desirable result of reducing the effects of noise (due to single outlier pixels), and leads to the Prewitt edge enhancement kernel:
, mark that location as an edge pixel. Extending the central first difference gradient kernel to a 3×3 (or larger) size has the desirable result of reducing the effects of noise (due to single outlier pixels), and leads to the Prewitt edge enhancement kernel:
Gx approximates a horizontal gradient and emphasizes vertical edges, while Gy approximates a vertical gradient and emphasizes horizontal edges. The more widely used Sobel kernels are weighted versions of the Prewitt kernels:
The Sobel edge enhancement filter has the advantage of providing differencing (which gives the edge response) and smoothing (which reduces noise) concurrently. This is a major benefit, because image differentiation acts as a high-pass filter that amplifies high-frequency noise. The Sobel kernel limits this undesirable behavior by summing three spatially separate discrete approximations to the derivative, and weighting the central one more than the other two. Convolving these spatial masks with an image, in the manner described in 4.1, provides finite-differences approximations of the orthogonal gradient vectors Gx and Gy. The magnitude of the gradient, denoted by![]() is then calculated by
is then calculated by
A commonly used approximation to the above expression uses the absolute value of the gradients Gx and Gy:
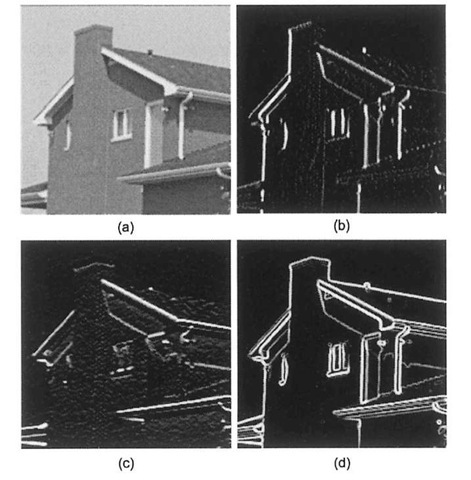
This approximation, although less accurate, finds extensive use in embedded implementations because the square root operation is extremely expensive. Many DSPs, the TI C6x included, have specialized instructions for obtaining the absolute value of a number, and thus this gradient magnitude approximation becomes that much more appealing for a DSP-based implementation. Figure 5-3 shows how to apply the Sobel filter to an image. The process is exactly the same for the Prewitt filter, except that one substitutes different convolution kernels. The input image is passed through both Sobel kernels, producing two images consisting of the vertical and horizontal edge responses, as shown in 5-3b and 5-3c. The gradient image V/ is then formed by combining the two responses using either of the two aforementioned formulas (in this case the square root of the sum of the squares of both responses is used). Edge detection is then accomplished by extending the one-dimension thresholding scheme to two dimensions:
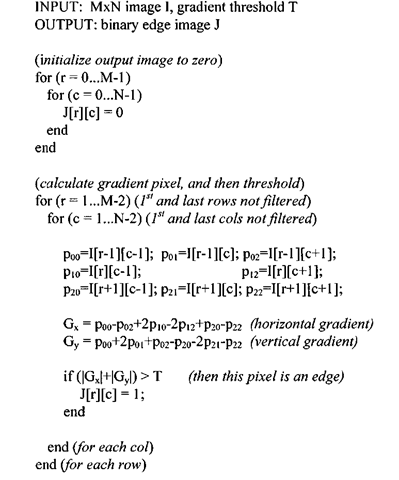
where T may be user-specified or determined through some other means (see 5.2.2 for techniques for automatically determining the value of T). Algorithm 5-1 describes a Sobel-based edge detection algorithm, which we shall port to the DSP at the end of 5.1.2.2.
Figure 5-3. 2D edge enhancement using the Sobel filters. Edge response images are scaled and contrast-stretched for 8-bit dynamic range, (a) House input image, (b) Gx image, the vertical edge response, (c) Gy image, the horizontal edge response, (d) Combined edge image,![]()
Figure 5-4. Using the second-order derivative as an edge detector, (a) A fictionalized profile, with edges at locations 10 and 20. (b) Numerical lst-order derivative, obtained by convolving the profile with [1 0 -1], (c) The second-order derivative, obtained by convolving the lst-order derivative with [1 0-1], The zero-crossings, highlighted by the arrows, give the location of both edges.
Algorithm 5-1: 3×3 Sobel Edge Detector
There are a multitude of other edge enhancement filters. The Prewitt and Sobel gradient operators work well on images with sharp edges, such as those one might encounter in industrial applications where the lighting and overall imaging environment is tightly controlled, as opposed to say, military tracking or space imaging applications. However, such filters tend not to work as well with "natural" images that are more continuous in nature and where edge transitions are more nuanced and gradual. In these cases the second-order derivative can sometimes be used as a more robust edge detector. Figure 5-4 illustrates the situation graphically – here the zero-crossings in the second derivative provide the edge locations. One distinct advantage to these types of edge detection schemes is that they do not rely on a threshold to separate the edge pixels from the rest of the image.
To implement a zero-crossing based edge detector, we need the second-order derivative of a 2D function, which is given by the Laplachian:
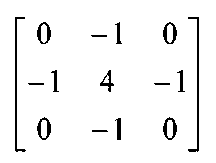
Several discrete approximations to the 2D Laplachian, in the form of spatial filter kernels, exist. One of the more common is
This particular filter is appealing because of the presence of the zeroes within the kernel, as the output pixel g(i,j) is
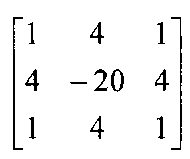
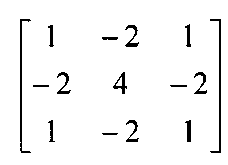
In contrast, some of the other Laplachian approximations include more dense spatial kernels, such as
and
Even though the Laplachian method has the advantage of not requiring a threshold in order to produce a binary edge image, it suffers from a glaring susceptibility to image noise. The presence of any noise within the image is the cause of a fair amount of "streaking", a situation where extraneous edges consisting of a few pixels obfuscate the output. This type of noisy output can be countered somewhat by smoothing the image prior to differentiating it with the 2D Laplachian (a pre-processing step also recommended with the Sobel and Prewitt filters), and then applying sophisticated morphological image processing operations to filter out the edge response (for example, using a connected-components algorithm to throw away single points or small bunches of pixels not belonging to a contour). Yet at the end of the day, all of this processing usually does not lead to a robust solution, especially if the imaging environment is not tightly controlled. The Canny edge detector was designed to circumvent these problems and in many respects is the optimal classical edge detector. Compared to the edge detectors described thus far, it is a more complex and sophisticated algorithm that heavily processes the image and then dynamically selects a threshold based on the local properties of the image in an attempt to return only the true edges. The Canny edge detector proceeds in a series of stages’:
1. The input image is low-pass filtered with a Gaussian kernel. This smoothing stage serves to suppress noise, and in fact most edge detection systems utilize some form of smoothing as a pre-processing step.
2. The gradient images Gx and Gy are obtained using the Sobel operators as defined previously. The magnitude of the gradient is then calculated, perhaps using the absolute value approximation (|G| = | Gx | + Gy |).
3. The direction of the individual gradient vectors, with respect to the x-axis, is found using the formula 0 = tan"’(G/G*). In the event that Gx = 0, a special case must be taken into account and 0 is then either set to 0 or 90, as determined by inspecting the value of Gy at that particular pixel location. These direction vectors are then typically quantized into a set of eight possible directions (e.g. 0°, 45°, 90°, 135°, 180°, 225°, 315°).
4. Using the edge directions from (3), the resultant edges are "thinned" via a process known as non-maximal suppression. Those gradient values that are not local maxima are flagged as non-edge pixels and set to zero.
5. Spurious edges are removed through a process known as hysteresis thresholding. Two thresholds are used to track edges in the non-maxima suppressed gradient. In essence, edge contours are created by traversing along an edge until the gradient dips below a threshold.
The Intel IPP library includes a function ippiCanny_16s8u_ClR in its computer vision component that performs Canny edge detection. In addition, the library includes a variety of other derivative-based edge detectors, such as the 3×3 Sobel and Laplachian2.
Edge Detection in MATLAB
The Image Processing Toolbox includes a suite of edge detectors through its edge function. This functionality allows one to specify any of the derivative filters discussed in the preceding section, as well as a few other variants on the general theme. The edge function accepts an intensity image and returns a MATLAB binary image, where pixel values of 1 indicate where the detector located an edge and 0 otherwise. An interactive demonstration of The Math Works Image Processing Toolbox edge detection algorithms can be accessed via the edgedemo application.
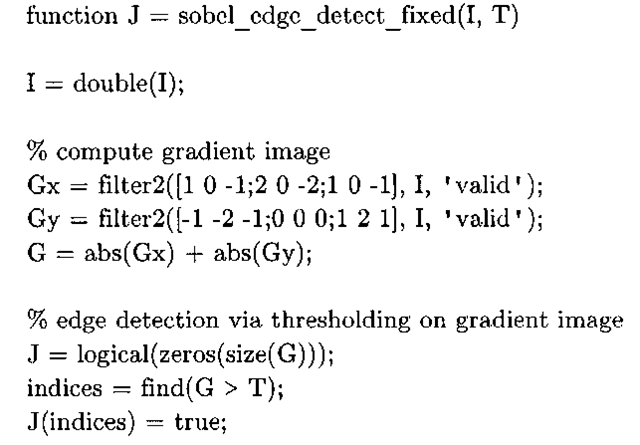
Listing 5-1 is a port of Algorithm 5-1 that does not rely on any Image Processing Toolbox functions. The built-in MATLAB function f ilter2 is used to form the vertical and horizontal edge responses by convolving the input with the two Sobel kernels, and the gradient image is then computed using the absolute value approximation. The MATLAB statement
creates a MATLAB binary matrix and initializes all matrix elements to false or zero. A simple thresholding scheme is then used to toggle (i.e. set to 1) those pixel locations found to be edges.
Listing 5-1: MATLAB Sobel edge detection function.
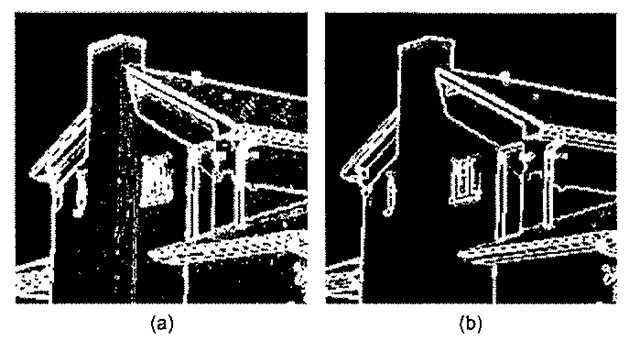
The call to sobel_edge_detect_fixed in an industrial-strength system would more than likely be preceded by a low-pass filtering step. However, in actuality Listing 5-1 is not suitable for a real application, as it is incumbent upon the client to provide the threshold value that obviously plays a large role in determining the output (see Figure 5-5). Unless the image is known to be high-contrast and the lighting conditions are known and stable, it is difficult for any client of this function to provide a meaningful threshold value. The Image Processing Toolbox edge function circumvents this problem by employing a technique for estimating a threshold value described by Pratt4.
Figure 5-5. The effect of choosing different thresholds for use with sobel_edge_detect_f ixed on the house image, (a) Binary image returned using a threshold of 50, clearly exhibiting the presence of noisy edges within the interior of the house, (b) A much cleaner binary edge image, obtained with a threshold value of 100.
This technique uses an RMS estimate of the noise in the input to generate a threshold value. In 5.2.5.1, we enhance the Sobel edge detector in Listing 5-1 with additional functionality for automatically determining an appropriate threshold.
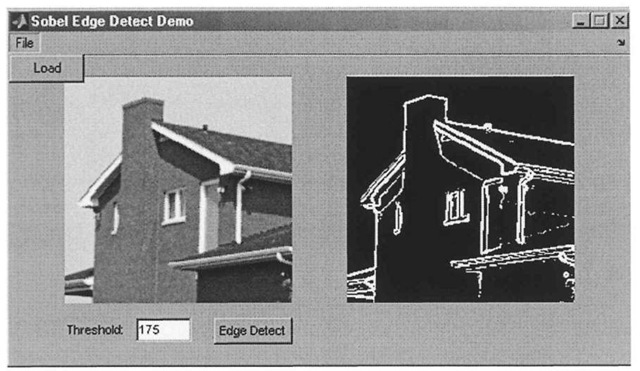
Until now, all of the MATLAB code presented has been in the form of functions residing in M-files. A MATLAB GUI application, modeled after edgedemo, can be found in the Chap5\edge\SobelDemo directory on the CD-ROM. This application was built with the MATLAB R14 GUIDE user-interface designer tool5. The motivation behind developing and explaining this application is not to wax poetic about developing GUIs in MATLAB (although this functionality is extremely well done and quite powerful), but to introduce a starting point for an image processing front-end that will eventually be augmented with the capability of communicating with a TI DSP using Real-Time Data Exchange (RTDX) technology. Figure 5-6 is a screen-shot of the application. The user imports an image into the application, enters the threshold value used to binarize the processed image, and finally calls sobel_edge_detect_fixed to run Sobel edge detection on the image and display the output. If the input image is a color image, it is converted to gray-scale prior to edge-detection. All code that implements the described functionality does not rely on anything from the Image Processing Toolbox, which is important for two reasons:
1. If the toolbox is not available, obviously an application using such functionality would not be very useful!
2. For Release 13 users, a MATLAB application that uses toolbox functions cannot be compiled via mcc (the MATLAB compiler6), to a native application that can be run on a machine without MATLAB installed.
With Release 14 of MATLAB, this restriction has been lifted.
Since this application has no dependencies on the Image Processing Toolbox, it does not use imshow, which for all intents and purposes can be replaced with the built-in MATLAB image function. The application uses a MEX-file, import_grayscale_image.dll, in lieu of the MATLAB imread function. This DLL serves as a gentle introduction to the topic MEX-file creation.Like most interpreted languages, MATLAB supports the idea of a plug-in architecture, where the developer can implement their own custom commands and hook them into the language. In the MATLAB environment, this facility is provided via such MEX-files. The MATLAB statement
is roughly equivalent to
except that import_grayscale_image automatically converts RGB color images to grayscale (8 bpp) and only supports a few color formats.
Figure 5-6. The MATLAB SobelEdge demo application.
This MEX-file uses the GDI+ library to parse and read in image files. However its usage is so similar to that of imread that if desired, imread can be used instead.
GUIDE creates an M-file and associated MATLAB figure (.fig) file for each user-defined dialog. This application, since it consists of a single dialog, is made up of three files: SobelDemo. fig, SobelDemo .m, and sobel_edge_detect_fixed .m. The figure file SobelDemo. fig contains information about the layout of the user interface components. The M-file Sobel Demo, m has the actual code that provides the functionality for the GUI. To run the application, call the GUI entry-point function by typing SobelDemo at the MATLAB command-line prompt. Most of the implementation is created automatically by GUIDE, similar to how the Microsoft wizards in Visual Studio generate most of the glue code that give a GUI its innate functionality. The pertinent portions of SobelDemo .m are two callback functions, shown in listing 5-2.
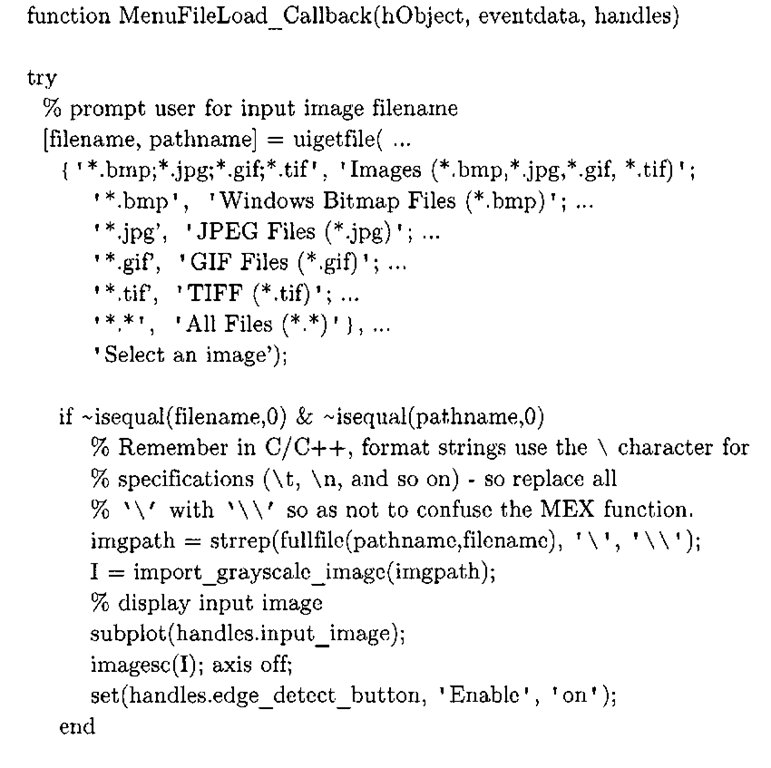
Listing 5-2: SobelDemo.m callback functions.
% get pointer to image data – could just have easily created another
% field in the handles struct, but since it is held by a child
% of the axes object, in the interest of reducing clutter I access
% it this way.
% get pointer to image data – could just have easily created another
% field in the handles struct, but since it is held by a child
% of the axes object, in the interest of reducing clutter I access
% it this way.
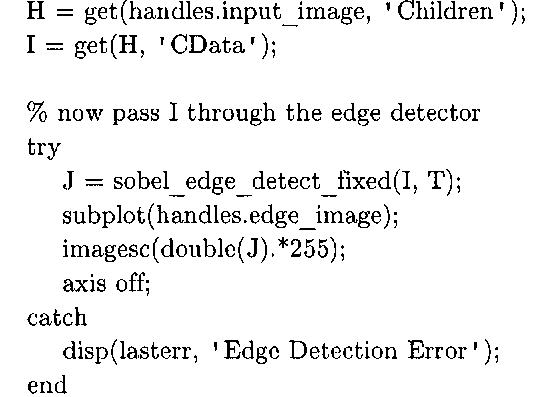
The first MATLAB subfunction in Listing 5-2 gets executed when the user selects the File|Load menu item, and the second subfunction gets called when the user clicks the button labeled "Edge Detect". MenuFileLoadCallback uses the built-in MATLAB function uigetfile to bring up a dialog prompting the user for the filename, and then uses import_grayscale_image to read the user-specified image file. After reading the image file, it then uses image to display the input in the left display. In edge_detect_button_Callback, the input pixel data is extracted from the left image display, and subsequently handed off for processing to sobel_edge_detect_fixed. Lastly, the processed binary output is shown in the right display.
The vast majority of the MATLAB code in this topic should run just fine in Release 14 and Release 13 of MATLAB, and quite possibly earlier versions as well, although this has not been verified. However, this statement no longer holds true with applications built using GUIDE. Attempting to execute Sobel Demo from MATLAB R13 results in an error emanating from the SobelDemo. fig figure file, therefore readers using older versions of MATLAB should recreate the dialog shown in Figure 5-6 using the older version of GUIDE.
If the MATLAB compiler (mcc) is available, this GUI application can be compiled to a native executable which can be run like any other program, outside of the MATLAB environment and even on computers that do not have MATLAB installed. These PCs will still need the MATLAB runtime redistributables, however – consult the MATLAB documentation for further details. The Release 14 command to compile SobelDemo.m and create a Windows executable SobelDemo. exe is
Under MATLAB R13 the correct command is


![Derivative of scan-line through house image, (a) Dashed line indicates the horizontal scan-line plotted in this figure, (b) Intensity profile of the scan-line, plotted as a function of horizontal pixel location. The abrupt change in intensity levels at around pixel locations 50 and 90 are the sharp edges from both sides of the chimney, (c) Numerical derivative of this intensity profile, obtained using central first differences. This signal can be obtained by convolving the intensity profile with [1 0-1], and the sharp peaks used to gauge the location of the edges. Derivative of scan-line through house image, (a) Dashed line indicates the horizontal scan-line plotted in this figure, (b) Intensity profile of the scan-line, plotted as a function of horizontal pixel location. The abrupt change in intensity levels at around pixel locations 50 and 90 are the sharp edges from both sides of the chimney, (c) Numerical derivative of this intensity profile, obtained using central first differences. This signal can be obtained by convolving the intensity profile with [1 0-1], and the sharp peaks used to gauge the location of the edges.](http://what-when-how.com/wp-content/uploads/2011/09/tmp17F35_thumb_thumb.jpg)


![Using the second-order derivative as an edge detector, (a) A fictionalized profile, with edges at locations 10 and 20. (b) Numerical lst-order derivative, obtained by convolving the profile with [1 0 -1], (c) The second-order derivative, obtained by convolving the lst-order derivative with [1 0-1], The zero-crossings, highlighted by the arrows, give the location of both edges. Using the second-order derivative as an edge detector, (a) A fictionalized profile, with edges at locations 10 and 20. (b) Numerical lst-order derivative, obtained by convolving the profile with [1 0 -1], (c) The second-order derivative, obtained by convolving the lst-order derivative with [1 0-1], The zero-crossings, highlighted by the arrows, give the location of both edges.](http://what-when-how.com/wp-content/uploads/2011/09/tmp17F50_thumb_thumb.jpg)
