The wave theory of EM radiation (and light) explains a great deal about phenomena we observe in physics, but at the turn of the 20th century, it became obvious that a different perspective was needed to explain some of the interactions of light and matter—in particular, processes such as the photoelectric effect (and similar processes important for detection of light). The inadequacy of the wave theory led to a resurgence of the idea that light, or electromagnetic radiation, might better be thought of as particles, dubbed photons. The energy of a photon is given by
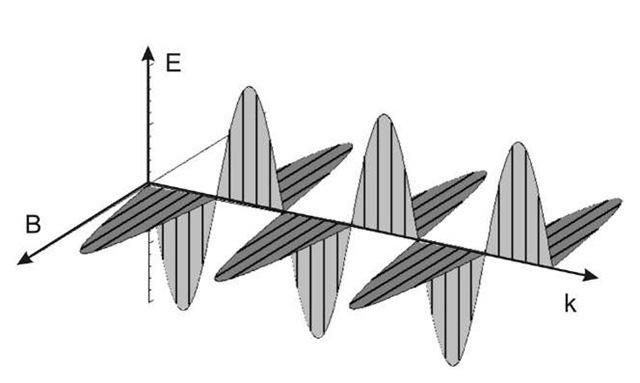
Figure 2.2 Polarization in an electromagnetic wave. Note that the electric field is perpendicular to the magnetic field (E±B), and both are perpendicular to the direction of propagation k. Following a typical convention, E is in the x direction, B is in the y direction, and the wave is propagating in the z direction. This same convention is used in Eq. 2.3.
where f = frequency of the EM wave (in Hz), and
The electron-volt (eV) is a convenient unit of energy related to the standard metric unit (Joule) by the relation 1 eV = 1.602 x 10 19 Joules. Note that the conversion factor is just the charge of the electron. This is not coincidental, but rather a consequence of the definition of the non-metric unit.
Photon energy E is determined by the frequency of EM radiation: the higher the frequency, the higher the energy. Though photons move at the speed of light (as would be expected for electromagnetic radiation), they have zero rest mass, so the rules of special relativity are not violated.
Is light a wave or a particle? The correct answer is "yes." The stance we employ really depends upon the process being observed, or the experiment underway. The applicable perspective often depends upon the energies (frequencies) of the photons. It is generally found that wave aspects dominate at frequencies below about 1015 Hz; particle aspects dominate at higher frequencies. In the visible part of the spectrum, both descriptions are useful.
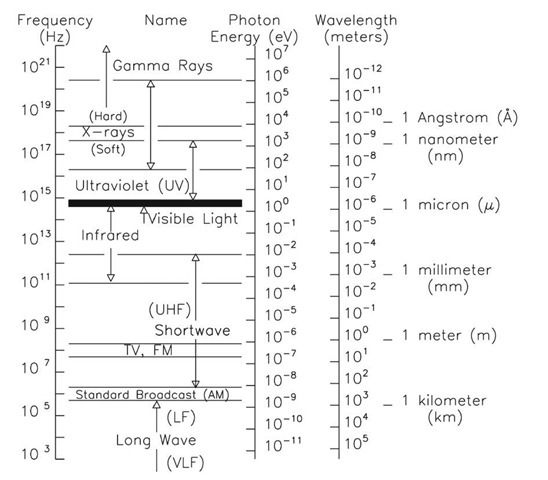
Figure 2.3 summarizes the concepts developed so far. Wavelength, frequency, and energy are plotted vertically with the labels we routinely use to define wavelength regions. Common abbreviations for wavelength are given. Note that the unit that might be expected for 10 6 m, the micrometer (^m), is generally termed the micron instead. The Angstrom is a non-metric unit, but nevertheless widely used, particularly by older physicists. The nanometer (nm) needs to be carefully distinguished from a nautical mile. Visible-light wavelengths correspond to wavelengths of ~ 0.5^m, and energies of 2-3 electron volts (eV).
Figure 2.3 The spectrum of electromagnetic radiation.
Example:
The energy of the photons making up an electromagnetic wave (light wave) in the visible part of the spectrum that is green is
This energy is on the order of (or slightly less than) typical atomic binding energies.
Energies of typical x-ray photons are in the 104 to 105 eV range, while the photons of a 100 MHz radio signal are only about 4 x 10 7 eV.
Photoelectric effect
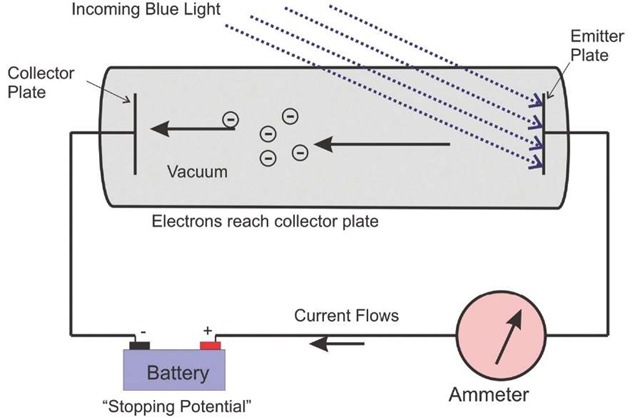
The concept of energy in photons is very important for detector technology. One illustration is the photoelectric effect, a concept that won Albert Einstein the Nobel Prize. The phenomenon is typically described in the context of an experiment, as illustrated below. If light hits a metal surface in a vacuum, electrons are liberated from the surface and can be collected on a second surface—here, the collector plate. You can measure the energy of the electrons by applying a back bias (a negative voltage) to the collector plate, repelling the electrons. Electric potentials of one to two volts are typically sufficient to zero out the current. Traditional wave theory predicts that the amplitude of the current will vary with the amplitude (intensity) of the light, which it does. But wave theory is not able to explain an observed dependence on the wavelength (frequency) of the light. The higher the light frequency (the bluer the light), the greater the electron energy. Einstein combined the above concept, E = hf, with the idea of a work function, a fixed amount of energy necessary to liberate electrons from a metal surface—typically a volt or two.
A classical laboratory experiment in the photoelectric effect is illustrated in Fig. 2.4. Light of varying wavelength is shone on a metal plate in a sealed vacuum cylinder. If the frequency is high enough, photons are emitted from the surface and propagate across a short gap to the collector plate. The collected electrons can be measured as a current. A calibrated voltage source is placed in the circuit to oppose the flow of the current. As the voltage is varied, the current varies. In this illustration, a mercury lamp with several distinct spectral lines is used, with results in Fig. 2.5.
Figure 2.4 Layout for demonstration of the photoelectric effect. The convention for the current is that it flows in the direction opposite that of the electrons.
In our illustration, light at three wavelengths is used: X = 435.8 nm, 546.1 nm, and 632.8 nm (blue, green, and red). Calculating the energies corresponding to these wavelengths, we get, for blue as an example:
Figure 2.5 Results from a demonstration of the photoelectric effect using a mercury (Hg) light source.
Similarly, we get E = 2.27 eV and E =1.96 eV for wavelengths of 546.1 and 632.8 nm, respectively. The experimental data shown below show that the total photon energy equals the electron energy plus the work function, or2
Table 2.1 Observations of the photoelectric effect.
|
Wavelength (nm) |
 |
Electron stopping potential, W (in volts) |
 |
|
435.8 |
2.85 |
1.25 |
1.6 |
|
546.1 |
2.27 |
0.7 |
1.6 |
|
632.8 |
1.96 |
0.4 |
1.6 |
Photomultiplier tubes
The photoelectric effect demonstrates the idea that light (photons) has energy and also leads to our first example of how detectors work: the photomultiplier tube. This old technology is still in use, having evolved into modern technological devices such as night-vision scopes.
Figure 2.6 Sternglass Formula for Secondary Electron Yield. The Sternglass formula is the standard description for the yield of secondary electrons, as a function of incident electron energy.
Sternglass published an expression for the secondary current by electron impact using the yield function:
where the maximum yield![]() and the energy at which it occurs
and the energy at which it occurs![]() vary from material to material. Illustrative values for glass
vary from material to material. Illustrative values for glass ![]() for example, are
for example, are![]()
![]()
The front surface of the photomultiplier tube is a very efficient photoelectron source within the spectral range (and photon energy) of interest. An initial-incident photon produces a single electron (statistically, only about 70-90% of photons produce an electron), and the electron is multiplied through secondary emission, a close cousin of the photoelectric effect. This is the technology used in the DMSP/OLS-PMT detector, illustrated in Figs. 1.10 and 3.45.
As illustrated in Fig. 2.6, secondary emission is a process that can generate multiple electrons for each electron hitting a surface. The yield varies with material, but is generally two or more for electron energies of a few hundred volts. This enables a process of amplification to occur as the electrons from each stage are moved along. A fairly standard, end-illuminated, photomultiplier-tube design is shown in Fig. 2.7. A typical tube will have 10 stages or so, with a net acceleration of 1-2 kV distributed over the stages. A photon incident on the alkali window on the left will be multiplied until a measurable charge pulse of 105 to 106 electrons is carried out on the anode on the right.
Photomultiplier-tube technology has evolved into new forms that use fiber-optic bundles where the thin fibers are replaced with channels, or hollow tubes, again exploiting the multiplication process provided by secondary emission. Figure 2.8 illustrates how this technology works. These devices are the core of night-vision technology.
Figure 2.8 Micro-channel plate (image intensifier) design. A standard Hamamatsu product will be 1-10 cm in diameter, 0.5-1 mm thick, and have a channel pitch of 10-30 |m. They can be (and are) ganged together to increase the multiplication factor (104 for one stage, 106 for two stages, 108 for three stages). To form an image, a phosphor plate is put at the end of the stack.


