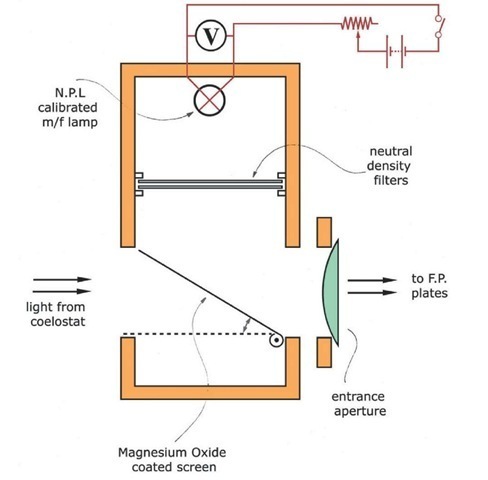
Intensity calibration box
To calibrate the instrument in intensity, an attachment was made, shown in the photograph, Figure 2.16, to the front end of the spectrometer. Its construction is shown in Figure 2.17. The source was an M/F pilot bulb, calibrated at the National Physical Laboratory for luminous intensity and colour temperature at a standard voltage. The source illuminates a Magnesium Oxide screen, newly deposited, through a set of neutral density filters. The angled screen was made big enough to over-fill the acceptance cone of the instrument, reproducing the conditions of sky operation, and the intensity was arranged to be comparable with a typical signal level from the night sky, so that a valid comparison could be made. The voltage was monitored on an AVO meter, and kept constant with a rheostat. When not in use the bulb was switched off and the screen was swung out of the beam. For details of use and calculations see topic 3.
Figure 2.17 Intensity calibration box.
The intensity calibration bulb is not visible in figure 2.16; it is housed in the calibration box, as shown in Figure 2.17. The lamp visible in Figure 2.16 is a wavelength calibration source.
Wavelength calibration assembly
Two spectral lamps were used to perform calibration scans. For accurate wavelength calibration the intensity of the lamp must be constant during the time of the scan, and the illumination of the entrance aperture must be as uniform as the signal light, since evidently each annulus in the entrance aperture passes at a slightly different angle through the F-P plates, peaking at a slightly different wavelength. The former condition is not met if the lamp has just been switched on, so this lamp was left permanently switched on during a night’s observing. This necessitated a rig which was easily demountable, to be hidden in a light-proof enclosure during sky scans. The assembly located a single-layer paper diffuser at the entrance aperture, illuminated evenly by the calibration lamp from a distance, via a 45° angled mirror.
The lamps used were a Phillips Zinc Halide, giving a spectral line at 5181.95 A, and a Pye hollow-cathode lamp, giving the emission line corresponding to the Fraunhofer 5183.6 A line, which was our designated target in the spectrum of the Zodiacal Light.
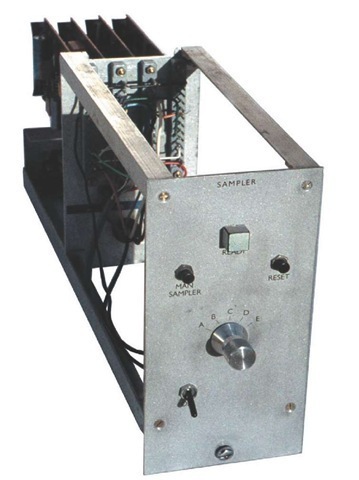
Figure 2.18 The New Sampler module, which determines integration times and generates the various pulses to operate the machine sequence.
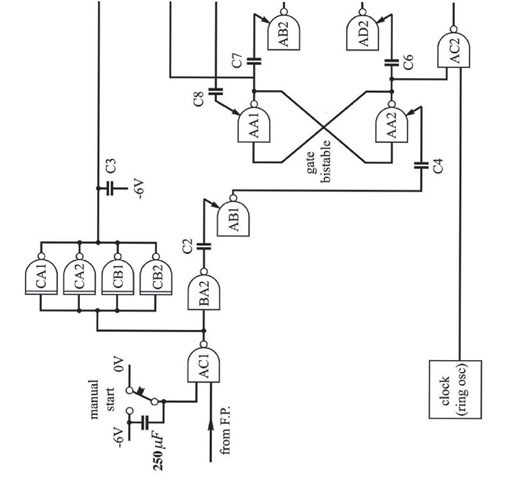
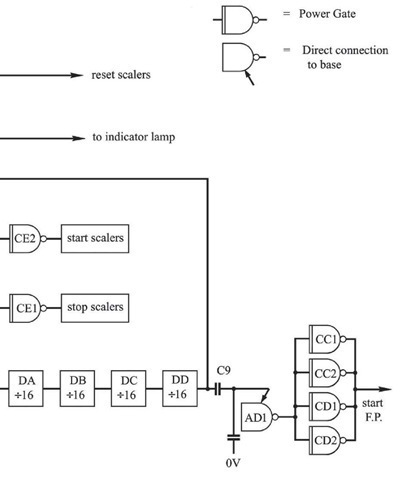
Figure 2.19 Logic schematic of the New Sampler Mk 4.
Control electronics
A new, reliable sampler module was constructed using MDTL logic, of my own design (Figure 2.18). The unit, whose logic diagram is shown in Figure 2.19, triggers the various functions in the control system, and incorporates a timer which determines the duration for which counts are recorded for each sample wavelength point.
The timer was completely new, designed and constructed by myself, since the old timer was the source of many problems. It is simple in design, but gave a new level of accuracy and reliability.
Instead of counting mains cycles, which can be erratic, a ‘clock’ waveform was generated by a ring oscillator, whose frequency was governed by a single temperature-controlled capacitor. Rather than counting pulses and decoding at various points to achieve various time intervals, the logic was set to give a signal after a constant number of pulses, and the time interval was varied by switching different controlling capacitors into the clock loop, thus changing the clock pulse rate. Intervals of one fifth, five, ten, fifty, and one hundred seconds were available. The sampler logic diagram (Figure 2.19) uses Motorola logic symbols and most of the elements perform their standard nand function. The short period delays, however, are a little unusual, and warrant some explanation.
Figure 2.20 shows a single element of a typical nand gate used as a short period delay. (a) shows the arrangement using the logic symbol for the nand gate, and (b) is the equivalent circuit diagram, showing the individual npn transistor elements inside the device. The nand element is simply diode logic followed by a saturating amplifier. When all inputs are floating at 8 volts (designated ‘up’), both transistors conduct, and the output is 4 volts (‘down’). If only one of the inputs is held ‘down’ at 0 volts, VT1′s base becomes 0 Volts, cutting it off; VT1′s output is thus down at 0 volts also, which cuts off VT2, giving a delayed output of 8 volts (up).
In the delay arrangement, a negative edge is applied via a capacitor of capacitance C directly to the base of the gate, turning the gate off and giving an ‘up’ output. The second plate of the capacitor now charges up through the device itself, through resistors R1 and R3 at a rate depending on (Rj + R3) x C. In this case no internal leakage resistor is needed. When the second plate reaches 8 volts the gate is switched back, giving a delayed negative-going edge at the output. The technique is limited to a few milliseconds, because use of a large capacitor soon over-runs (and burns out) the previous element in the circuit; MDTL elements are essentially fast, low fan-out devices. Figure 2.20b provides a key to the internal circuitry of the nand gates, which, prior to the invention of multiple Integrated Circuits, were the ‘state-of-the-art’ elements for constructing the controllers and computers of the 1970′s.
In operation, the sequence was initiated manually, or by a pulse from the pressure control unit indicating that the previous sample had been completed. The scalers were reset by a negative pulse, and after a small delay, the ‘gate’ bistable was flipped to the ‘open’ position.
Figure 2.20a Logic representation of a short period delay.
Figure 2.20b The equivalent circuit.
This initiated a pulse to start the scalers counting signal events, and also allowed clock pulses through to the four ‘sixteen’ counters in series. When 164 clock pulses had been counted, the change in output level of the last counter was used to flip the bistable to the ‘off’ position, allowing no more pulses to be counted. A pulse was issued to close the gates in the signal scalers, and, after a short delay, pulses were delivered to trigger the print-out sequence and instruct the pressure controller to move to the next wavelength point. In this configuration there is fact no actual decoding of the clock pulses needed, and the counters do not have to be reset; they are already at zero, ready for the next sample.
There is an additional advantage in this system in that an error due to faulty starting or stopping of the clock can never give a large percentage error in the interval delineated. An error of a single period gives rise to a fractional error of one in 164. This is so small that no elaborate systems are needed to count an exact integral number of clock pulses.
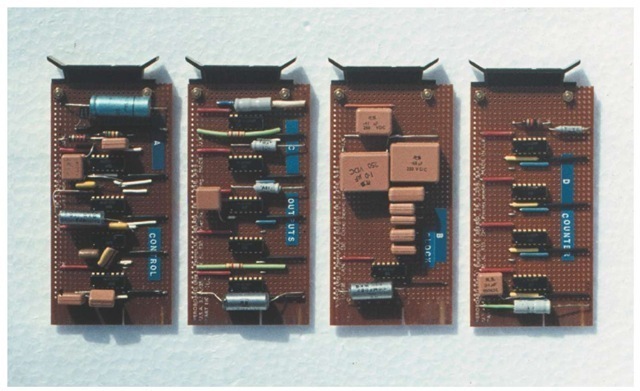
The sampler was constructed in modular form so as to be compatible with the Nuclear Enterprises equipment (Edinburgh series). New power supplies were made incorporating fast voltage control cards in addition to a Claude-Lyons mechanical voltage stabiliser, and a Voltstat saturating transformer to minimise the disruptive effect of the highly erratic mains supply existing in Izana in the early 1970′s. Figure 2.21 shows how the logic elements were physically arranged within the Sampler, on four homemade printed circuit boards, plugged in to the internal frame.
The pressure controller was mounted in a new easily accessible box, separate from the programming switches and logic, minimising vibration problems during operation.
Output devices
To facilitate on-the-spot scrutiny of counts recorded, a somewhat unreliable paper tape punch was replaced by a Nuclear Enterprises print control unit and an Addo line printer. For each spectral point the signal count and the compensation channel count were printed on a special roll giving duplicate copies.
Figure 2.21 Showing layout of components on Sampler boards.
The analogue outputs of the rate meters were fed into a new multi-channel chart recorder along with the reference pulses generated by the pressure controller at each step, providing an excellent visual display and permanent record which could be checked for spikes and other anomalies.
Optimisation of the system
Optics
Much care was taken to ensure that the optics were correctly aligned. The optical bench in the channel under the coelostat was used to define a principal optic axis. The coelostat circles were set to the Sun’s position accurately calculated from ephemeris tables, and the coelostat frame was positioned to project the Sun’s image on to the centre of the third mirror, which was in turn adjusted to send the image exactly along the optic axis of the tube. The oblique mirror in the hut was then adjusted to project the image centrally on to the entrance aperture of the Fabry-Perot etalon. The F-P optics were already aligned by autocollimation, with the plates set perpendicular to the optic axis by illuminating them with a bright extended source and lining up the centre of the ring pattern on the exit aperture. It then only remained to make sure that the F-P axis coincided with the axis of the incoming beam, which was centrally illuminated by the Sun’s image. Using this procedure it was possible to point the coelostat to an accuracy of half a degree, more than adequate for this work.
Counting electronics
The pulse height spectrum of a real signal differs from that arising from noise inside the photomultiplier tube, and an optimum signal to noise figure can be obtained by correct positioning of the threshold voltage level above which a signal pulse is counted, and correct setting of the EHT voltage used for the photomultiplier. The quantity to be optimised, as related by Hindle and Ibbett (1966), is
where S is the signal count and D is the ‘dark current’ count. To optimise this, readings of counting rates with the shutter open and closed were recorded for a number of settings of EHT and threshold levels, and the value of this formula calculated in each case, taking care to allow time for the tube to settle down after any change in EHT.
The system as a whole
To test the equipment as a system, numerous scans of the spectral lamps were performed, revealing the shape of the instrumental function, and how it changed in various conditions of use. Experience was gained in this way of the system’s stability while undergoing vibration and temperature changes, and its response to adjustments. Drift was at its most troublesome in the early evening when the external temperature was dropping quickly. In the first observing trip this effect was minimised by aligning the etalon at sunset to give a Magnesium I emission line peak at a slightly higher position in the pressure range than that eventually required, and gradually tightening the adjustment screws to bring the peak down in pressure to the working value at the time of the first sky scan of the night. In this way the wavelength drift due to compression in the spacers and springs was crudely balanced against the drift due to temperature change, and stability was easier to obtain. In the second trip using better temperature control equipment (fan heaters with thermostats, fitted inside an enclosure made of polythene sheeting) the drift was largely eliminated. As well as spectral lamp scans and scans of the filter using a continuous spectrum white light source, scans were recorded of the day sky. These furnished a useful standard absorption line shape, which was compared with a theoretical convolved shape (see topic 4) to check that the correct resolution was being achieved. Test scans were also recorded of moonlight, bright stars, the Milky Way, and ‘dark’ sky, to check for reasonable counting rates to be expected. Attention was then turned to the Zodiacal Light.
How the observations were made
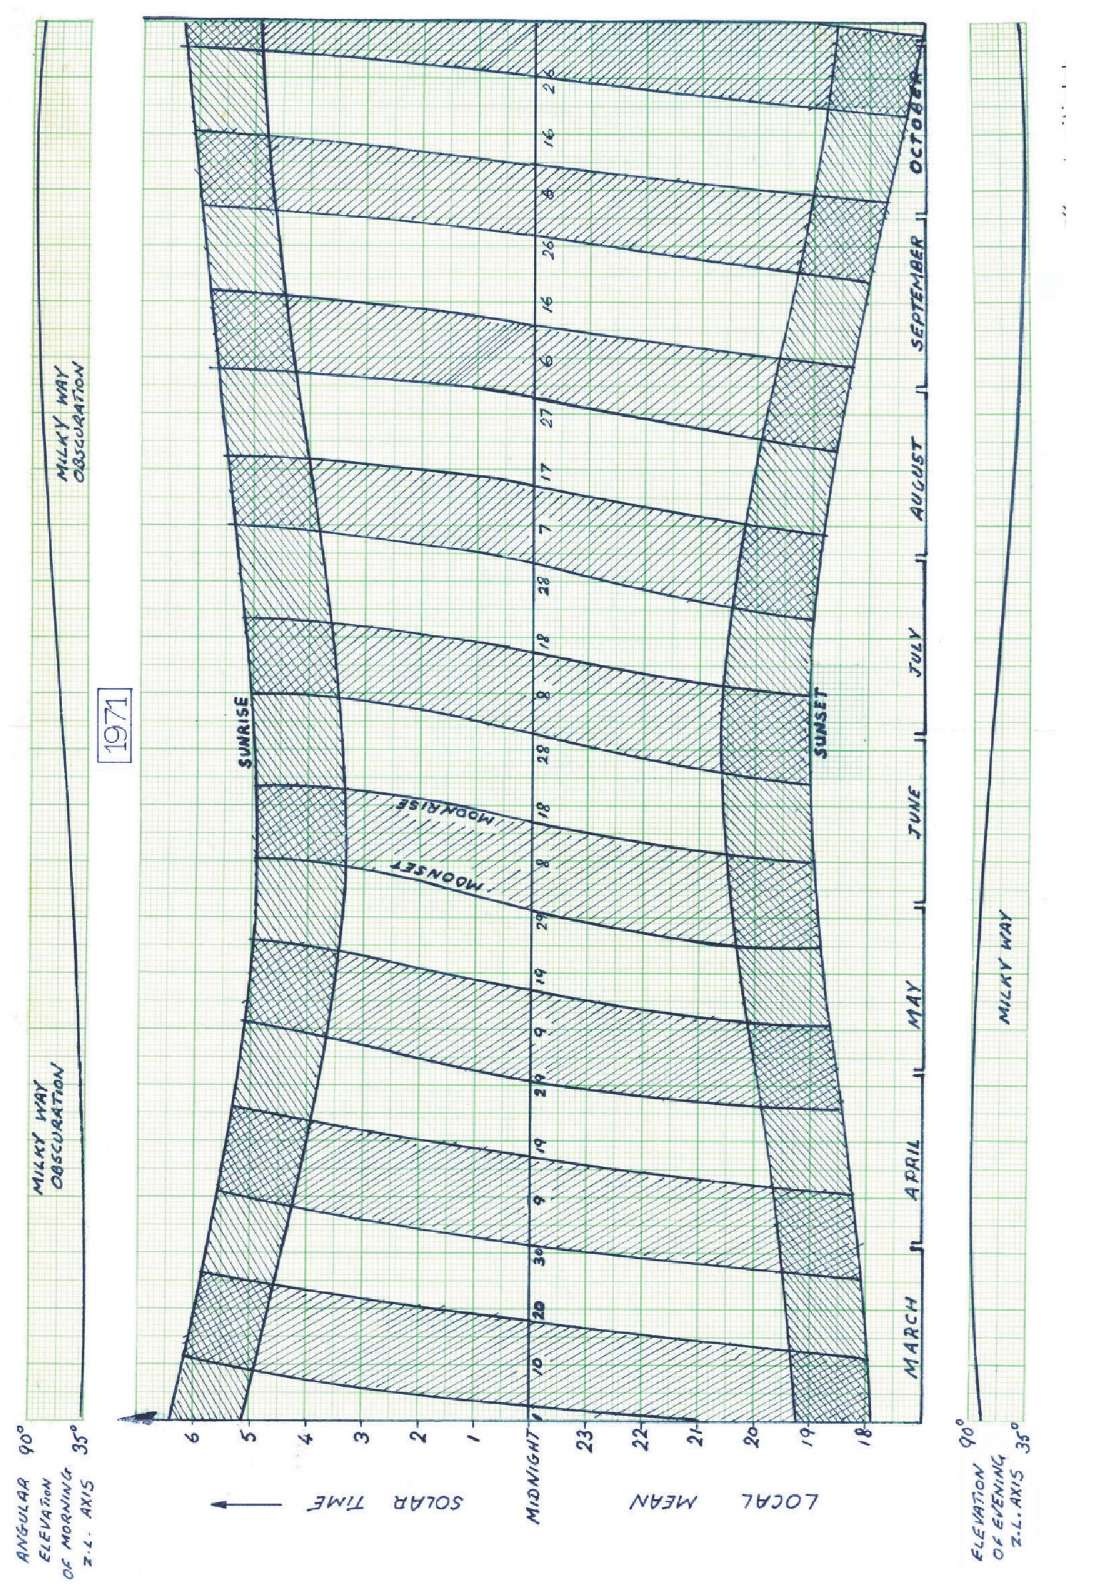
Zodiacal Light measurements can only be made in the absence of twilight and moonlight. A typical observing period begins about three days after Full Moon, when only about an hour of complete darkness is available between the end of astronomical twilight and moonrise. The available observation time then increases each night, up to a maximum at astronomical New Moon, and thereafter diminishes as the crescent ‘New Moon’ of every-day parlance sets later each evening. The observing period ends about three days before the next Full Moon. I have represented a number of such cycles diagrammatically in Figure 2.22, which is a useful quick guide to viable ZL observing time available in 1971. Of course clear weather is also necessary, and an absence of light pollution. Around New Moon both morning and evening Zodiacal Light can be seen. Also shown on the chart are the angular elevations of the principal axes of the morning and evening cones; the October period is seen to be most suitable for observations of the morning ZL at its maximum elevation (about 87 degrees at Izana). For similar reasons April is most suitable for observing the evening ZL. These periods fortunately also give freedom from contamination by the Milky Way at low elongations from the Sun. I planned my observations to be mainly concentrated in the ecliptic plane, and before an observing trip a number of points along the line of the ecliptic were tabulated.
The method adopted was to choose points separated by about five degrees along the ecliptic characterised by a number according to their ecliptic longitude, and note their coordinates in Right Ascension and Declination. Points were chosen as far as possible free of nebulosity and bright stars, but were later to be improved by experiment.
The procedure for making an observation was as follows: one of the tabulated points was chosen, its suitability verified by eye and reference to Figure 2.6, and the coelostat was set to accept light from this point. Counting rates were then sampled for between 10 and 18 spectral elements over a range of about 4 A centred on the 5183.6 A line. The integration time for each sample point was 50 seconds. On each night the points available were systematically covered, using the periods close to twilight to look at low elongations.
Figure 2.22 Schematic of suitable times to observe the Zodiacal Light in 1971. Each day is represented by one vertical line, and unshaded areas represent a possible dark sky. Add 1 to date after midnight
From night to night, the tabulated ecliptic points gradually shifted in elongation from the Sun, as the Sun’s position changed relative to the background stars, and so over a few days a fairly uniform sampling of elongations was attained, with a deliberate concentration on the Gegenschein.
If any tabulated point showed a consistently erratic pulse count in the compensation channel, a better point was found and henceforth used instead, so by experience a good set of points was built up.
The area of the sky projected on to the entrance aperture was about one square degree, and since the duration of a scan was typically 12 minutes, the spatially resolved patch of sky was an oval three degrees long and one degree wide.
Unless special care is taken, any drift in the Fabry-Perot spacing will result in a drift in the position of maximum transmission during the scan, adding uncertainties to the wavelength calibration. The pressure corresponding to the position of the unshifted 5183.6 A line was determined immediately before and after each scan, by scanning the Magnesium hollow cathode lamp. These are the sky scan’s associated finesse scans, so-called because they are also used to test whether the finesse was good enough, or not, in which case the plates needed realignment. Care was taken to ensure that, in these calibration scans, the entrance aperture was evenly illuminated and that the intensity was constant, for reasons given above. Scans of a continuous white light source were made before and after each night’s observations to determine the position of the filter peak in wavelength, and at these times dark counting scans were also recorded, these being performed by covering the entrance aperture rather than closing the shutters, in order to count stray light along with the photomultiplier dark or noise current. In the April 1972 observing session, the stabilities of both etalon and filter were greatly improved by temperature-controlling the instrument to ± 0.5°Celsius. Two methods presented themselves for improving the stability still further in subsequent experiments; an optically contacted etalon with quartz spacers, or variable thickness spacers controlled by a good servo-loop. Both systems were later realised in the Imperial College Infrared Astronomy Department. The servo-controlled piezo Fabry-Perot, developed by Tom Hicks, proved to be particularly rewarding in performance: in the hands of Hicks and Reay, it gave birth to a highly successful manufacturing company devoted to the commercial production of these devices for use in research and industry, and in 1984, one of these instruments enabled East and Reay to revisit ZL Doppler shift measurements (see later, section 4.13.2), and amass data with a significantly improved signal-to-noise ratio.
The wavelength scale was established experimentally by scanning the Magnesium and Zinc lamps alternately, and in topic 3 the use of these scans to make this calibration is described. Intensity calibration scans were performed using the attachment described above, and scanning exactly as for a sky scan. During the day some blue sky scans were recorded for comparison.
In all, 245 scans of the Zodiacal Light and Gegenschein were obtained, plus about 20 various others, including the apex and antapex of the Sun’s motion in the local galaxy.
This completes the account of experimental details.


![tmp69-116_thumb[2][2] tmp69-116_thumb[2][2]](http://what-when-how.com/wp-content/uploads/2011/08/tmp69116_thumb22_thumb.png)
