Review of the period of my observations of the ZL, 1970-1974
It was the intention of this PhD study to fill in the gaps and uncertainties left in observational data in 1970; to make a comprehensive survey of a Doppler-modified Fraunhofer line in the ecliptic plane at all elongations from the Sun, and hence constrain an accurate model of the Zodiacal Cloud’s configuration and velocity structure. The spectral line chosen was the MgI 5183.6A line, because of its (hoped) freedom from emission line contamination, and a new pressure-scanned Fabry-Perot interferometer was designed and built to make the observations.
In 1972 and 1974, we, Hicks and Reay of Imperial College Infrared Astronomy Department, under the supervision of Prof. James Ring, published, in two papers, the results from the research which forms the basis of this thesis. The first paper in Nature (Hicks,Reay 1972) reported the MgI emission which had unexpectedly turned up in the new spectra. The second paper in MNRAS (Hicks,Reay 1974) reported the evidence, found in our Zodiacal Light spectra, of radial velocity shifts in the MgI absorption line, the first comprehensive mapping of such shifts ever achieved. The paper confirmed for the first time with any certainty that the pattern of Doppler shifts was consistent with a high proportion of circum-solar dust moving in prograde orbits, though some significant asymmetries between morning and evening velocities were noted. A third paper detailing further interpretation with reference to dust cloud models, including a putative interstellar component, was never completed. The data obtained from this project, along with some comparisons with simple models of the ZDC, are detailed in topic 4, which constitutes the first full publication of the results of my research 1970-4.
Review of recent developments in ZL research, 1974-2007
Overview
Returning to the field of Zodiacal Light research after 30 years, I found I was in a good position to obtain a perspective on what progress had been made in the intervening time. I am indebted to four excellent papers for much of the information in this review – Grogan et al (2001), Reach et al (2003), Kelsall et al (1998), and Sykes et al (2004). My first observation was that, in keeping with the acronymic style of pigeon-holing now so universal, in which everything from espionage organisations, to diseases, to furniture warehouses, find themselves summed up in three letters, interplanetary dust particles are now referred to as "IDP"s. And the business of detecting them, and their composition, and orbital elements, has progressed enormously; we even have some in our hands, to study on Earth.
Secondly, it soon became apparent that there are now historically two distinct eras within modern ZL research: pre-IRAS and post-IRAS (InfraRed Astronomy Satellite). In the period 1974-1982, observations were extended, and the existing dynamical models updated, but the overall picture remained essentially unchanged, except for significant advances in in-situ collection techniques, and the analysis of meteoric impacts on Lunar samples (Singer 1969). It was the data gathered from the IRAS satellite in 1983 (while my rock group Queen was touring football stadia in South America) which finally moved our picture of the Zodiacal Cloud on, in a giant step, from diffuse oblate spheroid, the limit of anyone’s imagination since the 17th century, to a structured, dynamic and complex dust ensemble.
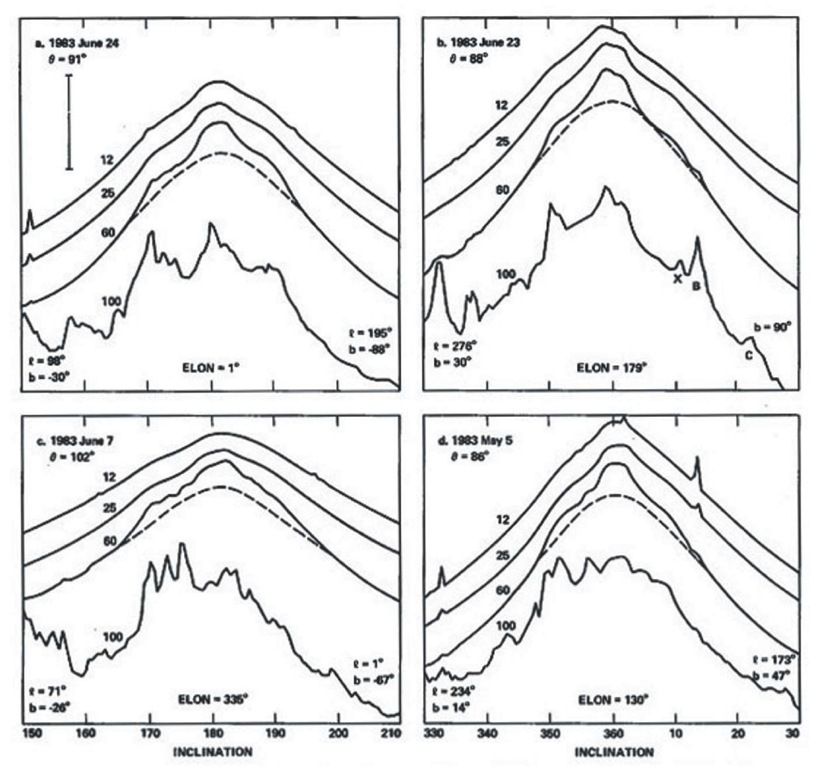
This features the now well-known ‘IRAS Bands’ (Low et al 1984), (see Figure 1.7), of which at least 4 pairs are now known, contributing about 10 per cent of the total Zodiacal emission in the infrared, and, on a small scale, cometary dust trails (around 8 of these have been seen at the time of writing). Moreover, it revealed a local dust cloud of a kind near the Earth, but the idea of a GDC was, at a stroke, replaced by a local toroidal dust intensification near the Earth’s in its path, due to resonance in the dust orbits; effectively a ‘dust lane’ stretching out behind the Earth in its journey around the Sun. This research also revealed (Hauser et al 1984) that the axis, the line of brightest scattering of the ZL, changes its orientation to the ecliptic plane, depending on where the Earth is in its orbit. The position of the axis varies in a yearly sinusoidal cycle with a maximum tilt of about two degrees, bringing about an expected seasonal intensity variation of around 15 per cent, in addition to a 5 per cent variation in a different phase, resulting from the offset of the Sun from the centre of the cloud. This, strangely, brings to mind once more the findings of the patient Rev. Jones in 1856, who did see a variation over the two years in which he made his naked-eye observations of the contours of the ZL as he saw them from his boat.
Fig 1.7 Low et al’s discovery of the Zodiacal Dust Bands.
He saw what he thought were parallax-induced variations in the position of the axis, but since his voyage moved him not only in latitude, but around the Sun too, over a period of two years, it is perhaps possible that his maps record the first documentation of the inherent asymmetry of the ZC with respect to the ecliptic plane.
Dermott et al (1992) achieved an impressive theoretical fit to the yearly cyclic variation, using their own updated ‘SIMUL’ model of asteroidal dust of radius 3.4 ^m, spiralling slowly inwards under the influence of Poynting-Robertson drag (Robertson 1937), and perturbation of the planets. A little later, Leisawitz et al (1994) using the new data from IRAS, but also that from the DIRBE survey aboard the COBE satellite, extended the analysis to link the dust-band data with particles of varying sizes produced by collisions of asteroids in the Eos family. All the new analyses led to a much more detailed picture: a finely tuned version of the ‘traditional’ lenticular-shaped ZC, now symmetrically distributed not about the ecliptic, but relative to a plane dictated by planetary perturbation, inclined at about 2 degrees to the ecliptic, and centred on a point 0.13 AU from the centre of the Sun. This updated view of the ‘traditional’ ZC was theoretically modelled with a combination of cometary and asteroidal contributions, the proportions of which are still under debate. But the new picture also included a three-dimensional notional map of the newly discovered, relatively stable ‘bands’ (attributed to toroidal concentrations of material), oriented at roughly one degree angles to the plane of the lenticular cloud, identified by Low et al (1984) and studied in detail by Grogan et al (2001) with matter spiralling in, under the influence of Poynting-Robertson drag, from collisions in certain families of asteroids. Added to this are the discrete trails of dust left by comets, seen unmistakeably for the first time in the IRAS composite images, (Sykes et al 1986) and a circumsolar ring at just outside 1 AU, as predicted by Gold, in 1975, observationally supported by Dermott et al (1994), and confirmed by Reach et al in 1995. The IRAS observations showed a consistent 3 per cent increase in intensity at all its wavelengths behind the Earth, looking directly at its line of motion, relative to that seen in front of the Earth in its orbit. This is consistent with the predictions for a resonant ring of width 0.4 AU with a cavity in front of the Earth. Dermott et al noted that this must produce an increased rate of capture in the Earth’s upper atmosphere, and that a seasonal variation ought to be seen, according to where the Earth lies in relation to the Zodiacal Cloud. They also saw this as a possible connection to the accretion of Life-bearing carbonaceous particles in the history of the Earth. Those particles not captured by the planets, of course, suffer a different fate: under the influence of Poynting-Robertson drag, and solar wind braking effects, the Zodiacal Cloud loses one ton of material per second, as the dust spirals ever inwards, to be vaporised at a distance of a few solar radii from the Sun.
The researches of these teams, as noted by Kelsall et al (1998), were all initially directed towards evaluations of infrared background emissions, from Galactic and extragalactic sources. It was a need to eliminate the foreground ‘contamination’ by the local interplanetary dust which led to their careful analysis of the ZC. Rowan-Robinson et al (1990) derived, from early IRAS data, a model of 12-100 micrometre emission by the Zodiacal Cloud, which I will refer to hereinafter as the RHVW model, which they were later able to use to subtract from the observational maps, to show the ‘shoulders’ of the IRAS bands (see details in 1.4.2.1).
So the Zodiacal Light can certainly no longer be thought of as smoothly symmetrical about the ecliptic plane. IRAS’s data collection was in the infrared, at 12, 25, 60 and 100 ^m, and all these observations are of emission, rather than scattering of sunlight, but there are now claims, from Ishiguru et al (1999), that corresponding features due to the existence of the IRAS bands exist in scattered light at visible wavelengths. They scanned the surface brightness of the ZL at right angles to the ecliptic plane, and discerned the ‘shoulders’ of discrete bands, superposed on the smooth curve of brightness associated with the ‘traditional’ lenticular ZC. This research begs the interesting question of why 50 years of careful photometry of the ZL from the Earth never revealed these ‘shoulders’ before. Perhaps this is another example of LFS – the Lucky Find Syndrome – nobody saw the ‘shoulders’ because nobody thought they should be there. Ishiguru et al are also one of the few modern observing teams to follow up on the Gegenschein, and claim to have detected parallax in the optical bands in the Gegenschein area, placing the source material at 1.6 AU from the Sun. In a recent collection of accounts of progress in ZL observations, the topic "Interplanetary Dust" (Gran et al 2001), the Gegenschein receives only four mentions, three in an (excellent) historical review, and one in the glossary.
At this point, since the newly discovered detailed structures of the ZL must in future play an essential role in constructing models of radial velocity patterns, it is useful to look at the important recent advances in more detail.
Infrared Surveys
Modelling based on IRAS data
Rowan-Robinson et al (1990) investigated the distribution of Zodiacal Dust as a function of position out of the plane of symmetry. Following Leinert (1985) and others, they looked for a fit to the IRAS flux measurements, using a functional dependence of number density of the dust grains:
where n is the number density near the Earth’s orbit, A = 1.AU, P0 is the elevation from the symmetry plane of the dust, and y ~ 1.3 from Helios data (Leinert et al 1981). A popular form of the function f (P0) was the ‘Fan’ model:
and Leinert et al (1981) put a = 2.1.
Rowan-Robinson et al in this paper explored models with a modified form
A particular form of this with![]() had been used by Murdock and Price (1985) to fit the
had been used by Murdock and Price (1985) to fit the
‘ZIP’ data (from Aries rockets).
The cloud was assumed to be made up of isotropically scattering ‘grey’ particles (for which they need to be of radius greater than a millimetre), and a temperature was assumed of the function:
No attempt was made to model for the IRAS dust bands at this point, or for the fact that the Sun might not lie at the centre of the symmetry plane of the disc, which had been reported by Dermott et al (1987); but provision was made for the symmetry plane of the dust not to be coincident with the ecliptic plane, and to be inclined to it at an angle i, with a longitude of the ascending mode Q .
The best fit was found to be:![tmp69-24_thumb[2][2] tmp69-24_thumb[2][2]](http://what-when-how.com/wp-content/uploads/2011/08/tmp6924_thumb22_thumb.png) and a figure very different from Leinert’s 2.1 estimate, of a = 4.9. This means physically that in this model, the dust is closely confined in the direction perpendicular to the plane of symmetry, and not so closely confined in the direction of radial distance from the Sun; the disc is quite flattened.
and a figure very different from Leinert’s 2.1 estimate, of a = 4.9. This means physically that in this model, the dust is closely confined in the direction perpendicular to the plane of symmetry, and not so closely confined in the direction of radial distance from the Sun; the disc is quite flattened.
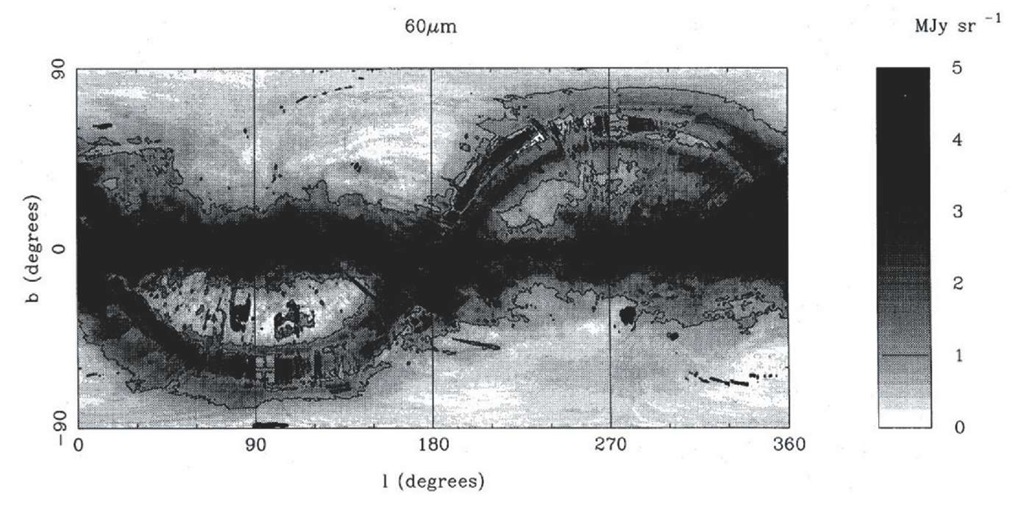
Rowan-Robinson et al (1991), in a following paper, used this model to subtract the main, smooth distribution of this theoretical cloud, revealing the shape of the dust bands. Figure 1.8 shows the result, at 60^m. The contours are 0 – 5 MJy sr_1, in steps of 1 MJy sr_1.
These authors concluded that there was a dust band at P = ± 10 , at colour temperature about 170°K, and ‘warmer’ bands at P = ± 5 , barely detected at 60^m, with a colour temperature of 250°K. The inner band was identified by Dermott et al (1985) as being due to debris from collisions in the Themis asteroid family, situated at about 3 AU. It is proposed that the collisional dust due to this ‘family’ stays in the vicinityd of the asteroids themselves, forming a diffuse toroid of material, which only slowly spirals in towards the Sun under the influence of drag from the Poynting-Robertson effect and solar wind. Members of families of asteroids all have the same orbital eccentricity, and the debris, at least initially, preserves this. Why are the bands in pairs? Dermott and Nicholson (1989), in a numerical study, suggested that the toroidal distribution formed by collisions has a dust density "higher near the surface of the torus than within it". Thus, looking at a sectional view through the torus, we see a concentration of emission at the edges.
Figure 1.8 From Rowan-Robinson et al (1991). Grey-scale and contour map of the 60 micron emission, in Galactic coordinates, after subtraction of RHVW and application of a correction factor.
In the case of the Themis band, therefore, the torus is 5° thick from our viewpoint, or in actual size, 0.25 AU. The outer bands were later identified as being associated with the Eos family of asteroids, which also reside at about 3 AU, but whose orbits are presumably more scattered in their inclinations to the ecliptic. In addition it was noted that there could be a component of interstellar dust, forming a disc located at 50 AU, in the ‘inner’ Oort Cloud, beyond the orbit of Pluto, which is thought to be the origin of short period comets.
Jones and Rowan-Robinson (1993), noting that the previous model did not make good predictions at low ecliptic latitudes, and also did not account for the IRAS Dust Bands, modified the ‘Fan’ empirical model at low values of z, where z is the perpendicular distance of the dust particle from the plane of symmetry, and thus![tmp69-27_thumb[2][2] tmp69-27_thumb[2][2]](http://what-when-how.com/wp-content/uploads/2011/08/tmp6927_thumb22_thumb.jpg) A new model was constructed, using components corresponding to an inner smooth fan of relatively high density, an outer fan, discontinuously beginning at about 1.5 AU, and superposed toroidal distributions corresponding to Themis and Eos. Based on the hypothesis that ‘old’ drag-degraded asteroidal Bands are at least significant contributors to the smooth cloud, the Fan model was assumed to contain essentially no material beyond a distance of 3 AU from the Sun. The major source of perturbation to dust grain orbits was assumed to be the planets. For areas close to the Sun, the parameter y was set to 1, since this is what the Poynting-Robertson effect indicated might be the steady-state situation, not 1.3 as used in analysing the Helios data. In this paper, the authors now modelled the density profiles of the bands themselves, using an analytical model for two families of asteroids, Eos and Themis. They also looked at modelling the density profiles of the broad bands seen in Figure 1.8, which the authors suggest may be due to the ‘scattering out’ of smaller particles from the narrow bands. The model they used is an adaptation of the narrow band model, but with two exponents instead of one to simulate the broad ‘plateau’ in the emission profile. The authors comment that it was this broad band which was actually first discovered by Low et al (1984). The best fit for this broad band model was added in to the fans and the narrow bands, plus an isotropic component, to achieve an overall best fit to the thermal emission mapping. In the fitting of the new Fan model, they found these new values for the variables:
A new model was constructed, using components corresponding to an inner smooth fan of relatively high density, an outer fan, discontinuously beginning at about 1.5 AU, and superposed toroidal distributions corresponding to Themis and Eos. Based on the hypothesis that ‘old’ drag-degraded asteroidal Bands are at least significant contributors to the smooth cloud, the Fan model was assumed to contain essentially no material beyond a distance of 3 AU from the Sun. The major source of perturbation to dust grain orbits was assumed to be the planets. For areas close to the Sun, the parameter y was set to 1, since this is what the Poynting-Robertson effect indicated might be the steady-state situation, not 1.3 as used in analysing the Helios data. In this paper, the authors now modelled the density profiles of the bands themselves, using an analytical model for two families of asteroids, Eos and Themis. They also looked at modelling the density profiles of the broad bands seen in Figure 1.8, which the authors suggest may be due to the ‘scattering out’ of smaller particles from the narrow bands. The model they used is an adaptation of the narrow band model, but with two exponents instead of one to simulate the broad ‘plateau’ in the emission profile. The authors comment that it was this broad band which was actually first discovered by Low et al (1984). The best fit for this broad band model was added in to the fans and the narrow bands, plus an isotropic component, to achieve an overall best fit to the thermal emission mapping. In the fitting of the new Fan model, they found these new values for the variables:
Figure 1.9 shows the appearance of the modified combination ‘Fan and Band’ model.
Jones and Rowan-Robinson in this analysis concluded also that the asteroid belt only accounted for about a quarter of the dust in the main belt. The rest was presumed due to comets, and material from the Oort Cloud, plus the possibility of an interstellar component.
Kelsall et al (1998), modelling the COBE data, referred to Dermott et al (1996) and Leinert et al (1998), discussed the evidence from the capture of particles, and concluded that 45% of the interplanetary dust was asteroidal. This may be compared with Durda and Dermott (1997) who estimated that 34% was from collisional destruction of asteroids – 10% from family members, and 24% from the main band. So it would seem from these analyses that perhaps one third of all interstellar dust is from asteroids. We have seen that Baguhl et al (1996) found evidence of interstellar component, but Kelsall estimated, from their own fitted model, that its contribution is ‘small’ (less than 15-20%). The distribution model of Kelsall et al (1998) is almost exactly along the lines of Rowan-Robinson et al (1990) except for the use of different symbols. Their formula for n(r) in terms of a function of corresponds to![tmp69-30_thumb[2][2] tmp69-30_thumb[2][2]](http://what-when-how.com/wp-content/uploads/2011/08/tmp6930_thumb22_thumb.jpg) The parameters they arrive at for best fit are:
The parameters they arrive at for best fit are:![tmp69-34_thumb[2][2] tmp69-34_thumb[2][2]](http://what-when-how.com/wp-content/uploads/2011/08/tmp6934_thumb22_thumb.jpg)
Figure 1.9 From Jones and Rowan-Robinson (1993). A density map of the best-fitting combined Fan and Band model.
The grain density is normalised.
This paper gives a very useful picture of density contours in a slice across the plane of symmetry (Figure 1.10), showing the appearance of dust bands and the Earth Ring.
Grogan, Dermott and Durda (2001) were the first to construct a model of the ZC dust bands including a significant population of large particles, as suggested by the observations of Love and Brownlee (1993). Moving away from empirical models entirely, Grogan et al followed the journey of asteroidal debris through the Solar System, constructing a model based physically on individual dust particle orbits, taking into account the size-frequency distribution of the material. A given asteroid collision produces debris according to some size-frequency distribution, given by
and, for ‘collisional equilibrium’, Grogan et al put q ~ 1.8.
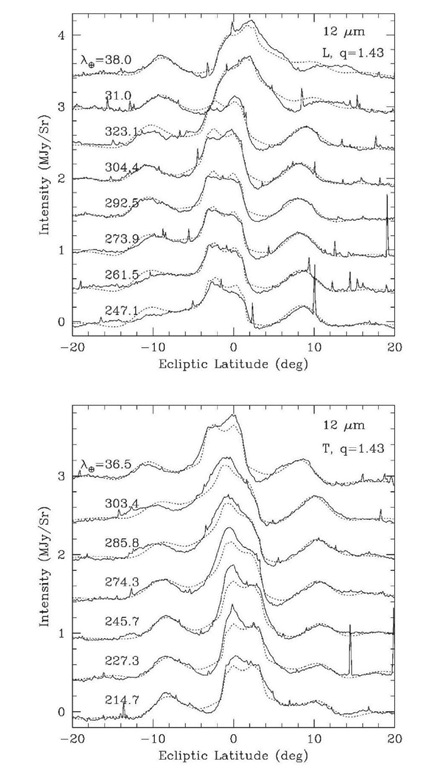
They noted that the average inclination of the Eos family of asteroids did not exactly match that of the ‘ten degree’ (actually 9.35 degree) dust band, but, working from the break-up of a single family member in the lower inclination end of the family, they were able to produce an impressive fit, shown in Figure 1.11.
Figure 1.10 From Kelsall et al (1998). Isodensity contours of the IPD model components, shown for a cross-sectional slice perpendicular to the ecliptic plane: (a) all components combined; (b) smooth cloud; (c) dust bands; (d) circumsolar ring. Contour levels in (c) and (d) are a factor of 8 smaller.
Figure 1.11 Best-fit dust band model (dotted curves) of Grogan, Dermott and Durda (2001) to the 12 micron IRAS observations in both the leading (top) and trailing (bottom) directions of view. This model has a size-frequency index of 1.43, indicating that large particles dominate the distribution.
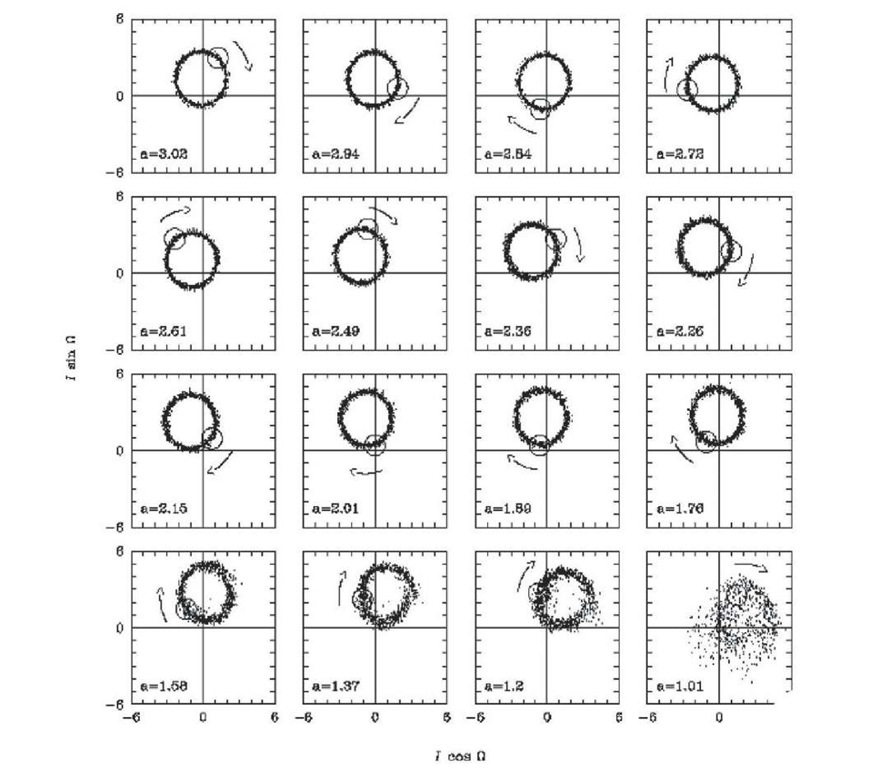
Figure 1.12 From Grogan, Dermott and Durda (2001). Showing the evolution of the inclination distribution of a wave of 10 micron diameter Koronis dust particles migrating from the asteroid belt toward the Sun (Kortenkamp and Dermott 1998). The particles were released 52,000 years ago with a mean semi-major axis of 3.02 AU. The wave has now reached 1.01 AU, indicating approximately 3,500 years between each frame. The motion of the ‘centre of mass’ of the distribution represents the changing I^ and Q of the wave. The radius of the circular distribution remains constant until the wave approaches Earth and many particles are gravitationally scattered. The large open circle in each frame follows the evolution of a single orbit and reveals the clockwise precession of Qp.
The excess velocities of collision products will be much less than the orbital speed of the parent particles (15-20 km/s), so the orbits of the individual fragments will be similar, their orbital elements only slightly perturbed in the beginning. But in only 100 to 1,000 years, this small differential in relative velocity (10-100 m/s), corresponding to a minor dispersion in semi-major axes, produces a thin ‘tube’ of material spread all around the parent asteroid’s orbit. Over the next few thousand years, secular precession randomises Q, the ascending nodes of the elliptical orbits, producing a toroidal distribution, the extremes of which are observed as dust bands.
The main driver of secular precession is the gravitational effect of Jupiter, but all the planets have an effect. Over the next 105 years, Poynting-Robertson drag lessens the eccentricity of the orbits, circularising them, and steadily reduces their semi-major axes. Figure 1.12 shows the predictions of Grogan et al for the evolution in inclination and ascending node of a typical debris ring as a function of time, this time from a collision in the Koronis family. It can be seen that the end result, is a randomised If and Q, such as might contribute to a main continuum, the dust simulated in "Fan" models.
The predictions of Grogan, Dermot and Durda’s models favour the argument that these features, the dust bands, are non-equilibrium features of the cloud, i.e. they are the result of individual, random, catastrophic collision events, rather than the gradual grinding down of asteroid family members.

![tmp69-18_thumb[2]_thumb tmp69-18_thumb[2]_thumb](http://what-when-how.com/wp-content/uploads/2011/08/tmp6918_thumb2_thumb_thumb.png)
![tmp69-19_thumb[2][2] tmp69-19_thumb[2][2]](http://what-when-how.com/wp-content/uploads/2011/08/tmp6919_thumb22_thumb.png)
![tmp69-20_thumb[2][2] tmp69-20_thumb[2][2]](http://what-when-how.com/wp-content/uploads/2011/08/tmp6920_thumb22_thumb.png)
![tmp69-23_thumb[2][2] tmp69-23_thumb[2][2]](http://what-when-how.com/wp-content/uploads/2011/08/tmp6923_thumb22_thumb.png)


![tmp69-36_thumb[2][2] tmp69-36_thumb[2][2]](http://what-when-how.com/wp-content/uploads/2011/08/tmp6936_thumb22_thumb.jpg)


