New features of the instrument
In this section I detail my own improvements, in which most of the equipment was redesigned and rebuilt.
Fore-optics
The front end of the F-P optics was changed so that the coelostat’s ‘final’ lens now delivered an f/17 beam directly from the coelostat mirrors, removing the necessity for a relay lens, eliminating two glass-air surfaces and hence increasing the light throughput.
Field lens
A field lens was added at the entrance aperture, imaging the final coelostat lens on to the F-P plates, while the coelostat lens images an area of sky on to the entrance aperture. This was designed to prevent anomalous results due to any non-uniformities in the sky appearing on the plates, which themselves are not perfectly uniform. Also, because the plates were now at a pupil of the system, maximum throughput was achieved for a given plate area, giving increased luminosity.
Beam splitter for compensation channel
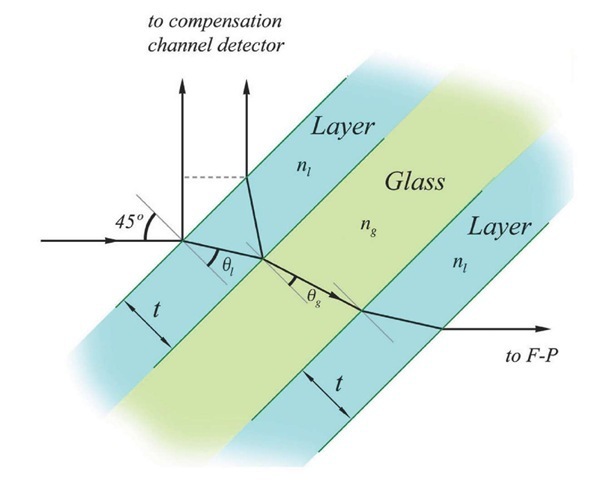
The glass plate which is used to deflect a small percentage of the light into the compensation channel has to sample the full area of the beam, but since this channel functions over a 400 A wide pass-band, little intensity is needed, and in this situation it is vital to steal as little light as possible from the signal channel. The plate was thus coated with a single dielectric layer for maximum transmission at 5000 A, at 45°, an unusual specification. The thickness of the layer was calculated as below. Figure 2.10 shows the geometry.
Remembering that the glass plate is to be positioned at an angle of 45° to the incoming beam, we have immediately, by the laws of refraction
where ng and nl are the refractive indices of the glass and the layer respectively. If the thickness of the layer is t, maximum transmission occurs when the path difference between the two reflected rays
Figure 2.10 Coating for maximum transmission. 2nlt cos0l is exactly one half wave, making them interfere destructively:
Figure 2.11 The centre part of the Fabry-Perot box, showing the etalon in its pressure pot, and remote adjusting screws behind.
The material used was Magnesium Fluoride for which nl = 1.37, and for a X of 5183.6 A, the formula gives a thickness of 0.1 pm (microns) for the layer. This, when applied to both surfaces, reduced the percentage of diverted light to one half of that diverted by the previous plain glass plate, further increasing the throughput of the spectromete€r.
Construction of housing
A new light-proof cover was made for the instrument, part of which is visible in Figure 2.11, with sides which could be slid off for easy access to the optics without disturbing the alignment of the etalon. A cam mechanism was made for tilting the broad band interference filter, to enable its wavelength peak to be ‘tuned’ without opening the cover. Some new lateral adjustments to the lenses made it possible to line up the whole system more accurately. Most importantly, the three control screws for adjusting parallelism of the etalon were re-mounted remotely, on top of the box (Figure 2.11), where they could be operated by an observer at the ‘Maxwellian’ view of the plates in transmission, the eye located on the optic axis by an iris diaphragm. From such a position one can immediately see if the plates are in alignment, because the illumination is uniform, or as close to uniform as the perfection of the polishing and coatings allows. Adjusting the screws while looking at the Maxwellian view, it became easy to get a ‘feel’ of the etalon, and much realignment time was saved during observations. An improvement in the response of the adjustments was effected by replacing the metal runners on which the plates rested by PTFE (Teflon) strips, reducing friction and lessening long period drift.
Figure 2.12a The ‘perfect’ Fabry-Perot etalon.
Fabry-Perot theory, and the finesse of a practical interferometer
The F-P plates are the heart of the spectrometer, and upon their quality depends the quality of the results. Since a new operating wavelength had been chosen, 5183.6 A, the opportunity was taken to have some new plates made. They were cast from fused quartz, four inches in diameter and about an inch thick, polished to an accuracy of X/200 and coated with 7-layer dielectric (alternating Magnesium Fluoride and Zinc Sulphide) stacks to give a reflectivity of 95 per cent at 5000 A. These materials are still used today. Some recourse to Fabry-Perot theory is necessary here to explain what performance was expected, and what wasobtained.
Reflection Finesse NR
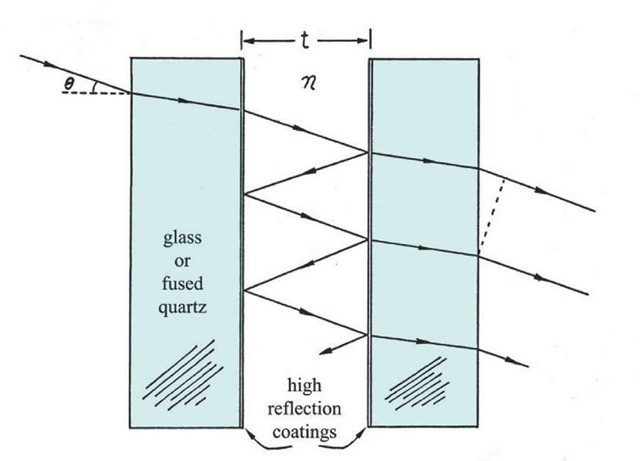
Figure 2.12a shows a ‘perfect’ F-P – two perfectly flat plates with a high reflection coefficient R, accurately parallel and separated by a thickness t of dielectric material of refractive index n. Any text topic of light (e.g. Jenkins and White) shows that a ray of light incident at an angle 0 to the normal emerges as an infinite number of multiply- reflected rays, and the superposition of these rays, known as the Airy Summation, gives a resultant transmission T , given by
where A is the path difference between successive transmitted rays.
Figure 2.12b Transmission function of the perfect Fabry-Perot etalon.
The geometry is the same as in Figure 2.10, and the path difference is given by
Maxima of T occur when
where M is an integer, called the order.
For a maximum,
Used as an interferuometer, the Fabry-Perot is worked at around zero angle of incidence, so
Normal Incidence
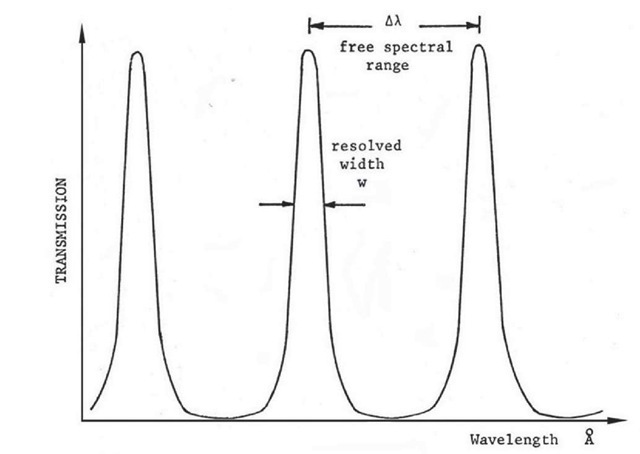
A plot of t as a function of X has the classic Fabry-Perot shape shown in Figure 2.12b – a system of narrow peaks in transmission, separated by regions of almost no transmission at all. As was shown above (Figure 2.7), all but one of these peaks is blocked by the premonochromating filter, allowing just one narrow band of wavelengths to pass through the system.
The separation of adjacent maxima, Xj- X2, is called the Free Spectral Range, AX, of the etalon. For these maxima, using equation 2.2,
(since XjandX2 are both approximately equal to the central wavelength X).
• * • Free Spectral Range
A constant called the reflecting finesse Nr is defined as
where w (Figure 2.12b), is the full width at half power of the peak, also called the resolved width. NR is a constant for a given set of plates, so this ratio is also constant.
Reflecting Finesse
If the gap t is increased, or if the refractive index n of the material in the gap grows in value due to increased gas pressure, the whole pattern of peaks in transmission moves down along the wavelength scale, keeping its proportions; AX decreases at the same rate as w because the ratio between them is a constant, the finesse of the plates. Hence for a given pair of plates we can obtain better resolution only by decreasing the free spectral range, which necessitates a narrower filter to cut out unwanted orders, and so cuts down the range of wavelengths over which the instrument can scan. Note that, in equation 2.6, R is a quantity close to unity, so![]() is even closer, and a good approximation for
is even closer, and a good approximation for![tmp69-75_thumb[2] tmp69-75_thumb[2]](http://what-when-how.com/wp-content/uploads/2011/08/tmp6975_thumb2_thumb.png) is 3. So as a rough guide,
is 3. So as a rough guide,
Now Nr has been carefully designated the reflecting finesse, because in a practical Fabry-Perot there are other factors which affect the ratio between AX and w.
Aperture finesse
The first of these is brought about because there must be a finite angle of acceptance at the plates in order to produce a finite intensity at the detector. In other words we are no longer concerned with normal incidence only. For each angle of incidence a slightly different wavelength is allowed to pass, so the result from a finite cone of light accepted at the plates is a ‘smearing’ of the transmission peak. The greater the angle of the cone, the wider the peak, and the more the effective finesse is degraded. An aperture finesse is defined as the ratio of AX to the width SXA of the smeared peak in the absence of any other effect (i.e. assuming infinite reflection finesse). If i is the angle made with the normal by the extreme ray of the cone, we have, from equation 2.2,
giving, using eq. 2.4:
Aperture Finesse
Note that this has defined a throughput![]() of the plates where A is their area and W is the solid angle of the cone.
of the plates where A is their area and W is the solid angle of the cone.
So
where D is the diameter of the plates.
Throughput of F-P plates
This, for maximum efficiency, should be matched to the coelostat’s throughput, which can be calculated at the entrance aperture. Here, if the diameter is d and the f/ number of the beam is f,
For matching, the throughputs are equal, giving …
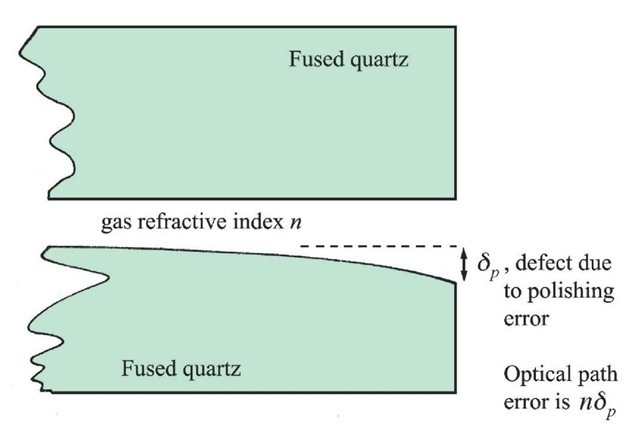
Figure 2.13a The effect of polishing errors. Substituting this value in equation 2.8
Aperture Finesse
Thus the physical parameters of the optics alone determine the aperture finesse at which the instrument should be operated.
Defect finesse ND
Suppose the plates are not perfectly flat but have a residual microstructure of indentations in their surfaces. They may also have a large-scale curvature or ‘bowing’ (Figure 2.13a). In either case a typical departure 8p from a plane surface can be found. The usual method for determining the flatness is to misalign the plates slightly, producing the appearance of parallel bands. Measurement of the deviation of a band indicates the magnitude of a departure from flatness. This means that some parts of the plates effectively have a gap differing by 8p from that expected, again producing a smearing of the maximum transmission peak. A defect finesse is defined in the same way as an aperture finesse, by analogy with the reflection finesse.
Defect finesse
where wd is the ‘smeared’ width due to plate defects, in the absence of any other effect. For the two extreme cases we have, from equation 2.3
Hence, using equations 2.4 and 2.11, the defect finesse
Defect finesse (polishing)
Thus, given a limit to the accuracy with which the plates can be polished, there is a limit to the finesse attainable. For this reason, the defect finesse has been called by some writers a limiting finesse. However modern methods of polishing can give a flatness of X/200 or better, and it is the next consideration which tends to limit the overall finesse.
Coating non-uniformities
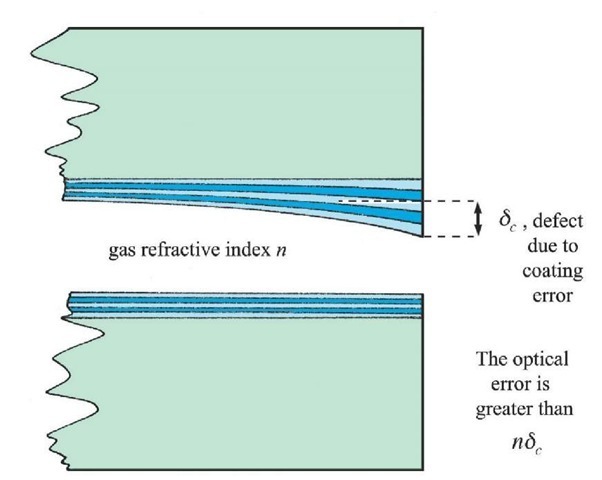
To obtain the very high reflection coefficients needed to give high finesses, quarter-wave layers of dielectric material, of alternately high and low refractive index are deposited in a ‘stack’ of 7, 9, or 11 layers, etc. A seven-layer stack can give an intensity reflection coefficient of 95 per cent over a restricted spectral region (a few hundred angstroms), whereas aluminium surfaces can reach no better than 92 per cent. The layers are deposited in an evaporation chamber at a high temperature to give mechanical stability to the layer, and the plate is usually rotated and moved in an epicyclic path to produce a deposition as uniform as possible. The thickness is monitored optically, and when the centre reaches, say, a quarter-wave thickness, the plate is masked, awaiting the next layer. Any residual non-uniformity is rotationally symmetrical, and, since each process is similar, any error tends to be repeated in successive layers, giving a cumulative effect. To this may be added the effects on the substrate (glass plate) of heating and cooling, which, depending on rates of change of temperature and on how well the plates were annealed initially, can give a distortion of the substrate itself. A typical section of a non-uniformly coated plate is shown in Figure 2.13b.
Figure 2.13b The effect of coating errors.
A fourth ‘coating finesse’ could be defined, but it is more convenient to add a ‘coating defect’ 8c to the polishing defect 8p and modify the defect finesse accordingly. Unfortunately the effect of non-uniformity in coatings may be more serious still, because reflections from a stack of layers differing slightly from X/ 4 in thickness suffer a phase change which is also cumulative. This effect magnifies the purely geometric effect by a factor of the order of 2.
We can say that the total defect 8 is given by:
where 8p is the polishing defect, 8c is the coating defect, and a is the magnifying factor due to phase effects. Lissberger (1969), showed, by reducing a stack to successive single-layer problems, that in a stack of k layers, small departures 8s in optical path from one quarter wave in the sth layer, numbered from the substrate, produce a phase change in the final reflected ray of
where Ls is the weighting factor which is greatest for layers near the gap, since the amplitude is greatest here. For most purposes 8s is the same for each layer and so for a given system we can identify as the magnification factor a.![tmp69-97_thumb[2] tmp69-97_thumb[2]](http://what-when-how.com/wp-content/uploads/2011/08/tmp6997_thumb2_thumb.jpg)
The modern mfethod of calculation is to treat the whole system using field matrices, an approach which lends itself to the use of a computer to ‘solve’ any configuration directly. The method gives identical results for small errors in layers.
The choice of plates
To summarise, one goes to the Fabry-Perot shop armed with three equations 2.7, 2.10, and 2.13:
Reflecting finesse
Aperture finesse
Defect finesse
along with a knowledge of the resolution and scanning range required. The resulting ‘real’ instrumental finesse N is a complex function of all these three, given roughly by
N turns out to lb e roughly half the value of any one component finesse when all of these are roughly equal. Any mismatching brings about a waste of available resolution-luminosity product. (ref. Chabbal 1958)
For our September trip, the plates, 4 inches in diameter, were polished flat to better than 8 = X/100, giving a possible polishing defect finesse of 50. The 7-layer coatings were accurate to one quarter per cent. This corresponds to a total expected error in the two stacks (14 layers in all) of one quarter per cent of![tmp69-103_thumb[2] tmp69-103_thumb[2]](http://what-when-how.com/wp-content/uploads/2011/08/tmp69103_thumb2_thumb.png)
The magnification factor a for Zinc Cryolite is about 2. Hence ![tmp69-105_thumb[2] tmp69-105_thumb[2]](http://what-when-how.com/wp-content/uploads/2011/08/tmp69105_thumb2_thumb.png)
The reflection coefficient was expected to be about 94 per cent, giving a reflection finesse of 50. It was thought that the estimation of defect finesse was pessimistic and the reflection finesse optimistic, but the reverse turned out to be true. The plates suffered some deformation in coating, degrading 8 , but the coatings gave an excellent reflection finesse, close to that theoretically possible with 7 layers.
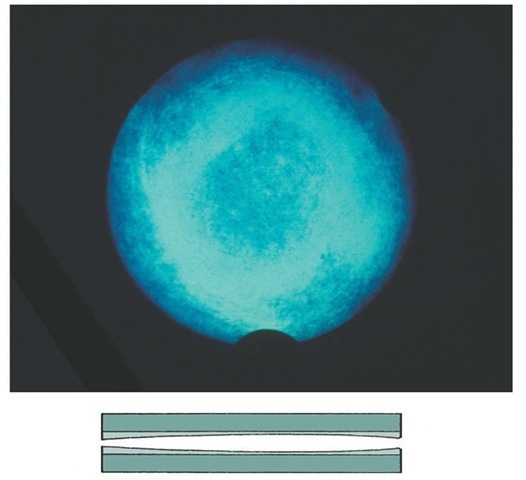
Figure 2.14 (top) Maxwellian view of F-P plates with effectively monochromatic illumination in the green, showing non-uniformity, and (bottom) possible cross-section of plates (exaggerated).
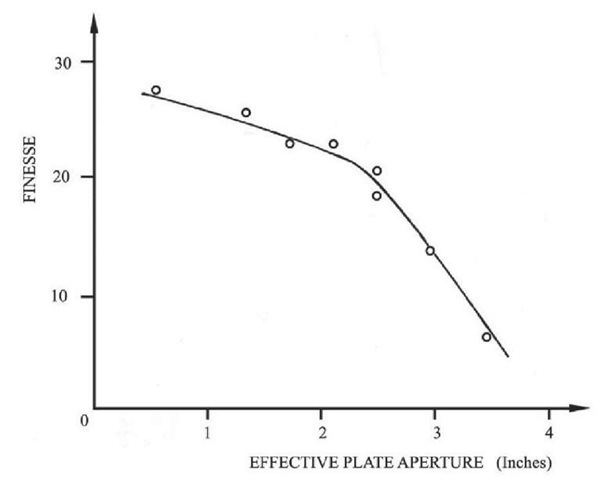
Figure 2.15 Finesses using a 2" entrance aperture (as distinct from aperture of F-P plates)
Figure 2.16 The new front end, with calibration equipment in place. The square section coelostat tube is visible at the extreme left, where light enters the hut.
Figure 2.14 shows a Maxwellian view of the plates illuminated normally with a Mercury vapour spectral lamp green line. The band-width of the illumination was much less than one angstrom. The photograph is a good illustration of a situation in which the reflection finesse is much better than the defect finesse, showing a microstructure of small scratches swamped by a long range defect indicated by a bright ring, or annulus, instead of the even illumination over the aperture that one might have expected. As the gas pressure was increased, the bright ring expanded, showing that the gap was wider at the edges than in the centre; the plates were exhibiting a convex spherical surface, rather than the perfect flat profile they were designed to have. Each small area on the plates would give a transmission peak about one angstrom wide, but the peak arrives at different pressures for different parts of the plates, so the overall peak is very wide. Masking off the edges improves the overall finesse as shown in Figure 2.15, but at the expense, of course, of throughput. A two and three quarter inch mask was considered the best compromise, and this was used in making the observations.
In this case, the excellent reflecting finesse is not only no advantage, but actually decreases the throughput.
A full discussion of the limitations in throughput of Fabry-Perot interferometers due to mismatching of finesses was given by Jacquinot (1954). Operating our plates at less than full aperture significantly decreased our counting rates, and degraded the eventual signal to noise in the scans. Thus for future similar work it may be advisable to use fewer coatings, perhaps five, in the hope of preserving the overall finesse by matching the contributory finesses more closely. The instrument was finally operated at a finesse of 10, a resolved width of one and a half angstroms, and a free spectral range of 15 A, along with a filter width, to half power, of 6 A.
![tmp69-57_thumb[2] tmp69-57_thumb[2]](http://what-when-how.com/wp-content/uploads/2011/08/tmp6957_thumb2_thumb.png)
![tmp69-59_thumb[2] tmp69-59_thumb[2]](http://what-when-how.com/wp-content/uploads/2011/08/tmp6959_thumb2_thumb.jpg)

![tmp69-62_thumb[2] tmp69-62_thumb[2]](http://what-when-how.com/wp-content/uploads/2011/08/tmp6962_thumb2_thumb.jpg)
![tmp69-64_thumb[2] tmp69-64_thumb[2]](http://what-when-how.com/wp-content/uploads/2011/08/tmp6964_thumb2_thumb.jpg)
![tmp69-65_thumb[2] tmp69-65_thumb[2]](http://what-when-how.com/wp-content/uploads/2011/08/tmp6965_thumb2_thumb.jpg)
![tmp69-66_thumb[2] tmp69-66_thumb[2]](http://what-when-how.com/wp-content/uploads/2011/08/tmp6966_thumb2_thumb.jpg)
![tmp69-67_thumb[2] tmp69-67_thumb[2]](http://what-when-how.com/wp-content/uploads/2011/08/tmp6967_thumb2_thumb.jpg)
![tmp69-68_thumb[2] tmp69-68_thumb[2]](http://what-when-how.com/wp-content/uploads/2011/08/tmp6968_thumb2_thumb.jpg)
![tmp69-69_thumb[2] tmp69-69_thumb[2]](http://what-when-how.com/wp-content/uploads/2011/08/tmp6969_thumb2_thumb.jpg)
![tmp69-70_thumb[2] tmp69-70_thumb[2]](http://what-when-how.com/wp-content/uploads/2011/08/tmp6970_thumb2_thumb.jpg)
![tmp69-71_thumb[2] tmp69-71_thumb[2]](http://what-when-how.com/wp-content/uploads/2011/08/tmp6971_thumb2_thumb.jpg)
![tmp69-72_thumb[2] tmp69-72_thumb[2]](http://what-when-how.com/wp-content/uploads/2011/08/tmp6972_thumb2_thumb.jpg)
![tmp69-73_thumb[2] tmp69-73_thumb[2]](http://what-when-how.com/wp-content/uploads/2011/08/tmp6973_thumb2_thumb.jpg)
![tmp69-78_thumb[2] tmp69-78_thumb[2]](http://what-when-how.com/wp-content/uploads/2011/08/tmp6978_thumb2_thumb.png)
![tmp69-79_thumb[2] tmp69-79_thumb[2]](http://what-when-how.com/wp-content/uploads/2011/08/tmp6979_thumb2_thumb.png)
![tmp69-80_thumb[2] tmp69-80_thumb[2]](http://what-when-how.com/wp-content/uploads/2011/08/tmp6980_thumb2_thumb.png)
![tmp69-81_thumb[2] tmp69-81_thumb[2]](http://what-when-how.com/wp-content/uploads/2011/08/tmp6981_thumb2_thumb.png)
![tmp69-84_thumb[2] tmp69-84_thumb[2]](http://what-when-how.com/wp-content/uploads/2011/08/tmp6984_thumb2_thumb.png)
![tmp69-85_thumb[2] tmp69-85_thumb[2]](http://what-when-how.com/wp-content/uploads/2011/08/tmp6985_thumb2_thumb.png)
![tmp69-86_thumb[2] tmp69-86_thumb[2]](http://what-when-how.com/wp-content/uploads/2011/08/tmp6986_thumb2_thumb.png)
![tmp69-87_thumb[2] tmp69-87_thumb[2]](http://what-when-how.com/wp-content/uploads/2011/08/tmp6987_thumb2_thumb.png)
![tmp69-89_thumb[2] tmp69-89_thumb[2]](http://what-when-how.com/wp-content/uploads/2011/08/tmp6989_thumb2_thumb.jpg)
![tmp69-90_thumb[2] tmp69-90_thumb[2]](http://what-when-how.com/wp-content/uploads/2011/08/tmp6990_thumb2_thumb.jpg)
![tmp69-91_thumb[2] tmp69-91_thumb[2]](http://what-when-how.com/wp-content/uploads/2011/08/tmp6991_thumb2_thumb.jpg)
![tmp69-92_thumb[2] tmp69-92_thumb[2]](http://what-when-how.com/wp-content/uploads/2011/08/tmp6992_thumb2_thumb.jpg)
![tmp69-93_thumb[2] tmp69-93_thumb[2]](http://what-when-how.com/wp-content/uploads/2011/08/tmp6993_thumb2_thumb.jpg)
![tmp69-96_thumb[2] tmp69-96_thumb[2]](http://what-when-how.com/wp-content/uploads/2011/08/tmp6996_thumb2_thumb.jpg)
![tmp69-99_thumb[2] tmp69-99_thumb[2]](http://what-when-how.com/wp-content/uploads/2011/08/tmp6999_thumb2_thumb.png)
![tmp69-100_thumb[2] tmp69-100_thumb[2]](http://what-when-how.com/wp-content/uploads/2011/08/tmp69100_thumb2_thumb.png)
![tmp69-101_thumb[2] tmp69-101_thumb[2]](http://what-when-how.com/wp-content/uploads/2011/08/tmp69101_thumb2_thumb.png)
![tmp69-102_thumb[2] tmp69-102_thumb[2]](http://what-when-how.com/wp-content/uploads/2011/08/tmp69102_thumb2_thumb.png)
