Abstract
The bulge test is a versatile and reliable way to determine mechanical properties of thin films. It can be applied to obtain constitutive equations of the material at different ranges of deformation including time effects. It provides a biaxial state of stresses that is the prevailing condition in thin film operate. In this paper the bulge test information is retrieved with interferometric nano-moire.
A special set up was designed and built to pressurize a membrane in the platina of a conventional metrological microscope. The utilized field of view is 326 x 326 microns and the spatial resolution is 318 nanometers, the depth information is within 10 nanometers. An aluminum foil was cemented to a plate that has a circular aperture of 10 mm. The foil was inflated to 3.5 psi at 0.5 psi intervals and images were recorded at each pressure level. Local properties of the deformed surface were compared with the results of the membrane theory by determining from the experimentally measured values the surface trend. The comparison shows that the membrane takes the parabolic trend with maximum observed deviation of 43 nm. At the testing pressure of 3.5 psi the calculated radius of curvature from the surface trend is 96.8 mm, while the theoretical radius of curvature according to the geometry and material properties of aluminum foil is 96.3 mm.
Introduction
The bulge test can be considered as one of the most versatile and reliable tests to determine mechanical properties of thin films. It can be applied to obtain the elastic modulus of thin film, get the yield stress, and the fracture toughness. It can be utilized also to determine residual stresses, cyclic stress-strain behavior and time dependent behavior. The preparation of the sample is relatively simple when compared to the micro-bending and micro-tension specimens. Furthermore it provides a biaxial state of stresses and can be utilized to obtain properties of anisotropic materials. Combining the bulge test with interferometric nano-moire makes possible to measure the constitutive equations of thin films at the sub micron and micron range. Interferometric nano-moire utilizes a diffraction grating illuminated with angles of inclination beyond total internal reflection to generate fringes that encode the displacement information of the thin membrane.
There are two aspects of this characterization that are very important. The first deals with how to successfully apply the bulge test so that the desired information can be obtained. The bulge test assumes that a thin film can be loaded in a pure membrane state. This model has limitations that arise from the actual geometry of the surface and the presence of residual stresses in the film. It is necessary to develop the adequate continuum mechanics models to get the correct information. The phenomena related to the geometry and the residual stresses are local and in order to observe them it is necessary to have a large spatial resolution. In order to carry out these developments successfully it is necessary to begin with a well established material with known properties. Aluminum foil was chosen for the preliminary test to observe the local phenomena. A special set up was designed and built to pressurize a membrane in the platina of a conventional metrological microscope.
Goal of the research effort
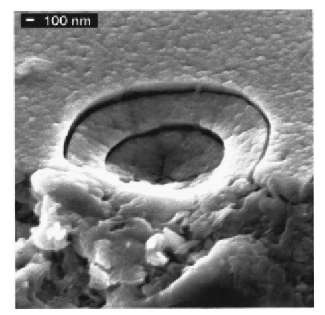
The main objective of the research presented in this paper is to measure the mechanical properties of sculpted thin films (Parelene-C) created by Penn State University. These nanoengineered thin films are assemblies of parallel columns created in a variety of shapes. STFs control the polarization state and frequency band of light impinging on them. Chiral polarizers offer promise for use in voltage monitoring devices, temperature and pressure sensors, and gyroscopes for in-flight guidance. Chiral polarizers may also prove useful in the design of low-cost, high-efficiency lasers, light filters, light modulators, and optical sensors. Micoscale STFs can be also useful of acoustics. At this point what is not well understood is at what stage the stresses influence the degradation of the optical and acoustical properties. There are no simple methods available to obtain their mechanical properties, and without that knowledge their deployment for several applications (e.g., highly accurate sensors in MEMS) remains unexplored. When the STFs are subject to Nano-indentation the material gets damaged (Figure 1) because of the high concentration of forces experienced at the tip. As a result this method is not a viable way to measure constitutive properties.
Figure 1. Damage to a chiral STF by the application of 30 micro Pascal pressure
Utilization of interferometric nano-moire enables the measurement of the constitutive equations for the STF at the sub micron and micron range because it is non-contact. This method utilizes diffraction grating illuminated with angles of inclination beyond total internal reflection [1]. The advantage of this method is that near field phenomena are seen using a conventional far field microscope. This method was used to observe nano crystals, with the accuracy of plus minus 5 nanometers [2].
Tests of mechanical properties of thin films
There are a large number of references on testing thin films and the determination of their mechanical properties. Basic experimental set ups for uniaxial testing are not too different from the macro arrangements. However, critical issues arise when the dimensional scales are reduced as in this case. Typical problems that arise are: sample handling, specimen alignment, accurate strain and force measurements. In 1994 a review paper by Brotzen [3] covered the initial history of uniaxial testing and the state of the art to that date. Since this review paper, advances in all the above critical areas were achieved. Read et al [4] are credited with the fabrication of free standing specimens. Current state of the art for micro-size specimens is found in [5]. Another method that has been extensively used and is still used in many thin film studies is the bulge test that can be traced back to [6]. Two geometries have been used, the circular plate and the rectangular plate. A review of the methodology of the bulge test can be found in [7], and [8]. The bulge test will be utilized for a portion of our experimental testing.
There is one type of test that is perhaps the most utilized today in thin films, the indentation test. Commercially equipment is available to perform the indentation test. The indentation test is not a direct measurement of mechanical properties; it does not provide the same information than one can obtain applying the technology of materials testing. The obtained results are subjected to interpretation and advanced mechanics analysis is required to derive material properties on the basis of the indentation response. Numerous models were developed to extract the material properties from the recorded indentation load-depth curve, including the elastic modulus, yield stress, strain hardening coefficient, residual stress, fracture toughness, etc. A review of this methodology can be found in [9].
Of the described tests the bulge test is the one that is more apt to determine the mechanical properties of the STFs that will be studied in this project. As shown in Figure 1 the indentation test cannot be applied to this type of thin films. The bulge test unlike the indentation tests provides a direct measure of the mechanical properties furthermore combined with numerical techniques can provide not only the elastic properties of these materials but also the behavior beyond the elastic limit.
Besides testing methodology that was briefly reviewed in the preceding paragraph there is another very important area, the interpretation of the performed tests. The main topics are scale effects in elasticity and plasticity. A discussion of these topics in the context of testing micro specimens can be found in [10] where there is an extensive summary of the results obtained to date. These results provide important insight into size-scale effects on the elastic, brittle, and ductile behavior of micron-sized structures. Finally when a material possesses a high degree of inhomogeneity and anisotropy or undergoes a general state of stress the formulation of constitutive equations is a challenging problem. Continuum mechanics theory states that, regardless of load non-uniformity, material in-homogeneity anisotropy and type of boundary conditions, the structural response is univocally defined by the values of u, v and w-displacements. Therefore, in order to capture local variations in structural response, full-field displacement maps must be available. In fact, strains are just complicated combinations of displacement gradients. Furthermore, stress values are accurate only if the constitutive model is reliable. In view of this, a procedure directly based on displacements seems to be the most straightforward and robust approach to the identification of whatever complex material behavior. Full-field displacement maps can be obtained with a great deal of accuracy by utilizing the powerful optical methodology described in this paper. The measured displacements with the optical techniques will be compared with numerical predictions provided by finite element models in order to identify constitutive behavior of the STFs.
Figure 2 shows a schematic of how the bulge test looks like and some of the important parameters that will be utilized for data analysis.
The reverse engineering problem will be formulated in fashion of an optimization problem where the unknown material properties are included as design variables. The cost function to be minimized is the error functional ® built by summing over the differences between displacements measured experimentally and those predicted numerically.
Measuring the elastic properties (i.e. E and v) of the STFs
Utilizing simple considerations of equilibrium and elementary geometry derivations one arrive to,
In this equation p is the pressure applied to the membrane, ct0 is an initial state of stresses that can be applied to the membrane, h is the deflection of the membrane, t is the thickness of the membrane, E the modulus of elasticity of the membrane, and v is the Poisson’s ratio. Also based on geometrical arguments of the deformation of the membrane one can get,
To get E and v one can use (1) along with optimization techniques.
Set up, pressure test cell
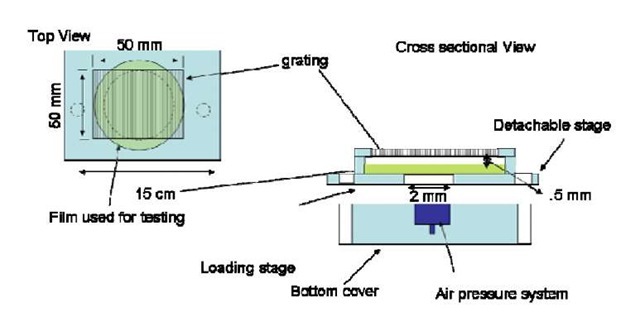
The pressure cell system was designed with a dual purpose: 1) to make global measurements of the membrane deflections, 2) Allow high spatial resolution measurements of the deflections of the membrane. This last requirement means that the set up should be thin enough to be utilized in conjunction with microscopic observation. The dimension of the radius a shown in Figure 3 is dictated by the size of the specimen that can be fabricated, in this case 25 mm. A circular membrane specimen with diameter 10 mm was selected. The membrane is glued to a thin metallic plate. This plate is set in a slot of another metallic plate, Figure 3.
Figure 3. side view of the pressure cell.
Another thin plate is put on top of the membrane to produce the clamping effect; o-rings are added to secure that the pressure cell is sealed. The pressurizing system was designed to produce a minimum measurable pressure p= .05 psi , and has the capability of increasing the pressure within a series of ranges.
Preliminary testing
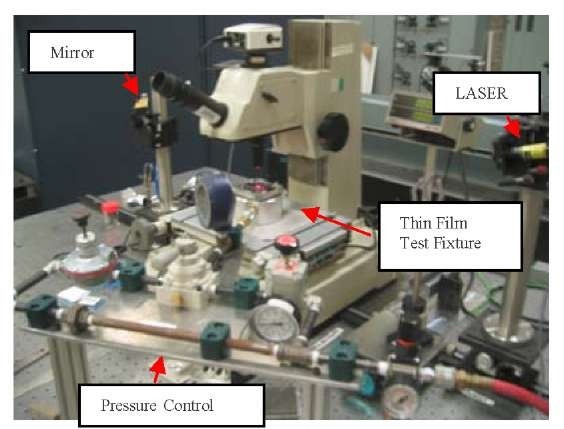
In order to verify the designed testing set up it was necessary to begin with a well established material with known properties. Aluminum foil was chosen for the preliminary test to observe the local phenomena. Figure 4 shows the set up utilized to measure the deflection of the aluminum foil. The first tests were carried out to observe membrane deflections with high spatial resolution, the most challenging part of the project. In order to observe the local phenomena a large magnification is required therefore the setup was designed to accommodate a conventional metrological microscope. For this set up the field of view is 326 x 326 microns and the spatial resolution is 318 nanometers. The depth resolution is 1.25 microns, utilizing interpolation it is possible to resolve up to 30 nanometers.
Figure 4. View of experimental set-up to perform measurements on the thin films
The foil was cemented to a plate with circular aperture of 10 mm. The foil with thickness t= 25 ^m was inflated to 3.5 psi at 0.5 psi intervals and images were recorded at each pressure level. These images were then processed utilizing the Holostrain™ software.
Obtained results
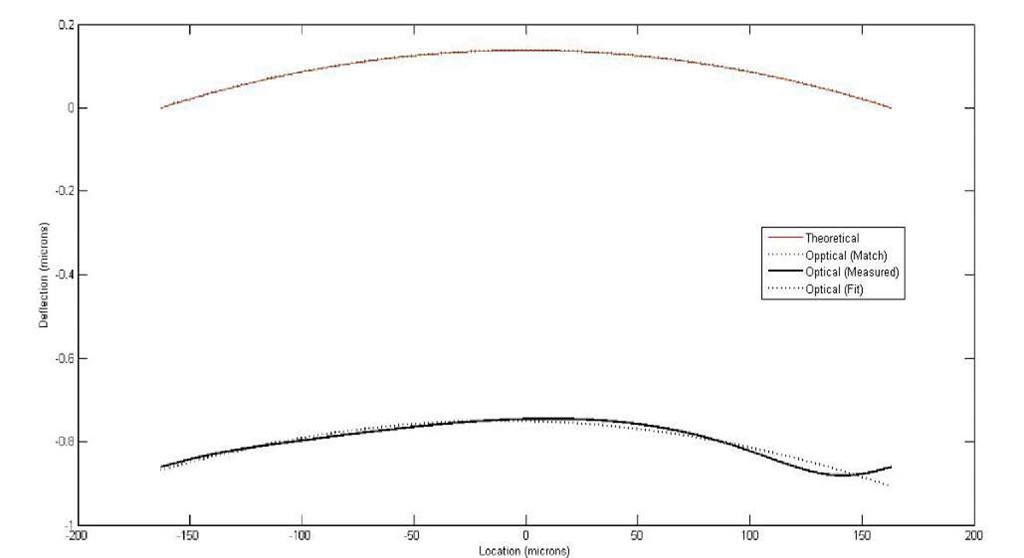
Experimental observations showed that the foil developed wrinkles at lower levels of pressure. This is a phenomenon that occurs when very thin membranes are stretched, local buckling of the membrane is observed. As pressure increased the foil begins to bulge and the membrane takes a parabolic shape. To have an understanding of the observed deflections one has to compare the total diameter of the membrane 10,000 ^m and the observed region with the microscope is only 326 ^m. It should be mentioned that during inflation the portion of the membrane that is observed experiences rigid body displacements and rotations. As a result it was necessary to develop a software routine to match the experimental profile with the expected theoretical profile according to the membrane equation. The trend of the optical profile in the range of observation was determined by assuming a parabolic curve and this trend is shown in Figure 5, where it is compared with the obtained optical profile. Local properties of the deformed surface were compared by extracting the values of curvature. At the pressure of 3.5 psi the calculated radius of curvature is 96.8 mm, while the theoretical radius of curvature according to the geometry and material properties of aluminum foil is 96.3 mm. This means that the error in curvature is only 0.5%. In principle, the carried out preliminary study demonstrates the feasibility of utilizing this set up for determination of thin film constitutive behavior and at the same time observe the actual local effects in the membrane.
Figure 5. Matching of optical surface profile to a parabolic trend. Actual local deviations can be observed but they are at the submicron range. The upper curve shows the matching of profiles after the trend is rigidly roto-translated to match the theoretical membrane results.
Figure 5 shows the obtained membrane profile compared to the theoretical membrane deflections, one should understand that this comparison is between the trend of the membrane and the theoretical values corresponding to the membrane equation and not with the local shape of the membrane. As shown in Figure 5 the local profiles show deviations with respect to the surface trend, the best parabolic fit of the profile. The maximum deviation is at the right end of the plot and is 43 nm.
Conclusions and discussion
The inflation test has been successfully applied to a thin film of aluminum (t= 25 ^m). The deflections of the membrane agree well with the predicted deflections utilizing the membrane equation with the properties of the aluminum foil, E=68.971 GPa and v=0.33 and the level of stress c = 34.485 MPa which is practically the yield
stresses of the aluminum foil. The evanescent illumination has made it possible to observe the membrane deflections under the very tight conditions of the microscopic observation and the experienced rigid body motions.
Figure 6. Comparison of theoretical and experimental trend of the membrane profile.
In Figure 6 it is possible to see that the trend of the membrane agree well with the theoretical predictions, however at the nanometric level the shape of the membrane shows local deviations with respect to the trend as it should be expected, the maximum observed is 43 nm. It should be understood that this value represents a deviation of the trend. Below the applied pressure the local deviation of the membrane is considerably larger. It shows that at yielding the plastic deformations tend to produce a smoothing of the membrane shape. At yielding the membrane adopts the parabolic shape predicted by the membrane equation of Continuum Mechanics.


