Introduction to Geocoding and Mapping
This is a reference topic for how to do Geographic Information Systems or GIS. So right away you have learned something you might not have known before reading this topic—what the letters G, I, and S stand for in the acronym GIS. Of course, as with a lot of literal definitions, knowing what words the letters stand for does not really convey much new knowledge. The next question is, What do GIS techniques give us that we do not already have?
GIS is a methodological and conceptual approach that allows for the linking together of spatial data, or data that is based on a physical space, with non-spatial data, which can be thought of as any data that contains no direct reference to physical locations. For example, a survey of a representative sample of the population of a city or a nation is an example of non-spatial data. We have selected a sample (usually based on geographic location) of individuals who give us answers on survey questions which we have recorded. We can analyze the percentage of our sample that voted for a Republican presidential candidate, the percentage that take public transit to work, or the proportion that are married, single, or divorced. However, we do not know anything about where these respondents are located in the physical world, other than as a sample representing the U.S. population.
Suppose we add a question to the survey that asks each respondent to name the cross street nearest to their place of residence, including the name of the city and the zip code if we can get it. Now we can locate these respondents in geographic space—this is an example of a piece of spatial data. By including such a question, we have transformed our survey from a non-spatial data into spatial data.
Why would we want to do this? First, once we have the ability to locate a subject in physical space, we can create maps of our survey data. Maps are often a powerful way of displaying data in an interesting and compelling way—much more so that a dry and boring table. Figure 1.1 is a display of some data for each state in the United States; among the data shown here is the membership in the U.S. Census Bureau’s sub-region classification system for each state, given in Column D.
Figure 1.1 A Microsoft Excel spreadsheet
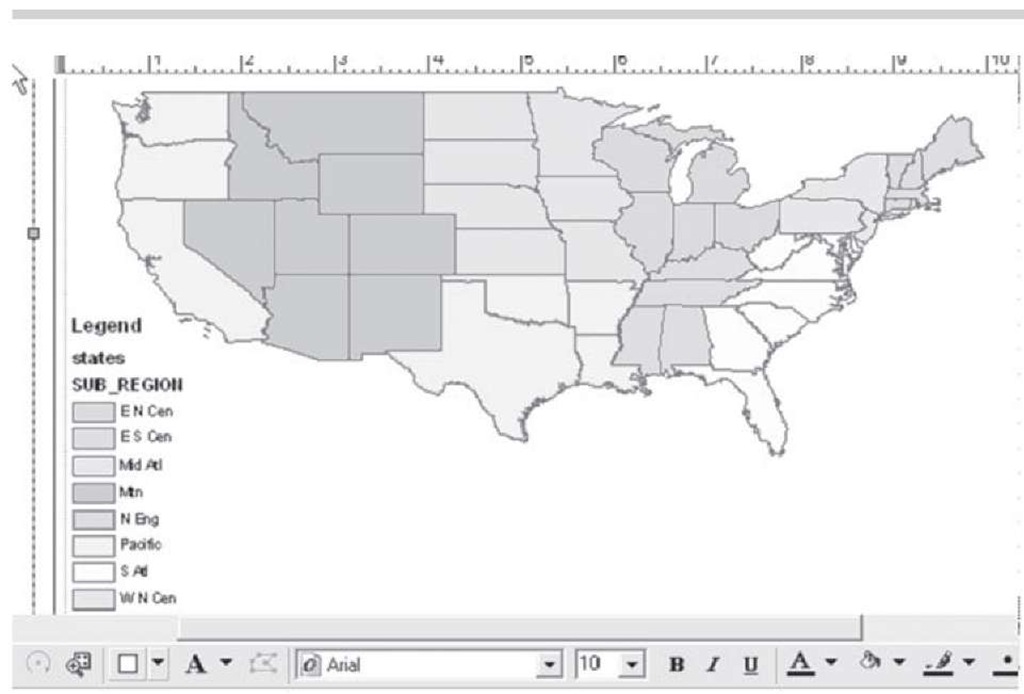
These data are spatial data because we can link the data, in this case what sub-region a state belongs to, to the physical location of the state in the United States. Displaying the same information in a map is more pleasing to the eye and better conveys the meaning of this particular piece of information, as shown in Figure 1.2.
Figure 1.2 Census Bureau sub-regions of the United States; a layout view.
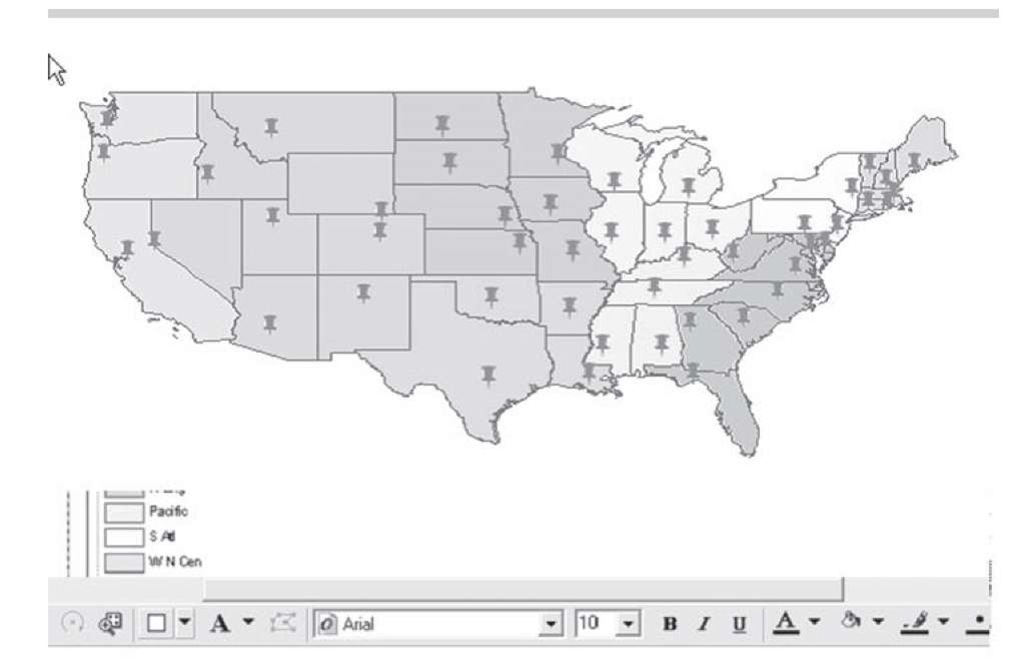
A pin map is a geographic display of the location of a type of activity, organization, or event of interest to the map maker and the map viewers. The reference to the name comes from the fact that before computerized maps, you could make one of these displays by attaching a map to a wall and then pushing pins into the map at the location of each event, organization, or activity. For example, in Figure 1.3 we have a pin map of the United States, with a pin displayed on the map at the location of the capital city of each state.
Figure 1.3 A pin map of the State capital cities in the continental United States


