ABSTRACT
In order to validate an existing energy-based fatigue life prediction understanding, the strain energy accumulation for interrupted loading cycles was analyzed. The life prediction method being validated was developed based on the understanding that strain energy density accumulated during monotonic fracture is a physical damage quantity that is equal to total cumulative hysteresis strain energies in a fatigue process. If this understanding is true, it is possible to suspend cyclic loading for long periods during a fatigue procedure, and then resume the procedure to failure, resulting in the same fatigue life as if the fatigue test was conducted continuously to failure. This assumption, along with critical analyses such as surface roughness and loading frequency, is tested empirically on Titanium 6Al-4V (Ti64) axial tension-compression specimens in the lifetime regime of 5×10³ and 6×10⁴. The failure results are compared, with encouraging results, to the aforementioned energy-based prediction method, thus validating the theory and the prediction capability.
INTRODUCTION
Fatigue life behavior is one of the most critical material properties required for gas turbine engine component design. The widely used design tools for characterizing fatigue life are the modified Goodman diagram and a Stress versus Fatigue Life (S-N) curve [1, 2]. For an accurate characterization of fatigue life, tens to hundreds of experimental results are required to construct Goodman diagrams and S-N curves. Depending on the desired lifing limit, significantly long time periods could be necessary to gather these experimental results. Therefore, a fatigue life prediction method that would require considerably less data and time than conventional empirical fatigue data would be an improvement to the aforementioned design tools.
In order to reduce the amount of empirical data necessary to construct a fatigue life design tool, the discovery of a physical fatigue damage quantity was required. The simplest way to attain a damage quantity that is cumulative with fatigue cycles is by exploring the correlation between fatigue life and energy. This correlation was studied as early as 1923 by Jasper [3]; however extensive/successful research on energy/failure correlation was not conducted until the second half of the 20th century. In 1955, Enomoto validated that under cyclic loading there exists a critical energy value where failure occurs, thus validating the existence of a physical damage quantity for fatigue [4]. This critical energy value was defined in later research efforts as the following: the accumulation of hysteresis plastic energy during fatigue, and the strain energy accumulated during monotonic fracture [5, 6, 7]. Both of these physical damage quantities have been used to predict fatigue life of materials such as steel, aluminum and 60Sn/40Pb solder [8, 9, 10, 11]. Also, modifications to the method proposed by Stowell has provided an energy-based fatigue life prediction method capable of determining fatigue life of uniaxial bending and tension-compression at various stress ratios [12, 13]
Based on the definition of the fatigue life damage quantity, it is fair to say that cumulative hysteresis damage is irreversible; thus, if cyclic loading is suspended for a significant time frame during fatigue testing, fatigue life will not be affect. This theory was tested for uniaxial tension-compression loading of Ti64 at two distinct fully-reversed stress amplitude values. Also analyzed was the acceptability of the variation in the empirical fatigue life results associated with each of the two stress amplitudes. The results of the finding are presented in the proceeding sections.
EXPERIMENTAL PROCEDURE
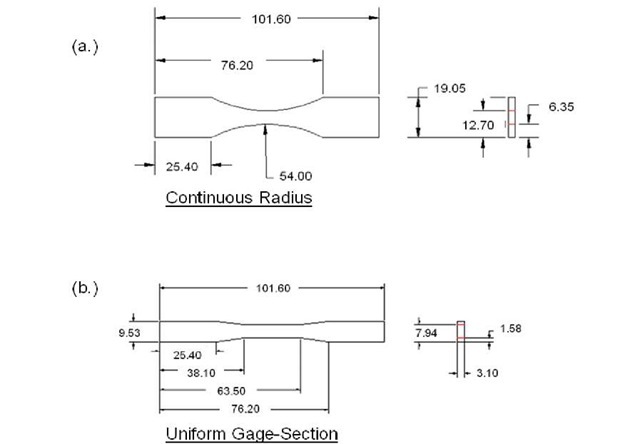
Cyclic loading experiments on Ti64 were conducted on two different specimens: (1) a continuous radius specimen and (2) a uniform gage-section specimen, both shown in Figure 1 [14]. The continuous radius specimen is used for acquiring fatigue results because it is less susceptible than the uniform gage-section specimen to buckling at higher compressive stress magnitudes. The uniform gage-section, however, is more compatible with a MTS (Material Testing Systems) 634.12E-24 model extensometer because they both have the same gage length (25.4mm); thus, it is used for low frequency, cyclic testing to acquire precise hysteresis stress-strain results.
Both the continuous radius and the uniform gage-section specimens were machined via waterjet on a 3.175mm thick Ti64 plate, where the geometry is based on recommendations from ASTM E466 standard for load controlled fatigue testing [14]. The chosen grain direction of each specimen was designated to be perpendicular to the eventual loading axis. No delicate post-machine polishing or stress relieving procedure was conducted on any specimen after the waterjet cut. The effect of this decision is analyzed later in the manuscript.
The fatigue tests were conducted on an axial MTS servohydraulic load frame with a 100KN load capacity. The load frame was controlled using a MTS TestStarIIs model controller, which stores load, displacement, and also strain via a MTS 634.12E-24 model extensometer mounted on the specimen; however, the only data required by the TestStarIIs during fatigue testing was load amplitude and cycles to failure. The tension-compression loads applied during the cyclic tests were fully-reversed at an operating frequency between the range of 5-15Hz, where the frequency is chosen based on the allowable stroke distance and load amplitude of the 100KN load frame performance chart [15].
Low frequency, cyclic tests were conducted on the same 100KN MTS load frame as the fatigue tests. The tension-compression loads applied during the cyclic tests were fully-reversed at an operating frequency of 0.1Hz. This frequency was chosen because it provides the optimal rate for accurate hysteresis strain energy calculation without the effects of anelasticity [16]. The TestStarIIs controller was used to acquire time, load, strain and displacement data during testing at a rate of 2 points per second, which is 20 points per cycle.
Monotonic fracture results are a critical part of the energy-based life prediction method. These results were attained from specimens that were waterjet cut, with no post-machine polishing or stress relieving procedure, from a 3.175mm thick Ti64 plate according to the recommendations by ASTM E8 standard for tension testing of metals [17]. Tests were conducted on the 100KN MTS load frame. Experiments were carried out at a displacement control rate of 0.0254 mm/sec. Data was acquired at a rate of 0.5 data points per second.
Figure 1. ASTM fatigue specimen dimensions (mm): (a.) Continuous radius, (b.) uniform gage-section.
FATIGUE LIFE ANALYSIS
Unlike Aluminum 6061-T6 results from previous research [12, 13], Ti64 has a wide fatigue life scatter. Therefore, the effects of several material behaviors and trends, due to test setup, on fatigue life were analyzed. Though most of these trends were previously observed for Al 6061-T6, it was important to show that the material behavior of Ti64 showed a consistent scatter and validated irreversible plastic energy accumulation during cyclic loading.
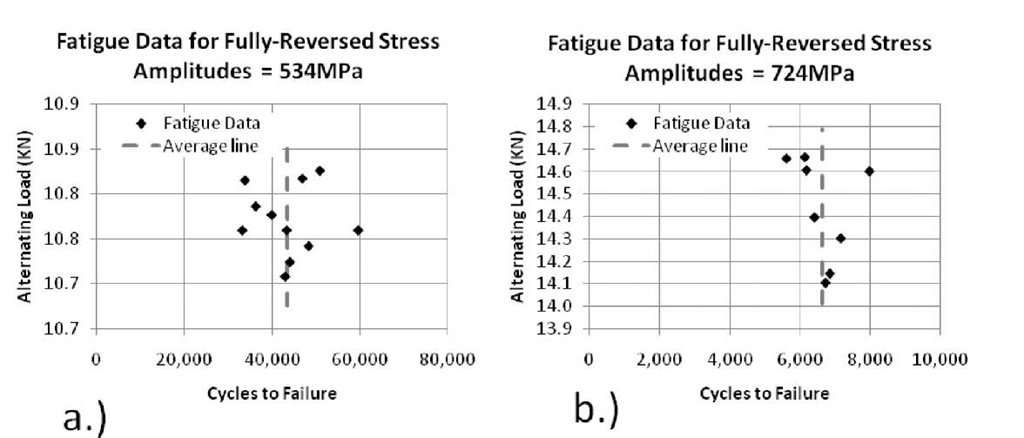
Frequency Effect: The first testing effect observed was the MTS load frame frequency versus fatigue life. This effect was observed for the fully-reversed stress-amplitudes of 534MPa and 724MPa. These stress levels were chosen for two reasons: 1.) the values were high enough to avoid the region where the endurance limit phenomenon occurs, and 2.) time constraints prevented testing the theory of irreversible cumulative hysteresis damage at higher cycle counts. The energy-based life prediction calculation determined that the expected life for stress-amplitudes of 534MPa and 724MPa was approximately 4600 and 39000 cycles, respectively, and it was assumed that fatigue failure of each stress level would occur around those values regardless of the loading frequency. The analyzed frequencies were 15Hz, 10Hz and 5Hz for 534MPa, and 10Hz and 5Hz for 724MPa. These frequencies were chosen based on the allowable stroke distance of the 100KN load frame performance chart [15]. The result for each stress level is shown in the plots of Figure 2. Also, statistical results are shown in Table 1. Though the results of this analysis shows a wide scatter, primarily the 18% relative standard deviation of the 534MPa results, there is no noticeable trend based on loading frequency. Therefore, fatigue results at stress amplitudes above 700MPa, which are run at 10Hz or less, can be plotted with fatigue results at stress levels below 500MPa, which are conducted at 15Hz.
Figure 2. Frequency versus failure cycles: a.) 534MPa and, b.) 724MPa.
Table 1. Statistical results of frequency effect.
|
|
534MPa |
724MPa |
|
Lifetime STD = |
7859 |
724 |
|
Lifetime Mean = |
43545 |
6643 |
|
Rel. STD (%) = |
18.05 |
10.91 |
Load Effect: The applied stress amplitude for fatigue experiments are determined by measuring the cross-sectional area of the specimen being tested. Based on variation with the waterjet machine tolerance (+/-0.127mm), the +/- 0.2032mm manufacturer tolerance of the Ti64 plate thickness and slight variance in hand measurements, the possibility of a fatigue life trend with respect to the applied load amplitude was likely. This trend was observed for 534MPa and 724MPa. The graphical observation is shown on the plots of Figure 3, and the statistics are in Table 2. Like the frequency effect analysis, these results cannot verify that there is a fatigue life trend based on loading values.
Figure 3. Load amplitude versus failure cycles: a.) 534MPa and, b.) 724MPa.
Table 2. Statistical results of load effect.
|
|
534MPa |
724MPa |
|
Load STD (KN) = |
0.039 |
0.231 |
|
Load Mean (KN) = |
10.77 |
14.44 |
|
Rel. STD (%) = |
0.358 |
1.599 |
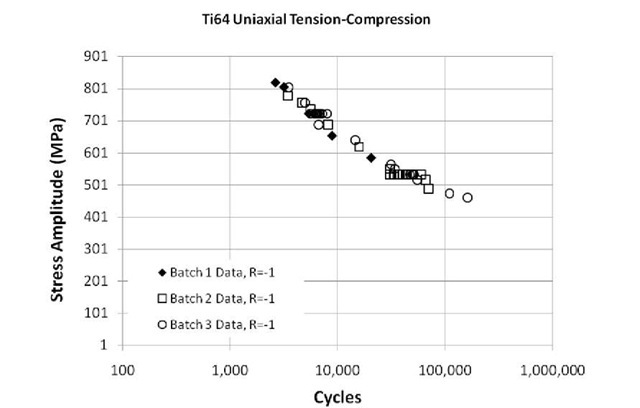
Surface Roughness Effect: Ti64 is a more sensitive material than Al 6061-T6, which is the material the energy-based life prediction method was developed upon. Though previous research shows there is no correlation between fatigue performance and surface roughness, this analysis was conducted by comparison with two post-machining surface polishing techniques and does not regard a non-polished surface roughness [18]. Since there is no post-waterjet polish or LSG (Low Stress Grind) process for the fatigue specimens in this study, the surface roughness of each specimen have a higher probability of lacking consistency. Furthermore, handling the specimens (delivery, storage, etc.) could also induce unwanted residual stresses. Therefore, fatigue results of the three different batches of Ti64 specimens were compared; note, the batches are from the same Ti64 plate stock and are designated as specimens machined at three different times. The results, which are compared on the S-N plot of Figure 4, show a consistent trend for fatigue behavior.
Figure 4. Fatigue results for Ti64.
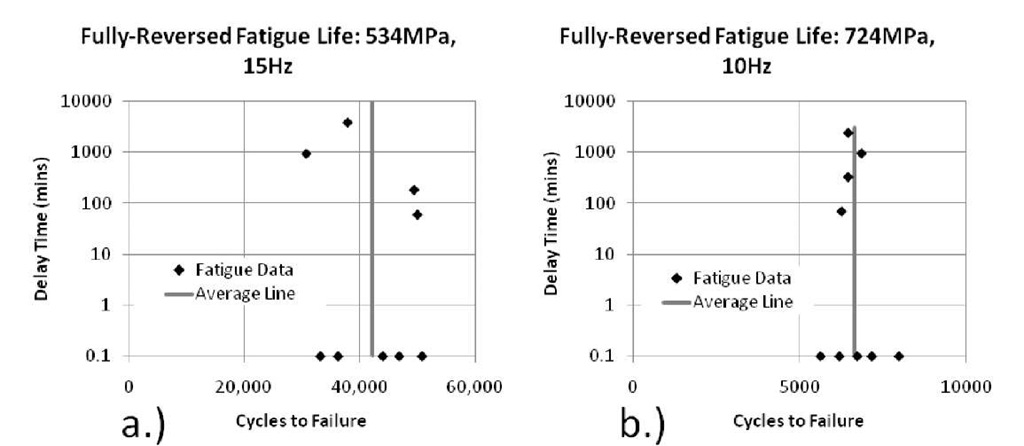
Loading Delay Analysis: Previously stated, the energy-based fatigue life prediction method was developed based on the understanding that a physical damage quantity exists for fatigue failure. The damage quantity is accumulated plastic strain energy from hysteresis loading, which is irreversible. In order to validate this understanding, fatigue analysis was conducted at the same stress amplitude values used in the previous analysis (534MPa and 724MPa). The scope of the analysis was to see if suspending cyclic loading during fatigue testing would affect fatigue life. The analysis was conducted to answer two key questions: 1.) will suspending cyclic loading present a noticeable trend between fatigue life and loading delay time, and 2.) will the fatigue life results from the delayed tests fall within the scatter of continuous cyclic loaded fatigue results? To answer the first question, empirical Ti64 results were viewed on the plots of Figure 5 for 534MPa and 724MPa. The results show no trend for both stress levels and minimal variation at 724MPa.
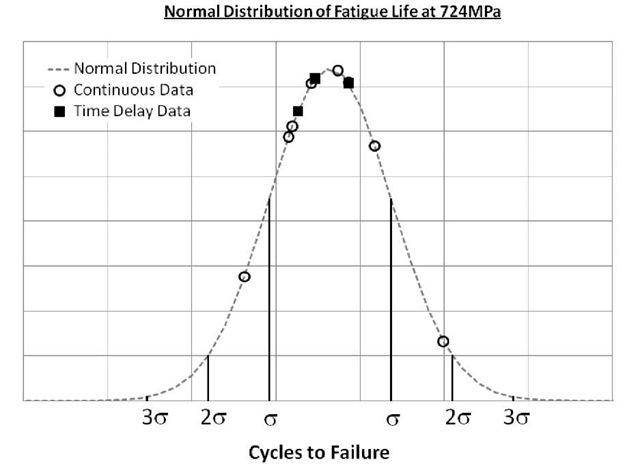
In order to see if fatigue life results fell within acceptable Ti64 scatter, all fatigue data was plotted on the normal distribution constructed by fatigue data of continuous cyclic loading results [19]. Since fatigue life shows no noticeable trend with respect to loading frequency, fatigue data at different frequencies were used in the construction of the normal distribution. The results for both stress levels are shown on the plots of Figure 6 and 7. Both stress levels show that all but one of the time delayed fatigue life data falls within one-sigma of the distribution. Therefore, this validates that suspending cyclic loading for significant time frames during fatigue testing will not affect fatigue life and the notion of a physical damage quantity for fatigue still holds true.
Figure 5. Ti64 fatigue life comparison with load delays: a.) 534MPa and, b.) 724MPa.
Figure 6. Normal distribution of fatigue life at 534MPa.
Figure 7. Normal distribution of fatigue life at 724MPa.
ENERGY-BASED LIFE PREDICTION
Data from the fatigue analysis section is used here to validate the capability of the energy-based fatigue life prediction method. This method was developed from the stress-strain representations of Equation (1) – (3) [7, 12]. Equation (1) represents the monotonic stress-strain relationship, Equation (2) represents the expression for the parameter ao in Equation (1), and Equation (3) is the expression for the cyclic strain. Equation (3) was created based on a simplified coordinate system, where the horizontal versus vertical axes represents peak-to-peak strain versus peak-to-peak stress, respectively. On this coordinate system, shown in Figure 8, the origin is defined as the minimum fully-reversed point of a hysteresis loop; in other words, both the stress and the strain values are read from zero to peak-to-peak magnitudes.
The parameters for Equation (1) – (3) are defined as follows: cris the nominal applied monotonic stress value, s is the strain corresponding to the applied monotonic stress, app is the generalized/peak-to-peak stress value corresponding to the generalized/peak-to-peak cyclic strain scycie (2aa replaces app in Equation (3) after all necessary derivations), af is the fracture stress, sf is the ductility, ay is the yield stress, E is the modulus of elasticity, and the variables ctc, ct0, so, and C are curve fit parameters [12]. The curve fit parameters for the cyclic and monotonic representations are statistically acquired by comparison between the equations and the respective experimental results [20, 21].
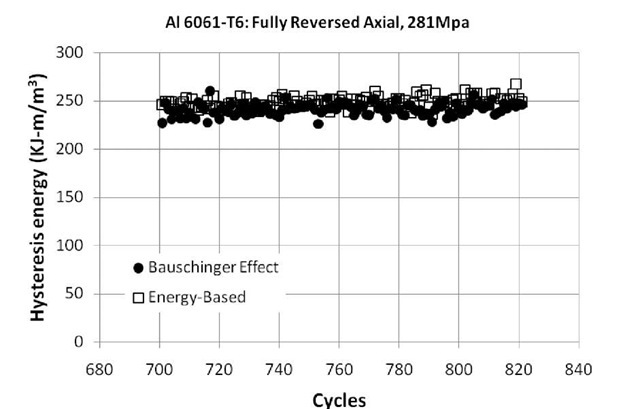
The energy-based prediction method calculates fatigue life by dividing the total monotonic strain energy density by the strain energy density for one cycle. The total strain energy density accumulated during a monotonic process is determined as the area underneath the curve constructed by Equation (1), and the strain energy density for one cycle is represented by the area within the hysteresis loop formed by Equation (3). Calculating the monotonic strain energy density from experimental results is a straightforward task, whereas the strain energy density in one cycle is determined by making an assumption that the tensile stress-strain behavior of the hysteresis loop is the same as the compressive behavior. This assumption is a simplification for the strain energy density per cycle calculation because Bauschinger effect shows that the tensile and compressive behaviors in a hysteresis loop are not identical [22]. The resulting hysteresis strain energy regarding the simplification, which is calculated by Equation (4), shows a minor deviation with Al 6061-T6 data when compared with the correlating strain energy that incorporates Bauschinger Effect on Figure 9.
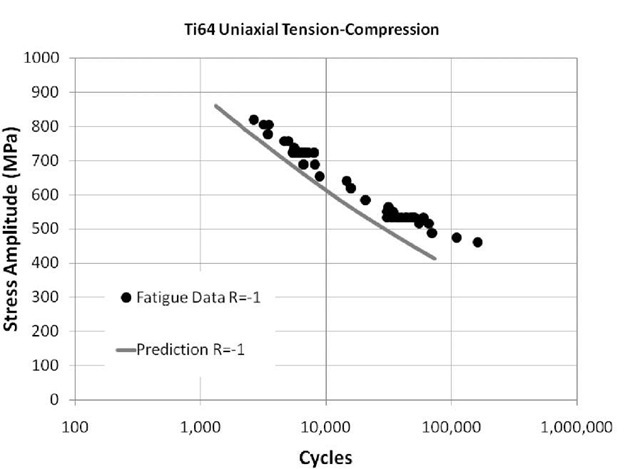
The energy-based fatigue life calculation is represented by Equation (5) [23], where aa is the applied stress amplitude. Using the material parameters in Table 3, Equation (5) results compare well to the empirical Ti64 fatigue results in Figure 10.
Figure 8. Energy-based hysteresis loop schematic.
Figure 9. Hysteresis energy comparison.
Figure 10. Energy-based life prediction comparison for Ti64.
Table 3. Material parameters for Ti64.
|
1.80E+05 |
|
|
113.6 |
|
|
6.94E-10 |
|
|
4.53E-01 |
|
|
345.7 |
|
|
1161 |
|
|
66.24 |
|
|
1029 |
CONCLUSION
It has been proven that hysteresis strain energy density is irreversible due to the analysis showing that suspending cyclic loading during fatigue testing of Ti64 does not affect the expected fatigue life in the lifetime regime of 5×10³ – 6×10⁴. Other effects that do not show a noticeable trend on fatigue life are surface roughness and loading frequency. Although these assumptions, along with the omission of Bauschinger effect, have been used in energy-based theory prior to this manuscript, validating the assumption and constructing a well-compared energy-based life prediction for Ti64 fatigue has been encouraging for the future direction of energy/failure correlation studies.
