Parallel Code Phase Search Acquisition
As seen from Equation (6.1), the amount of search steps in the code phase dimension is significantly larger than that of the frequency dimension (1023 compared to 41). The previous method parallelized the frequency space search eliminating the necessity of searching through the 41 possible frequencies. If the acquisition could be parallelized in the code phase dimension, only 41 steps should be performed compared to the 1023 in the parallel frequency space search acquisition algorithm.
A recent method in GPS signal acquisition utilizes the before-mentioned advantage of parallelizing the code phase search. This method is simply referred to as parallel code phase search acquisition. In the following we describe the theory behind this method.
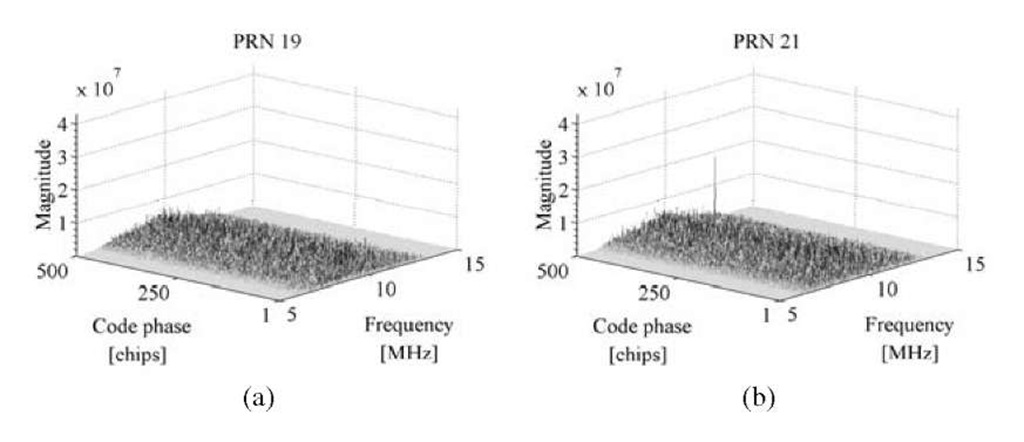
FIGURE 6.7. Output from parallel frequency space search acquisition. The figure only includes the first 500 chip shifts and the frequency band from 5-15 MHz. (a) PRN 19 is not visible so no significant peaks are present in the spectrum. (b) PRN 21 is visible so a significant peak is present in the spectrum. The peak is situated at code phase 359 chips and frequency 9.548 MHz.
The goal of the acquisition is to perform a correlation with the incoming signal and a PRN code. Instead of multiplying the input signal with a PRN code with 1023 different code phases as done in the serial search acquisition method, it is more convenient to make a circular cross correlation between the input and the PRN code without shifted code phase. In the following, a method of performing circular correlation through Fourier transforms will be described.
The discrete Fourier transforms of the finite length sequences x(n) and y (n) both with length N are computed as
The circular cross-correlation sequence between two finite length sequences x (n) and y(n) both with length N and with periodic repetition is computed as
In the following we will omit the scaling factor![]()
The discrete N-point Fourier transform of z(n) can be expressed as
where X* (k) is the complex conjugate of X (k).
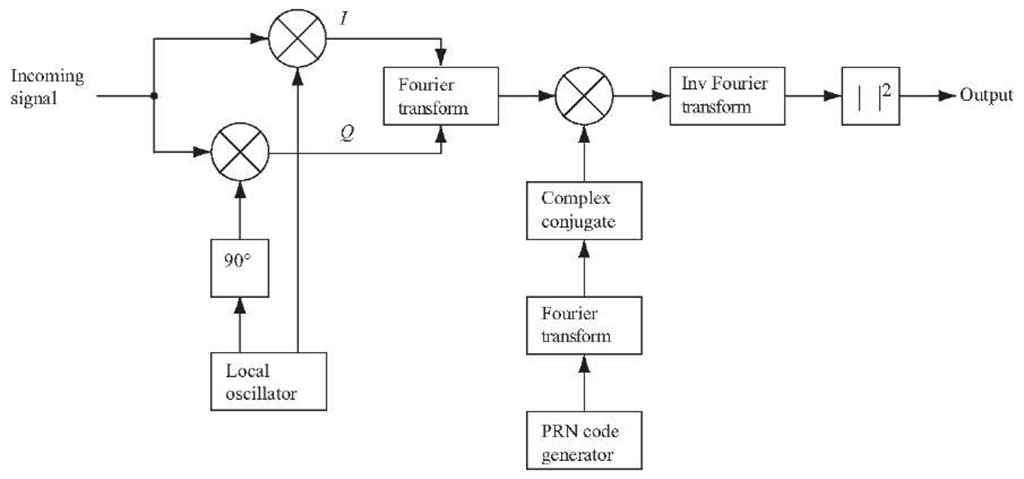
FIGURE 6.8. Block diagram of the parallel code phase search algorithm.
When the frequency domain representation of the cross correlation is found, the time-domain representation can be found through inverse Fourier transform.
Figure 6.8 is a block diagram of the parallel code phase search algorithm. The incoming signal is multiplied by a locally generated carrier signal. Multiplication with the signal generates the I signal, and multiplication with a 90° phase-shifted version of the signal generates the Q signal. The I and Q signals are combined to form a complex input signal![]() to the DFT function.
to the DFT function.
The generated PRN code is transformed into the frequency domain and the result is complex conjugated.
The Fourier transform of the input is multiplied with the Fourier transform of the PRN code. The result of the multiplication is transformed into the time domain by an inverse Fourier transform. The absolute value of the output of the inverse Fourier transform represents the correlation between the input and the PRN code. If a peak is present in the correlation, the index of this peak marks the PRN code phase of the incoming signal.
Compared to the previous acquisition methods, the parallel code phase search acquisition method has cut down the search space to the 41 different carrier frequencies. The Fourier transform of the generated PRN code must only be performed once for each acquisition. For each of the 41 frequencies we perform one Fourier transform and one inverse Fourier transform, so the computational efficiency of the method depends on the implementation of these functions. The accuracy of the parameters estimated by this acquisition method regards the frequency similar to the serial search method. The PRN code phase, however, is more accurate compared to the other methods as it gives a correlation value for each sampled code phase. That is, if the sampling frequency is 10 MHz, a sampled PRN code has 10,000 samples, so the accuracy of the code phase can have 10,000 different values instead of 1023.
In the same way as with the other acquisition methods, the implementation of this one is straightforward, as it can be implemented directly based on the block diagram shown in Figure 6.8.
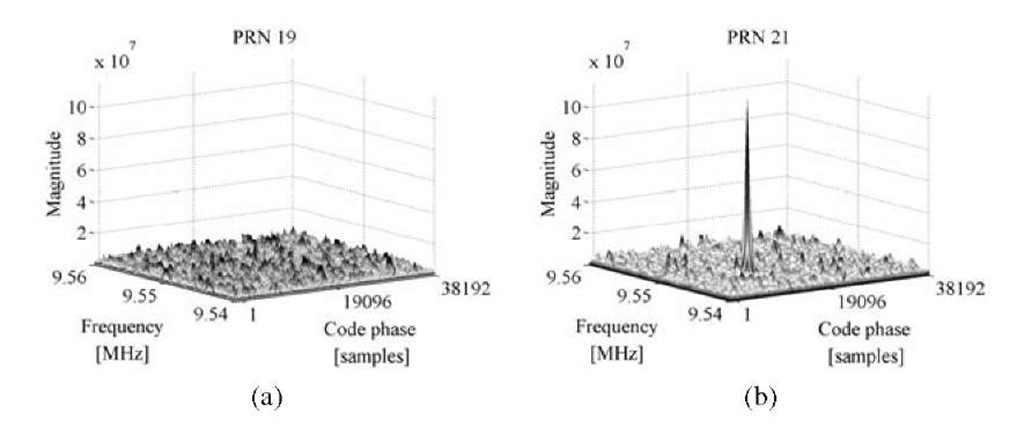
FIGURE 6.9. Output from parallel code phase search acquisition. (a) PRN 19 is not visible so no peak is present. (b) PRN 21 is visible so a significant peak is present. The peak is at code phase 13404 samples and frequency 9.5475 MHz.
As seen in Figure 6.8, this method involves almost no new blocks compared to the previous two. As a result of that, many elements can be reused in the implementation. One difference in this method is that only one PRN code should be generated for each acquisition. That is, it is not necessary to take the 1023 different code phases into account.
The first step is to multiply the incoming signal with a locally generated cosine and sine carrier wave, respectively, giving an I and a Q signal component. These two are combined as a complex input to the Fourier transform. The result of the Fourier transform is multiplied with the result of the lower branch of the block diagram in Figure 6.8. This signal is created as follows.
The PRN generator generates a code with no code phase. As in the implementation of the other acquisition algorithms, the code generation is performed off-line. The next step performs a Fourier transform of the PRN code, and the result is complex conjugated.
The result of the before-mentioned multiplication is given as input to an inverse Fourier transform implemented as the built-in function IFFT in MATLAB. This function has properties similar to the FFT function regarding execution time.
As mentioned in implementation of the parallel frequency space search acquisition method above, the output from an FFT is complex. This is also the case for the IFFT, so the output needs the same processing as in that case. That is, the absolute value is computed for all components. Figure 6.9 shows the output from the parallel code phase space search method.
Data Size
The selection of data size used for acquisition can be based on different criteria. The first issue to consider is the effect of navigation data bit transitions. None of the described algorithms ignores these transitions if they occur during the period of acquisition. So to guarantee optimal performance of the acquisition algorithms, it must be ensured that no data transitions occur in the analyzed data sequence.
TABLE 6.1. Execution time for each of the three implemented acquisition algorithms
|
Algorithm |
Execution time |
Repetitions |
Complexity |
|
Serial search |
87 |
41,943 |
Low |
|
Parallel frequency space search |
10 |
1023 |
Medium |
|
Parallel code phase search |
1 |
41 |
High |
As mentioned earlier, the navigation data are transmitted with a rate of 50 bps. This results in possible data bit transitions every 20 ms. If, for instance, 10 ms of data is used for the acquisition algorithm, it might include a bit transition. In fact, there is almost a 50% possibility that it does include a bit transition. (Not exactly 50% because two consecutive data bits might have identical values.) However, if acquisition is performed on two consecutive sequences, each with the length of 10 ms, at least one of the sequences will not include a data transition.
The second issue to consider when selecting the data size used for acquisition is the probability of making a successful acquisition. This issue can be discussed from the idea that the probability of detecting the correct parameters for a certain satellite increases with the amount of analyzed data.
The third issue is the computational demands as a function of the length of data to be analyzed. This is actually the counterpart to the previous issue, as the computations get slower when the sequence gets longer.
The choice of data size used for acquisition has to be a compromise based on the three issues just described. If the issue with data transitions have to be considered it might be necessary to run the acquisition algorithm twice for each acquisition. To ensure good probability of successful acquisition, the data length cannot be too short. However, it cannot be too long because this will cause the computations to be too heavy and time-consuming.
A compromise that will be used involves a data length of 1 ms for the acquisition algorithms. One ms corresponds exactly to the length of one complete C/A code, so it also simplifies the algorithm, making it unnecessary to duplicate the code. The data length can hardly be shorter, because this would involve correlation with an incomplete code. It could be longer, but as mentioned this would decrease the computational performance of the algorithm. To ensure that satellites will be acquired even though a data bit transition occurs in the analyzed data sequence, the algorithm can be run a second time if the first acquisition is unsuccessful.
Execution Time
As mentioned in the theory behind the acquisition methods, the theoretical performance regarding the computational demands are different between the three methods. So the execution time for each of the three implemented methods will be measured to be used as a parameter for choosing the right algorithm in the receiver.
TABLE 6.2. Results of acquisition of PRN 21 with the three different acquisition algorithms; see captions of Figures 6.3, 6.7, and 6.9.
|
Search algorithm |
Frequency [MHz] |
Code phase |
|
Serial |
9.5475 |
359 chips |
|
Parallel frequency space |
9.548 |
359 chips |
|
Parallel code phase |
9.5475 |
13,404 samples |
The execution time is measured using the tic and toc functions in MATLAB. An average PC (Pentium 4,2.8 GHz) was used for execution time measurements, all measurements are made 10 times, and the mean of these is computed. So the absolute value of the execution times is only approximate as none of these is optimized to run in realtime. The relative measures, however, should indicate which one will have the biggest potential for being implemented in realtime.
The results of the execution-time measurements can be seen in Table 6.1. The table also includes the number of repetitions or combinations the algorithm has to perform and the computational complexity of each of these repetitions.
Note that all relative measures are based on MATLAB performance. Implementation in other languages/environments may change the performance drastically.
Parameter Estimation
Another parameter that could be used for choosing between the three algorithms is the performance regarding precision of the result. The results from acquisition of satellite 25 using the three acquisition algorithms are shown in Table 6.2.
From Table 6.2 it is evident that all algorithms find the right frequency of the signal. The parallel frequency space search algorithm, however, estimates the frequency to be 9.548 MHz compared to 9.5475 MHz estimated by the other two.

![tmp2D822_thumb[2] tmp2D822_thumb[2]](http://what-when-how.com/wp-content/uploads/2012/02/tmp2D822_thumb2_thumb.jpg)
![tmp2D823_thumb[2] tmp2D823_thumb[2]](http://what-when-how.com/wp-content/uploads/2012/02/tmp2D823_thumb2_thumb.jpg)
![tmp2D826_thumb[2] tmp2D826_thumb[2]](http://what-when-how.com/wp-content/uploads/2012/02/tmp2D826_thumb2_thumb.jpg)


