Sampling
A crucial signal processing operation in a GPS or Galileo software-defined receiver is sampling. In the following we briefly review the sampling process.
Consider the signal x (t). Suppose that we sample this signal at a uniform rate— say once every![]() seconds. Then we obtain an infinite sequence of samples, and we denote this sequence by
seconds. Then we obtain an infinite sequence of samples, and we denote this sequence by![]() . where n takes on all integer values. The quantity
. where n takes on all integer values. The quantity![]() is called the sampling period, and its reciprocal
is called the sampling period, and its reciprocal![]() the sampling rate.
the sampling rate.
The sampling operation is mathematically described by
where x(t) is the signal being sampled, and![]() is the sampled signal that consists of a sequence of impulses separated in time by
is the sampled signal that consists of a sequence of impulses separated in time by![]() The term
The term![]() represents a delta function positioned at time
represents a delta function positioned at time![]()
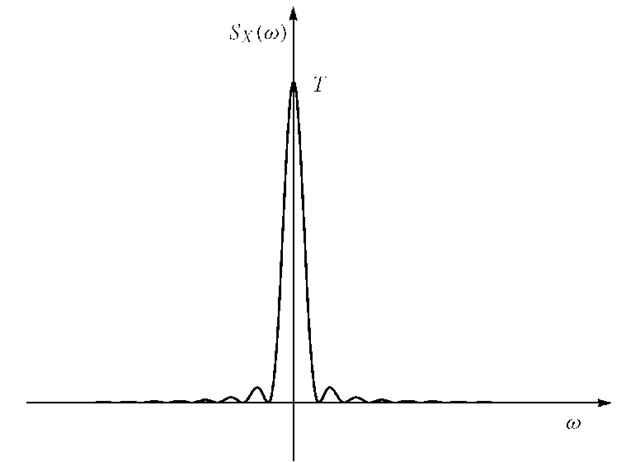
FIGURE 1.6. Power spectral density![]() of a random sequence of pulses.
of a random sequence of pulses.
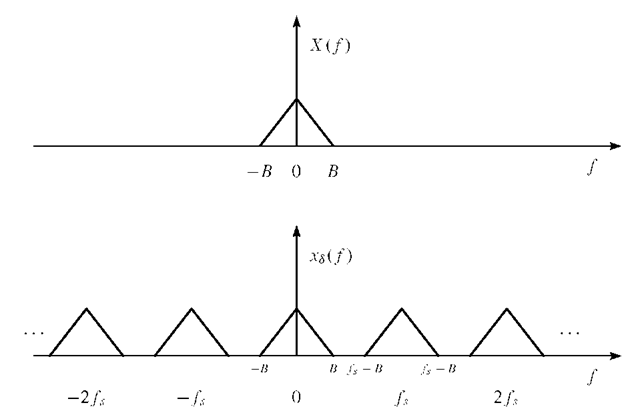
Figures 1.7 and 1.8 show the sampling process in the time and frequency domain, respectively.
Figure 1.8 reveals that if the sampling rate![]() is lower that 2B, then the frequency-shifted components of X (f) overlap and the spectrum of the sampled signal is not similar to the spectrum of the original signal x(t). The spectral overlap effect is known as aliasing, and the sampling rate
is lower that 2B, then the frequency-shifted components of X (f) overlap and the spectrum of the sampled signal is not similar to the spectrum of the original signal x(t). The spectral overlap effect is known as aliasing, and the sampling rate![]() is called the Nyquist rate.
is called the Nyquist rate.
Characterization of Systems
In the continuous-time domain, a system is a functional relationship between the input signal x (t) and the output signal y (t). The input-output relation of a system may be denoted as![]()
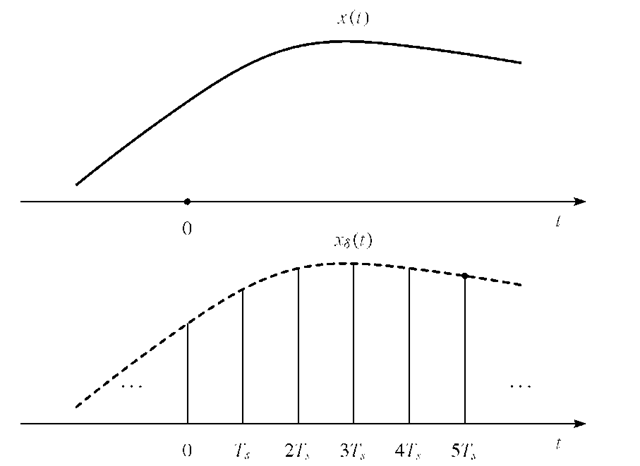
FIGURE 1.7. Sampling operation shown in the time domain. Top: Signal x(t). Bottom: Sampled signal![]()
Figure 1.9 shows a block diagram of a system characterized by a function f and with input signal x (t) and output signal y (t).
By means of the properties of the input-output relationship given in (1.17), we can classify systems as follows:
Linear and nonlinear systems A system is said to be linear if superposition applies. That is, if![]()
Figure 1.9 shows a block diagram of a system characterized by a function f and with input signal x (t) and output signal y (t).
By means of the properties of the input-output relationship given in (1.17), we can classify systems as follows:
then
A system in which superposition does not apply is termed a nonlinear system.
Time-invariant and time-varying systems A system is said to be be time-invariant if a time shift in the input results in a corresponding time shift in the output. That is,
where![]() is any real number. Systems that do not meet this requirement are called time-varying systems.
is any real number. Systems that do not meet this requirement are called time-varying systems.
FIGURE 1.8. Sampling operation shown in the frequency domain. Top: Signal X( f ) with bandwidth B. Bottom:![]()
Causal and noncausal systems A system is said to be causal if its response does not begin before the input is applied, or in other words, the value of the output at![]() depends only on the values of x(t) for
depends only on the values of x(t) for![]() In mathematical terms, we have
In mathematical terms, we have
Noncausal systems do not satisfy the condition given above. Moreover, they do not exist in a real world but can be approximated by the use of time delay.
The classification of continuous-time systems easily carries over to discrete-time systems. Here the input and output signals are sequences, and the system maps the input sequence x(n) into the output sequence y (n).
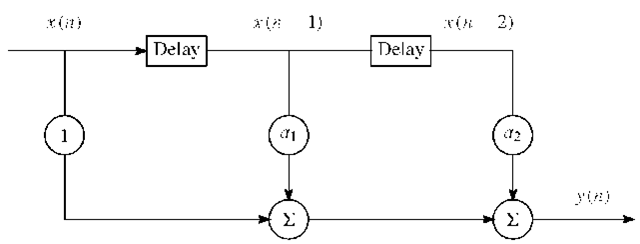
A simple example of a discrete-time linear system is a system that is a linear combination of the present and two past inputs. Such a system can in general be described by
and is illustrated in Figure 1.10.
FIGURE 1.9. Block diagram representation of a system.
FIGURE 1.10. Simple linear system with input-output relation![]()
![]()
Linear Time-Invariant Systems
Let us first consider a continuous-time, linear, time-invariant (LTI) system characterized by an impulse response h(t), which is defined to be the response y(t) from the LTI system to a unit impulse![]() That is,
That is,
The response to the input x (t) is found by convolving x (t) with h (t) in the time domain:
Convolution is denoted by the *. Since![]() for causal systems, we can also write y(t) as
for causal systems, we can also write y(t) as
Define the continuous-time exponential signal![]() From (1.19) we then have
From (1.19) we then have
The expression in brackets is the Fourier transform of h(t), which we denote H (f).
Now define the discrete-time exponential sequence![]() We can then characterize a discrete-time LTI system by its frequency response to x(n). By means of the convolution sum formula, a discrete version of (1.20), we obtain the response
We can then characterize a discrete-time LTI system by its frequency response to x(n). By means of the convolution sum formula, a discrete version of (1.20), we obtain the response
The expression in parentheses is the discrete-time Fourier transform of the impulse response h(n), which we denote![]()
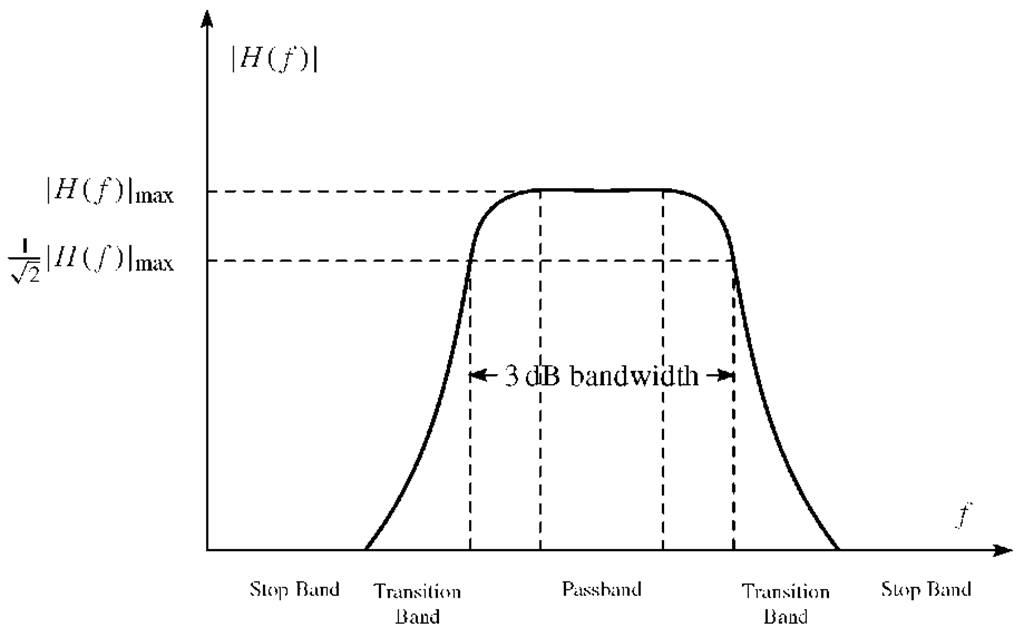
FIGURE 1.11. Parameters of a filter.
The convolution in the time domain corresponds to the multiplication of Fourier transforms in the frequency domain. Thus, for the system under consideration the Fourier transforms of the input and output signals are related to each other by
In general, the transfer function H (f) is a complex quantity and can be expressed in magnitude and angle form as
The quantity | H (f) | is called the amplitude response of the system, and the quantity arg(H (f )) is called the phase response of the system. The magnitude response is often expressed in decibels (dB) using the definition
We mention in passing that in real systems h (t) is a real-valued function and hence H (f) has conjugate symmetry in the frequency domain, i.e.,![]()
The equations above show that an LTI system acts as a filter. Filters can be classified into lowpass, bandpass, and highpass filters and they are often characterized by stopbands, passband, and half-power (3 dB) bandwidth. These parameters are identified in Figure 1.11 for a bandpass filter.
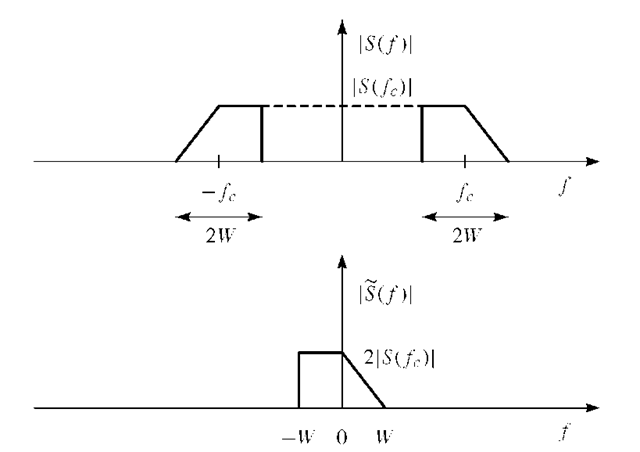
FIGURE 1.12. Magnitude spectrum of bandpass signal s(t) and complex envelope![]()
![tmp2D186_thumb[2][2] tmp2D186_thumb[2][2]](http://what-when-how.com/wp-content/uploads/2012/02/tmp2D186_thumb22_thumb.png)
![tmp2D201_thumb[2][2] tmp2D201_thumb[2][2]](http://what-when-how.com/wp-content/uploads/2012/02/tmp2D201_thumb22_thumb.png)

![tmp2D239_thumb[2][2] tmp2D239_thumb[2][2]](http://what-when-how.com/wp-content/uploads/2012/02/tmp2D239_thumb22_thumb.png)
![tmp2D242_thumb[2][2] tmp2D242_thumb[2][2]](http://what-when-how.com/wp-content/uploads/2012/02/tmp2D242_thumb22_thumb.png)
![tmp2D246_thumb[2][2] tmp2D246_thumb[2][2]](http://what-when-how.com/wp-content/uploads/2012/02/tmp2D246_thumb22_thumb.png)
![tmp2D250_thumb[2][2] tmp2D250_thumb[2][2]](http://what-when-how.com/wp-content/uploads/2012/02/tmp2D250_thumb22_thumb.png)
![tmp2D255_thumb[2][2] tmp2D255_thumb[2][2]](http://what-when-how.com/wp-content/uploads/2012/02/tmp2D255_thumb22_thumb.png)
![tmp2D256_thumb[2][2] tmp2D256_thumb[2][2]](http://what-when-how.com/wp-content/uploads/2012/02/tmp2D256_thumb22_thumb.png)
