Computation of the shift by the ‘inflexion points’ method (Program FLEXPT)
Again the analytical form of the 4th degree polynomial gives a simple expression for the shift measured by this method.
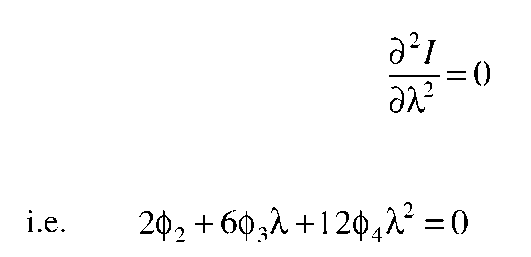
We require for an inflexion point
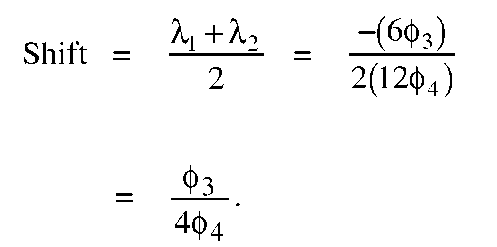
This is a quadratic equation possessing roots and the midpoint of the line joining the inflexion points has a
![]() value of half the sum of the roots.
value of half the sum of the roots.
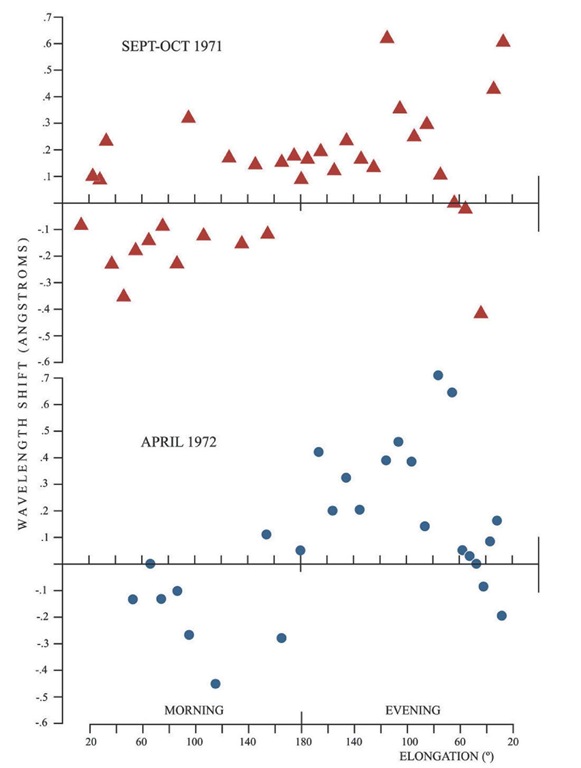
Programs MINIPT and POLYPT were designed to read directly the output cards of LSQFIT, and the values of wavelength shift obtained were plotted against elongation from the Sun. The shifts computed from the minima in the 4th order polynomial fits are shown in Figure 3.15 (overleaf), separately for the two observing periods.
Since 4th order and 6th order fits were available for all averaged scans, the minimum point method was also applied to the 6th order fits, with less success because of the greater risk of ambiguity in the turning points.
Figure 3.15 Wavelength shift estimates from polynomial fits. Plots of line shift vs. elongation using the minimum points of the 4th degree polynomials fitted to the averaged data as a measure of the shifted position. This method is considered unsatisfactory (see text), but it is pleasing to note that the general disposition of the points is quite similar to that found by the Gaussian fits method (see Figure 4.5).
Assessment of these methods
A necessary constraint on any method used to estimate the wavelength of the absorption feature is that it use the information from ALL the points in the optimum way, bearing in mind their various probable errors. It is also essential that the measure be identifiable with a physical quantity calculable from models of the dust cloud. In practice this quantity is the ‘mean shift’
where![]() is the shift due to an element of brightness dB, and the integral is along a line of sight (Bandermann and Wolstencroft 1969; Reay 1969). If the original solar spectrum is symmetrical (a good approximation at 1.5 A resolution) it is easy to show that AX is also in this case identical to the shift of the bisector of the inflexion points, and to the minimum point.
is the shift due to an element of brightness dB, and the integral is along a line of sight (Bandermann and Wolstencroft 1969; Reay 1969). If the original solar spectrum is symmetrical (a good approximation at 1.5 A resolution) it is easy to show that AX is also in this case identical to the shift of the bisector of the inflexion points, and to the minimum point.
Noise in a practical spectrum reduces the reliability of all three methods so far mentioned. The minimum point method depends critically on the accuracy of a few central points, so just a small emission feature, as was sometimes present, can be enough to upset the measure. The inflexion method is sensitive to the outer, more noisy, parts of the spectrum. The method of areas would rely on a good estimate of the continuum level, which again depends strongly on the outer points, which are noisy. A small error in the placing of the filter can produce an apparent asymmetry in the continuum levels to each side of the absorption feature. The results of the methods in practice bear out these comments. The scatter on them all is large, obscuring even the general trends visible to the eye in a casual inspection of the scans, and some results are obviously misleading if reference is made to the curves. For the final analysis, all of these methods were therefore rejected, except for the special cases (see section 4.1) where Gaussian fits could not be effected.
Gaussian curve fitting (Program GAUSSN)
Computation
The method finally adopted was to fit a Gaussian curve
where I1 is identifiable with the continuum level, I2 is a measure of the line depth, k is related to the width of the line, and Xm is the wavelength of the central minimum point of the line. These four parameters correspond to the variables V2, V3, and V4 in program GAUSSN, and in Hicks and Reay (1974). Once the Gaussian curve is fitted to the observations, Xm is the most useful, since the difference between this and the unshifted wavelength, 5183.6 Angstroms, will give us the effective mean wavelength shift (AX) due to theDoppler effect.
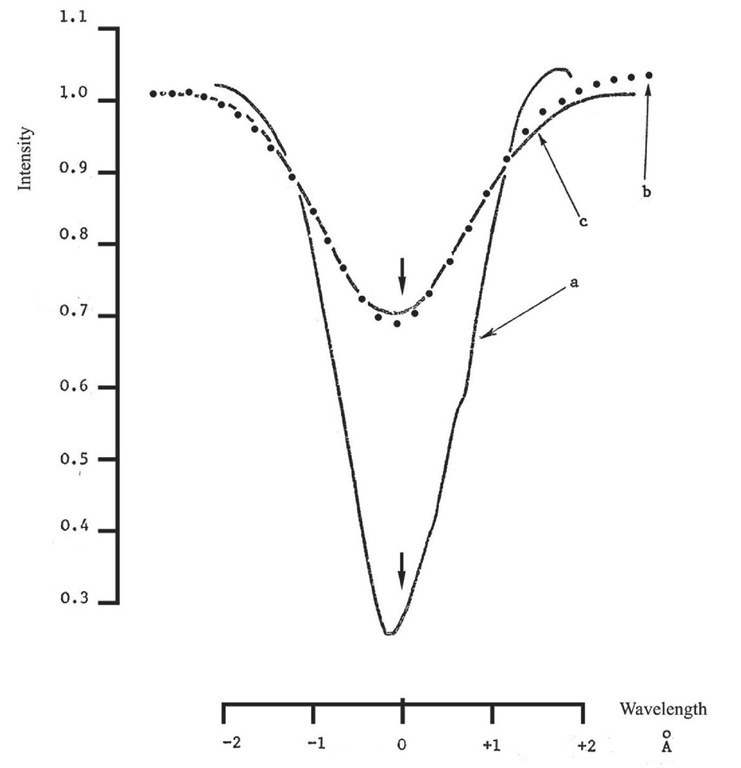
Figure 3.16 Comparison of a Gaussian curve with theoretical profiles. (a) A 30° elongation profile derived from a prograde dust cloud model with circular orbits. The dust is assumed to fall in number density away from the Sun inversely with radius of orbit. (b) This profile convolved with the instrumental profile of our Fabry-Perot. (c) A comparison Gaussian curve
An adaptation of a general least-squares fit subroutine was used to make program GAUSSN compute the fits. The program used an iterative method in the four dimensions, Vv V2, V3,V4, and worked from a first approximation, put in by inspection. It accepted directly the same card input format as LSQFIT. The output cards produced by GAUSSN were used by program GAUSPT to plot the points, and the fitted Gaussian curves.
Experimental case for the use of Gaussian fits
This method of Gaussian fitting is justified experimentally in that the fits obtained are not highly sensitive to the presence of a small emission core, nor to edge effects; also in most cases the essential residuals are small. Every experimental point contributes to the fit, and the resulting estimation of wavelength shift.
Further experimental endorsement of the method comes from the fact that the day scans performed with this instrument exhibit a shape which fits very well to a Gaussian curve.
Theoretical justification for the use of Gaussian fits
In order to simulate from theory the spectrum of the Zodiacal Light, I have used spectra computed from dust cloud models. The aim here is to show that by mathematically simulating the modifications made to a spectrum by the interferometer and subsequent reduction methods, a curve is arrived at which is very similar in form to a Gaussian. Curves derived from a variety of dust cloud models are discussed in detail in topic 4, but the method used in all cases is the line-of-sight integration through the dust cloud, described earlier and illustrated in Figure 1.3, in which it is assumed that there is a particle number density n with the dependence
where a is the particle radius, r is the particle’s distance from the Sun, and k is a constant.
For this test, the elongation was chosen to be 30 degrees and the dust was assumed to be moving in circular orbits in a prograde sense. A value of p = 1 was used.
The program CONVL (topic 4) read in the spectrum at one twenty-fifth angstrom intervals, interpolated to one fiftieth angstrom intervals, and assumed a continuum outside the absorption feature. It then read in the filter shape (approximated by a much wider Gaussian function) into an array, and shifted the array so that the peak was exactly at 5183.6 A (equivalent to tilting the filter to ‘tune’ it in the experiment). The input spectrum was multiplied by this shape. A Fabry-Perot profile was then generated with the same finesse and inter-order spacing as the etalon used in our experiment. The profile was shifted to give a peak at zero wavelength shift, and then the filter-modified spectrum was convolved over a thousand points with the F-P profile, simulating the scanning operation. Finally the resulting spectrum was divided by a filter profile as in the reduction (widened approximately by the instrumental resolved width). The result is shown in Figure 3.16. To this curve was fitted a Gaussian in the usual way, also shown in the figure, and it can be seen that the correspondence is remarkably good.
It is not difficult to show that for a fairly wide range of initial absorption line shapes, and even for close double features such as might be expected if the dust is moving in both prograde and retrograde orbits, the result as seen by the instrument is still very nearly Gaussian in shape. Thus the use of fitted Gaussian curves to measure the parameters of the spectra not only provides an unbiased mathematical assessment more reliable than estimates by eye, but represents a very close approximation to the physical reality. My program, GAUSSN, for computing a least-squares fit Gaussian curve to the experimental points, is shown in topic 2. GAUSSN was used in each case to output the parameters arrived at in the fitting process – new and more accurate estimates of the parameters of the absorption feature for all the averaged scans. The complete set of these averaged scans is shown at the beginning of topic 4, plotted, each with a Gaussian curve fitted, by program GAUSPT, except in two cases where no good fit could be computed; in these cases polynomial curves have been used, as noted.
At this stage, the observations were fully reduced, and in a form suitable for comparison with theoretical models of the Zodiacal Dust Cloud.


