1. Introduction
It is Fourier transform ion cyclotron resonance (FT-ICR) mass spectrometry (Amster, 1996; Comisarow and Marshall, 1974a,b,c; Jacoby et al., 1992; Marshall and Schweikhard, 1992; Marshall etal., 1998) which among mass spectrometric methods (see Article 10, Hybrid MS, Volume 5, Article 7, Time-of-flight mass spectrometry, Volume 5, Article 8, Quadrupole mass analyzers: theoretical and practical considerations, Volume 5, and Article 75, Mass spectrometry, Volume 6) holds the greatest potential at the forefront of research because of the inherently ultrahigh resolution and mass accuracy which can be achieved. FT-ICR mass spectrometry allows unequivocal mass assignment and resolution of species that could not otherwise be distinguished if using some other types of mass spectrometer. This latter capability is particularly relevant for the analysis of multi-component mixtures (Barrow et al., 2003; Wu et al., 2003b). All varieties of mass spectrometer must involve the analysis of gas-phase ions to obtain a mass-to-charge ratio (m/z) and ion sources must be used to generate the gas-phase ions from a neutral sample. FT-ICR is no different in these respects.
2. Basic principles of FT-ICR mass spectrometry
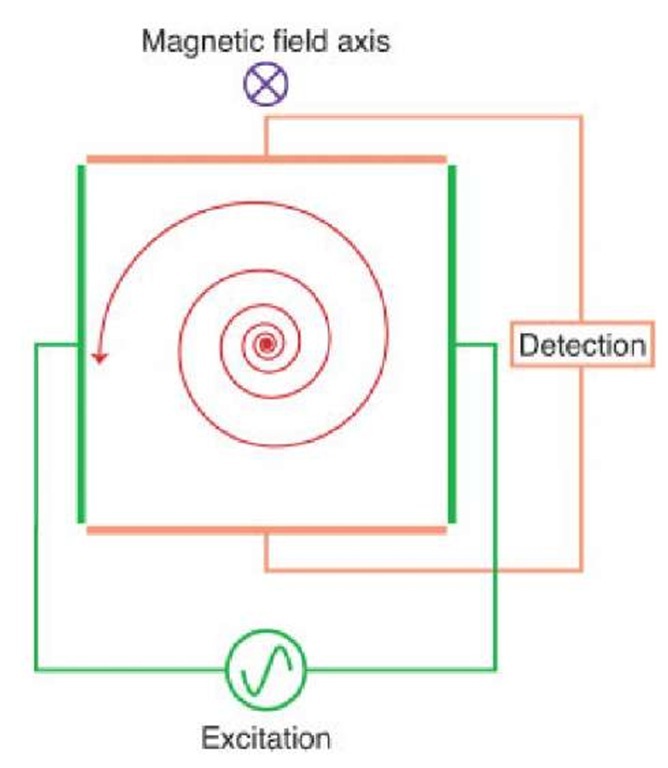
In FT-ICR mass spectrometry, ions are usually generated externally in a separate ion source and then injected into a container known as the cell (see Figure 1), which is typically cubical or cylindrical in geometry. The cell is located within a strong magnetic field, typically generated using a superconducting magnet. Charged particles moving in the presence of a magnetic field, with a component of their velocity perpendicular to the magnetic field axis, will experience a force known as the Lorentz Force. The axes of this force, motion of the (positively) charged particle, and magnetic field are mutually perpendicular, as dictated by Fleming’s Left Hand Rule. A charged particle, such as an ion, will begin to precess about the center of the magnetic field axis, resulting in an orbit. This motion is known as the cyclotron motion. The cyclotron frequency is related to the mass-to-charge ratio of the ion, as shown in equations (1a) and (1b):
Figure 1 Schematic representation of a cubic FT-ICR cell. The cell is aligned with the bore of the magnet so that the magnetic field axis is coaxial with the trapping axis (z-axis). The excitation and detection plates can be seen, with the trapping electrodes at each end of the cell, and the orbiting ions are shown in yellow
where q is the charge on the ion, B is the magnetic field strength, m is the mass of the ion, m is the cyclotron frequency in terms of radians per second, and f is the cyclotron frequency in terms of Hertz. Ions of lower m/z have higher cyclotron frequencies than ions of higher m/z .
The FT-ICR cell consists of the two excitation and two detection plates, but, in order to restrain the ions’ motion along the axis of the magnetic field, it is necessary to include two trapping plates. A low potential (typically of an order of 1 V) is applied to the trapping plates. When the ions enter the FT-ICR cell, the radii of the cyclotron orbits are too small to be detectable. The ions must therefore be excited to detectable radii and this occurs through usage of a radio frequency (RF) potential applied to two excitation plates operating at the resonant frequency (i.e., resonant with the cyclotron frequency) of the ions. All ions are excited to orbits of the same radii, though their cyclotron frequencies differ. Figure 2 depicts the excitation of ions to a detectable orbit radius. Detection of the ions occurs as the ion packets pass two detector plates. As the ion packets move past these plates, charge moves within the detection circuit to counteract the proximity of the ions. This current can be measured as a function of time and it is from here that the raw data (known as a transient, time-domain data, or sometimes as a free induction decay or FID) is obtained. It should be noted that the ions are remeasured because of the fact that they repeatedly pass the detector plates, as nondestructive detection is employed.
Figure 2 A cross section of a cubic FT-ICR cell, depicting excitation of ions (in red) through the application of an RF potential to the excitation electrodes. Once the ions have been excited to a cyclotron motion of suitable radius, the image current of the orbiting ions can be detected on the detection plates
The raw data will represent the detection at the same time of all the ions, with their different cyclotron frequencies. Information about the ion packets’ frequencies is obtained through usage of the mathematical procedure known as a Fourier transform (FT) (Marshall and Comisarow, 1975; Marshall and Verdun, 1990) by which frequency information is obtained from time-domain data. A spectrum is produced where signal intensity is plotted as a function of the cyclotron frequencies of the ions present. From equations (1a) and (1b) , it can be seen that the cyclotron frequency is related to m/z. It is therefore possible to convert the plot and to perform a calibration (Shi et al., 2000), thereby creating a mass spectrum in which signal intensity is plotted as a function of m/z. The conversion of raw data to a mass spectrum using a Fourier transform is depicted in Figure 3.
3. Advantages of FT-ICR mass spectrometry: mass accuracy and resolution
The excellent mass accuracy and resolution of FT-ICR mass spectrometers are amongst the technique’s strongest assets. Mass accuracy is a measurement of how well the observed m/z correlates with the theoretical value. Many other types of modern commercial mass spectrometers cite specifications for mass accuracy of the order of tens of ppm over a specific mass range, whereas specifications for FT-ICR mass spectrometers typically cite mass accuracies of 1 ppm or better (lower). Equation (2) is the relationship for determining the mass accuracy of a result when
Figure 3 Schematic diagram showing the measured data of a FT-ICR experiment and the subsequent fast fourier transform (FFT) and calibration of the measured data into the final mass spectrum
comparing the observed m/z with the value believed to be “true,” called here the theoretical m/z :
mobserved is the m/z of the peak of interest in the mass spectrum obtained and mtheory is the theoretical m/z that would have been expected for the species. The mass accuracy is defined in terms of ppm (equation 2).
Resolution is extremely important for resolving closely spaced signals, such as in the cases of multiply charged ions (as generated by electrospray ionization, for instance). The ability to use instruments with high resolution can sometimes make the difference between identifying and not identifying a species of interest. Equation (3) defines the resolution:
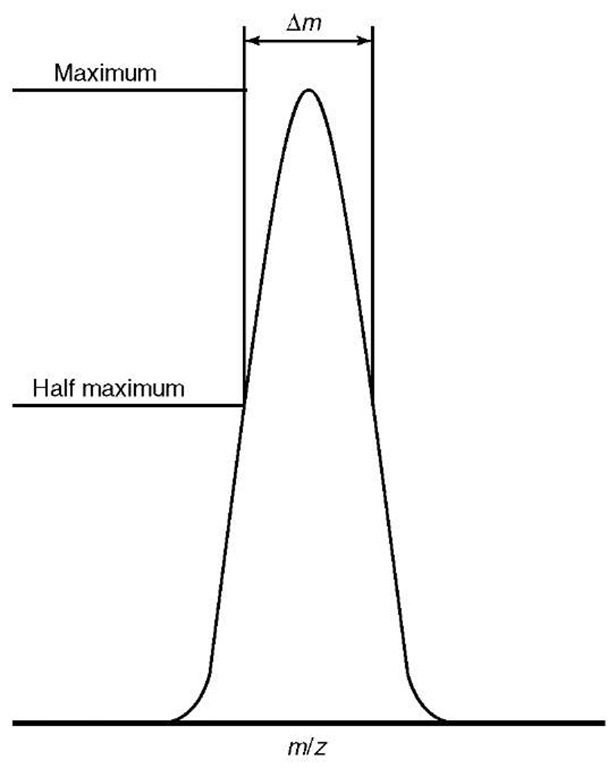
where m is the m/z of the peak of interest and Am is the width, in terms of m/z, determined using any one of the many methods of mass spectrometry. Resolution can be measured using the “10% valley” definition, as most commonly applied when using magnetic-sector instruments, or by using the full width at half maximum (FWHM) definition, which is typically used during the analysis of data acquired from time-of-flight (TOF) (see Article 7, Time-of-flight mass spectrometry, Volume 5) or FT-ICR mass spectrometers, illustrated in Figure 4. FT-ICR mass spectrometers can routinely reach resolutions of hundreds of thousands in “broadband mode” (“normal” experimental conditions) or even reach a resolution of a few million in “heterodyne mode” (where a very narrow m/z range is studied but under very high-resolution conditions), compared with commercial time-of-flight mass spectrometers approaching approximately 10 000 and commercial magnetic-sector mass spectrometers approaching a resolution of 100 000.
Figure 4 Definitions of resolution, showing the “full width at half maximum” definition, which is most typically used in conjunction with time-of-flight and FT-ICR mass spectrometers
4. Electrospray ionization
Electrospray ionization (ESI) (Dole etal., 1968; Fenn etal., 1989; Mann, 1992; Yamashita and Fenn, 1984a,b) is the ionization technique nowadays most frequently coupled with FT-ICR mass spectrometry. ESI has the advantage of minimizing fragmentation, which is particularly important for labile biological molecules, where fragments must not interfere with the mass spectrum when trying to determine the original constituents. ESI frequently leads to the formation of multiple charged ions, particularly in the case of large macromolecules. As mass spectrometry is based upon the determination of m/z, not mass alone, it is frequently the case that a mass spectrum will contain the same molecules but in a variety of charge states, and therefore at several different m/z values. As ions become more highly charged, the m/z becomes lower and the spacing between the “isotopomers” (peaks due to the presence of other isotopes) becomes narrower. As a result, it becomes more difficult to resolve the signals and the resolution of the mass analyzer becomes more important. Note that the charge state of an ion can be determined by examining the spacing between the isotopomer signals. The growth of electrospray ionization can, therefore, be seen to be promoting the growth in FT-ICR mass spectrometry, for FT-ICR mass spectrometers offer the ultrahigh resolution that is particularly well suited to a coupling with ESI. For these reasons, ESI FT-ICR mass spectrometry has become increasingly important for the study of biological molecules in recent years.
5. Tandem mass spectrometry techniques
For structural elucidation, “tandem mass spectrometry” experiments are performed, in which particular ions can be selected and dissociated. The resulting dissociation pattern provides structural information. One of the most common forms of tandem mass spectrometry experiment performed on FT-ICR mass spectrometers is sustained off-resonance irradiation collision-induced dissociation (SORI-CID) (Amster, 1996; Laskin et al., 2000; Palmblad et al., 2000). SORI-CID is based upon multiple collisions of the selected ions with gas particles, resulting in a “slow heating effect” and the ions’ internal energies are increased, leading to dissociation. Other varieties of tandem mass spectrometry experiment include infra-red multiphoton dissociation (IRMPD) and electron capture dissociation (ECD). IRMPD (Stace, 1998; Tsybin et al., 2003) entails the usage of a laser, most commonly a CO2 laser, to irradiate ions whilst trapped in the cell, and can be compared with the “slow heating effect” of SORI-CID. IRMPD has the advantage of avoiding the requirement to put a collision gas into the cell, as a higher pressure leads to a more rapid damping of the transient (time-domain data) and therefore decreases the resolution. SORI-CID and IRMPD are usually considered to be ergodic processes (Derrick et al., 1995), where the weakest bonds are cleaved. When studying peptides and proteins, backbone amide bonds and posttranslational modifications, tend to be cleaved, leaving to the formation of b-fragments and y-fragments from peptides and proteins (Sheil etal., 1990). ECD (Zubarev et al., 1998, 1999; Zubarev, 2003) involves a beam of low-energy electrons (0.2 eV or less, for instance) being emitted into the cell. Ions capture these low-energy electrons and dissociation occurs. The dissociations are thought to be nonergodic processes. With peptides and proteins, N-C and S-S bonds are preferentially cleaved. Utilization of ECD leads primarily to the formation of c and z* fragment ions, and one advantage is that noncovalent bonds and phosphorylation sites (see Article 61, Posttranslational modification of proteins, Volume 6, Article 63, Protein phosphorylation analysis by mass spectrometry, Volume 6, and Article 73, Protein phosphorylation analysis – a primer, Volume 6) are left intact. ECD mass spectra can therefore be relatively less complex due to avoidance of unwanted fragmentation.
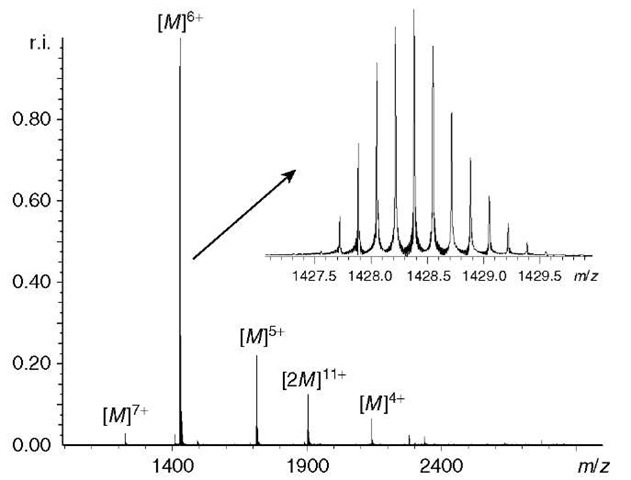
Fourier transform ion cyclotron resonance mass spectrometry represents an increasingly powerful tool for the study of biological molecules, especially within the context of “proteomics” (see Article 2, Sample preparation for proteomics, Volume 5) (Aebersold and Mann, 2003; Sali et al., 2003; Tyers and Mann, 2003). An example of a mass spectrum of a biological sample, in this case the protein known as ubiquitin, is shown in Figure 5. FT-ICR mass spectrometry, in particular, offers the greatest potential for the analysis of complex mixtures such as enzyme
digest owing to its inherently high mass accuracy, resolving power, and dynamic range (Wu, 2003a). These attributes allow for the positive identification of a greater number of species within a mixture than is possible with other mass spectrometric techniques, including species of low abundance such as posttranslationally modified proteins. However, with the advent of the low-excitation ionization afforded by ESI, mass spectrometry has increasingly been used for the characterization of the solution-phase properties of biomolecules. The ability to disperse into the gas-phase and ionize noncovalent complexes has allowed for the study protein-protein and protein-ligand interactions (Loo, 1997). The high resolution and mass accuracy of FT-ICR mass spectrometry offers decisive advantages when studying such interactions. For example, the ability of FT-ICR to resolve the isotopes of proteins up to 100kDa in mass (Kelleher etal., 1997) allows the definitive determination of the oligomeric state of a protein, or the ligands binding to a particular complex to be decisively determined. The structural characterization of such complexes is currently being attempted using tandem mass spectrometry techniques such as SORI-CID and ECD. Increases in sensitivity of detection and magnetic field strength will only serve to increase the potential of FT-ICR mass spectrometry to allow the understanding of life at the molecular level.
Figure 5 ESI FT-ICR mass spectrum of 20-|M ubiquitin in an aqueous 10-mM ammonium acetate solution, measured in terms of relative intensity versus m/z. The ubiquitin ions are measured in the mass spectrum in a number of charge states, there were also some noncovalently bound ubiquitin ions present. The inset shows a closeup of the ubiquitin ions in the 6+ charge state, the isotopomers were clearly resolved


