1. Introduction
Many breakthroughs in our understanding of signal transduction, especially in complex tissues such as those found in the central nervous system, have depended on decoding the spatial and temporal dynamics of intra- and extracellular signaling biomolecules. The most generally applicable and popular techniques with a high spatial and temporal resolution include the use of optical probes. Fluorescent reporters have been developed that report local concentrations of the signaling biomolecules or ions of interest by alternations in the amplitude or wavelength distribution of their excitation or emission spectra. For instance, synthetic fluorescent Ca2+ reporters including Fura-2, Indo-1, and Quin-2 contributed to reveal intracellular dynamics of Ca2+, such as Ca2+ waves and Ca2+ oscillations, under a fluorescence microscope (Tsien, 1994). Also, synthetic fluorescent reporters were recently developed for other ions and small biomolecules such as Zn2+ and nitric oxide (Walkup and Imperiali, 1997; Kojima et al., 1998). Green fluorescent protein (GFP) was recently cloned from the jellyfish Aequorea victoria and used for genetically labeling the signaling proteins, instead of conventional synthetic dyes such as fluorescein and rhodamine (Tsien, 1998). This genetic labeling method of cellular proteins facilitated direct observation of the proteins not only in living cells but also in tissues and organs from transgenic animals expressing fusion proteins of GFP and the proteins of interest. Mutagenesis studies further generated different-colored GFP variants, such as blue fluorescent proterin (BFP), cyan fluorescent protein (CFP) and yellow fluorescent protein (YFP) (Tsien, 1998). This GFP technology has accelerated the generation of fluorescent reporters for signaling molecules, because pairs of these different-colored GFP variants respectively act as a donor and acceptor for fluorescence resonance energy transfer (FRET) (Miyawaki and Tsien, 2000). So far, we and other groups have developed genetically encoded fluorescent reporters for visualizing cellular key signaling species, including Ca2+ (Miyawaki and Tsien, 2000), cyclic AMP (Zaccolo et al., 1999), cyclic GMP (Sato et al., 2000), small G-proteins (Mochizuki et al., 2001). These reporters revealed novel spatio-temporal dynamics of each signaling player in living cells. Further development of fluorescent reporters for pivotal signaling processes should be an active area of interest. In this review, we discuss fluorescent reporters for protein phosphorylation-based signal transduction and lipid second messengers.
2. Protein phosphorylation
Protein phosphorylation by intracellular kinases plays one of the most pivotal roles in signaling pathways within cells (Hunter, 2000). To reveal the biological functions of these kinases, electrophoresis, immunocytochemistry, and in vitro kinase assay have been used. However, these conventional methods do not provide enough information about the spatial and temporal dynamics of the signal transduction based on protein phosphorylation and dephosphorylation in living cells. To overcome these limitations for investigating kinase signaling, we developed genetically encoded fluorescent reporters for visualizing protein phosphorylation in living cells (Sato et al., 2000) (Figure 1). Using these reporters, we visualized under a fluorescence microscope when, where, and how the protein kinases are activated in single living cells.
To construct the fluorescent reporters for protein phosphorylation, a substrate domain for a protein kinase of interest is fused with a phosphorylation recognition domain via a flexible linker sequence (Figure 1). The tandem fusion unit consisting of the substrate domain, linker sequence and phosphorylation recognition domain, is sandwiched with two different color fluorescent proteins, CFP and YFP, which serve as the donor and acceptor fluorophores for FRET (Figure 1). As a result of phosphorylation of the substrate domain and subsequent binding of the phosphorylated substrate domain with the adjacent phosphorylation recognition domain, FRET is induced between the two fluorescent units, which elicits the phosphorylation-dependent changes in fluorescence emission ratios of the donor and acceptor fluorophores (Figure 1). Upon activation of phosphatases, the phosphorylated substrate domain is dephosphorylated and the FRET signal is decreased (Figure 1). We named this reporter “phocus” (a fluorescent reporter for protein phosphorylation that can be custom-made). By using suitable substrate and phosphorylation recognition domains, we have developed a large number of phocuses for several key protein kinases including a receptor tyrosine kinase, the insulin receptor (Sato et al., 2002) and a serine/threonine protein kinase, Akt/PKB (Sasaki et al., 2003) (Table 1). In addition, substrates for protein kinases and phosphatases can be targeted to specific subcellular compartments including mitochondria, the Golgi apparatus, nucleus, and plasma membrane in living cells, which are thought to be critical for specific signal transduction in the respective intracellular loci. Thus, we further tailored our phocuses to analyze the phosphorylation events in such particular locations in single living cells (Table 1).
Figure 1 Principle of a fluorescent reporter for protein phosphorylation, which was named phocus. Upon phosphorylation of the substrate domain within phocus by the protein kinase, the adjacent phosphorylation recognition domain binds with the phosphorylated substrate domain, which changes the efficiency of FRET between the GFP mutants within phocus. By tethering a localization domain with phocus, the phocus can be localized in the specific intracellular locus of interest to visualize the local phosphorylation event there. Abbreviations: CFP: cyan fluorescent protein; YFP: yellow fluorescent protein; P in an open circle, the phosphorylated residue
2.1. A phocus for imaging phosphorylation by insulin receptor
IRS-1 is one of the major substrates of insulin receptor. It contains a Peckstrin Homology (PH) domain and a phosphotyrosine binding (PTB) domain at its N-terminal end. The PH domain binds to phosphoinositides in the plasma membrane, and the PTB domain binds to the juxta-membrane domain of insulin receptor, which is tyrosine-phosphorylated almost immediately after insulin binding to the receptor. Thus, the concentration of IRS-1 is thought to be increased around the insulin receptor at the plasma membrane upon insulin stimulation. These PH and PTB domains were fused with phocus, named phocus-2pp, to locate the phocus around the insulin receptor like IRS-1 and to measure the local phosphorylation event there (Table 1). When phocus-2pp was expressed in CHO-IR cells, fluorescence was observed throughout the cells (Figure 2, time 0 s). Upon insulin stimulation, the CFP/YFP emission ratio expressed with pseudocolor was decreased in the cytosol owing to phosphorylation-induced FRET from CFP to YFP within phocus-2pp. 300 s after insulin stimulation, membrane ruffles, in which a large amount of phocus-2pp were accumulated, appeared around the plasma membrane and disappeared in 1000 s (Figure 2). In these membrane ruffles, phocus-2pp was found to colocalize with the insulin receptor. Interestingly, in these membrane ruffles, the extent of phocus-2pp phosphorylation was visualized to be ~2-fold greater than that in the cytosol. This difference in phosphorylation levels between intracellular loci could be due to different balance of kinase and phosphatase activities between these intracellular loci. Phocus-2pp should contribute to uncovering the biological significance of such characteristic domains for tyrosine kinase signaling in membrane ruffles with high spatial and temporal resolution.
Table 1 Detailed information on composition of each fluorescent indicator for protein phosphorylation and on each location to be directed in single living cells
| Kinase | Indicator | Localization domain | Localization | Substrate domain | Phosphorylation recognition domain |
| Insulin receptor (tyrosine kinase) | Phocus-2pp Aktus | PH-PTB domain from IRS-1 | Cytosol,
nucleus, and membrane ruffles including insulin receptor Cytosol |
ETGTEEYMKMDLG RGRSRSAP | p85a330-429 14-3-3^82-235 |
| Akt/PKB (ser-ine/threonine kinase) | eNOS-Aktus Bad-Aktus | eNOS1-35 Tom201-33 | Golgi
Mitochondria |
RGRSRSAP RGRSRSAP | 14-3-3^82-235 14-3-3^82-235 |
Figure 2 Fluorescence imaging with phocus-2pp upon insulin stimulation. Pseudocolor images of the CFP/YFP emission ratio are shown before (time 0 s) and at 60, 300, and 1000 s after the addition of 100-nM insulin at 25 °C, obtained from the CHO-IR cells expressing phocus-2pp. Insulin-induced accumulation of phocus-2pp at the membrane ruffles is indicated by white arrows in the image at 300 s
2.2. Aktus for imaging phosphorylation by Akt/PKB
Akt/PKB is a serine/threonine kinase that regulates a variety of cellular responses, such as cell proliferation, cell survival, and angiogenesis (Marte and Downward, 1997). To provide information on the spatial and temporal dynamics of the Akt activity in single living cells, we have developed a genetically encoded fluorescent reporter for Akt, named Aktus (Sasaki et al., 2003). Almost all Akt substrates are localized to subcellular regions. For example, eNOS (Fulton et al., 2001), which mediates a vasodilatory effect by nitric oxide production, is predominantly localized to the Golgi apparatus, while Bad (Chao and Korsmeyer, 1998), which is related to apoptosis promotion, is present in mitochondrial outer membranes. By fusing the Aktus with the respectively subcellular localization domains within the eNOS and Bad, eNOS-Aktus and Bad-Aktus, which are respectively localized to the Golgi apparatus and mitochondrial outer membrane, were developed as shown in Table 1 and compared with the cytosolic diffusible reporter, Aktus (Sasaki et al., 2003). We have shown that in vascular endothelial cells, the Golgi-localized reporter, eNOS-Aktus, was phosphorylated upon stimulation with insulin and with 17p-estradiol, whereas the mitochondria-localized Bad-Aktus was phosphorylated in response to 17p-estradiol but not by insulin (Table 2). On the other hand, the diffusible reporter, Aktus, was not efficiently phosphorylated either upon insulin or 17p-estradiol stimulation (Table 2). These results suggest that activated Akt is localized to various subcellular compartments including the Golgi apparatus and/or mitochondria rather than diffusing throughout the cytosol, thereby efficiently phos-phorylating its substrate proteins. Our observations with the mitochondria-localized reporter suggest that localization of activated Akt to mitochondria is triggered by 17p-estradiol but not by insulin. The present reporters and their applications are thus expected to contribute to the studies of a whole range of dynamics of activated Akt in living cells.
Table 2 Differential subcellular localization of activated Akt between cellular stimuli
| Cytosola | Golgifc | Mitochondriac | |
| Insulin | — | + | — |
| 17p-estradiol | - | + | + |
aMeasured with Aktus. ^Measured with eNOS-Aktus. cMeasured with Bad-Aktus.
To summarize, we have developed a method for visualizing protein phosphory-lation-based signal transduction in the living cells, which was herein exemplified for insulin receptor and Akt signaling pathways. The present method is also applicable for certain other protein kinases of interest by changing the substrate sequence, phosphorylation recognition domain, and localization domain. We suggest the use of substrate sequences selectively phosphorylated by kinases of interest to rule out the possibility that such tailor-made reporters are also phosphorylated by other kinases. Our method is advantageous not only for imaging kinase signaling in single live cells and tissues with high spatial and temporal resolution but also for multicell analysis aimed at high-throughput screening to identify pharmaceuticals that regulate kinase and phosphatase activities.
3. Lipid second messengers
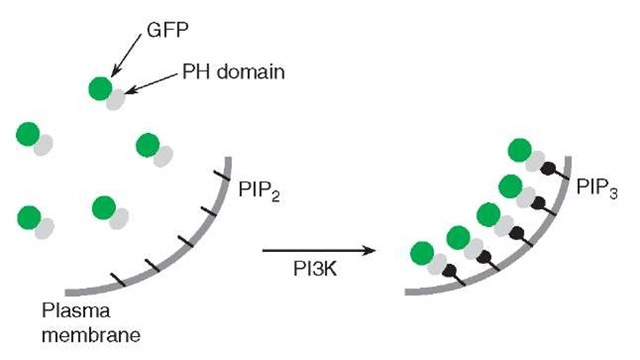
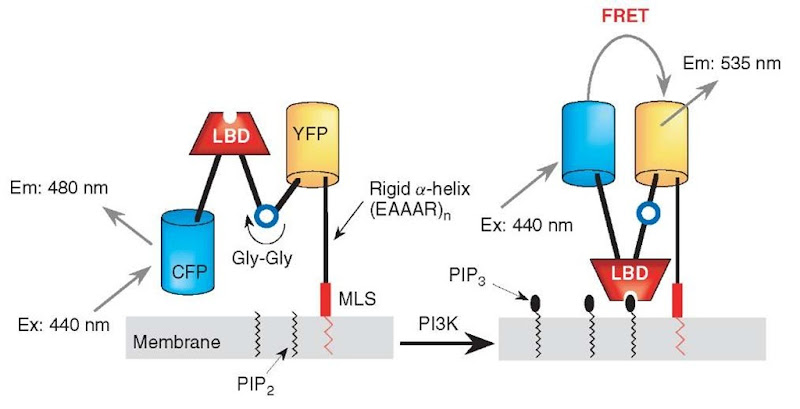
Phosphatidylinositol-3,4,5-triphosphate (PIP3), one of the lipid second messengers, regulates diverse cellular functions including cell proliferation and apoptosis, and any dysregulation in its production can lead to major diseases such as diabetes and cancer (Czech, 2000). This PIP3 is generated at the cellular membrane by phosphoinositide 3-kinases (PI3Ks), and recruits and activates its binding proteins at the cellular membranes, including Akt, PDK1, Btk, and GRP1 (Cantley, 2002). However, little is known about exactly when, where, and how PIP3 is produced. Recently, fusion proteins of GFP and PIP3-binding domains derived from Btk, GRP1, ARNO, or Akt have been reported as reporters for PIP3 accumulation in the cellular membrane, in which the translocation of the fusion proteins from the cytosol to the membrane has been explained to reflect the PIP3 accumulation (Varnai et al., 1999; Venkateswarlu et al., 1998a,b; Watton and Downward, 1999) (Figure 3). However, several factors such as membrane ruffles and changes in the cell shape, which are frequently observed during fluorescence imaging experiments, affect the fluorescence intensity change in the region of interest in a PIP3-independent manner and cause serious artifacts. Moreover, it is difficult with these fluorescent fusion proteins to distinguish to which membranes the fusion proteins are translocated in the cell. To overcome these limitations, we have developed fluorescent reporters for PIP3, based on FRET (Sato et al., 2003) (Figure 4). These novel PIP3 reporters are composed of two different-colored mutants of GFP and a PIP3-binding domain, and the PIP3 level was observed by dual-emission ratio imaging, thereby allowed stable observation of PIP3 without suffering from the artifacts described above. To construct the fluorescent reporters for PIP3, a PH domain of GRP1, which selectively binds with PIP3, is sandwiched between cyan (CFP) and yellow (YFP) variants of Aequorea GFP, via rigid a-helical linkers, consisting of repeated EAAAR sequences (Figure 4). Within one of the rigid linkers, a single diglycine motif is introduced as a hinge. This chimeric reporter protein is tethered with the membrane by fusing with a membrane localization sequence (MLS) via the rigid a-helical linker (Figure 4). When PIP3 is produced at the membrane upon PI3K activation, the PH domain binds to the PIP3, and a significant conformational change in the reporter protein quickly occurs around the flexible diglycine motif introduced in the rigid a-helical linker (Figure 4). This flip-flop-type conformational change of the reporter protein causes intramolecular FRET from CFP to YFP, which underlies the detection of PIP3 dynamics at the cellular membrane (Figure 4). We named this reporter “fllip” (a fluorescent reporter for a lipid second messenger that can be tailor-made) (Sato et al., 2003).
Figure 3 A conventional method for imaging PIP3 accumulation at the plasma membrane. This reporter is a fusion protein of GFP and a PH domain that specifically recognizes PIP3
Figure 4 Principle of fllip for visualizing PIP3. Upon binding of PIP3 with the PH domain within fllip, a filp-flop-type conformational change of fllip takes place, which changes the efficiency of FRET from CFP to YFP. Abbreviations: LBD: lipid binding domain; MLS: membrane localization sequence
Fllip can be located to particular membrane surfaces of interest by connecting appropriate MLSs, such as lipidation sequences and transmembrane sequences. For example, using the CAAX box motif of N-Ras as the MLS yields a reporter for PIP3 at the plasma membrane (fllip-pm). Using the mutated CAAX box sequence of N-Ras, in which the cysteine 181 was replaced with a serine, fllip was localized at the endomembranes to monitor the PIP3 level there (fllip-em).
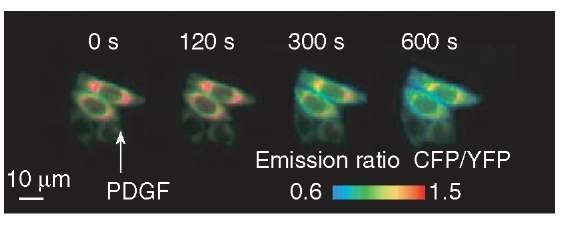
Using the fllip variants that exhibit each specific subcellular distribution, we revealed spatio-temporal regulations of the PIP3 production in single living cells. We found that in response to ligand stimuli, PIP3 was increased to a large extent at the endomembranes rather than at the plasma membrane (Figure 5). In addition, we revealed that this PIP3 increase at the endomembranes was due to its in situ production at the endomembranes triggered by endocytosed receptor tyrosine kinases. The demonstration of PIP3 production through receptor endocytosis addresses a long-lasting question about how its downstream signaling pathways including Akt are activated at intracellular compartments remote from the plasma membrane, such as the Golgi and mitochondria.
Figure 5 Response of fllip-em to PIP3 at the endomembranes upon PDGF stimulation. Figure shows pseudocolor images of the CFP/YFP emission ratio before (time 0 s) and at 120, 300, 600 s after the addition of 50 ng mL-1 PDGF, obtained from the CHO-PDGFR cells expressing fllip-em. Blue shift in the CFP/YFP emission ratio indicates the production of PIP3 at the endomembranes
From a methodological viewpoint, it should be mentioned that the present fllips, which are genetically encoded fluorescent reporters, have general applicability for other lipid second messengers as well. Fllips have two key sections, the PH domain and MLS, that can be tailor-made. Lipid second messengers other than PIP3, such as diacylglycerol (Zhang et al., 1995) and phosphatidylinositol-3-phosphate (Misra et al., 2001), could be selectively detected by using appropriate binding domains for respective lipid messengers instead of the PH domain. Also, by connecting each specific MLS, fllips could be directed not only to the plasma membrane and endomembranes but also to other organelle membranes, such as the inner nuclear membrane and the outer membrane of mitochondria.


