ABSTRACT
Planar Solid Oxide Fuel Cells (SOFCs) are made up of repeating sequences of thin layers of cermet electrodes, ceramic electrolytes, seals, and current-collectors. For electro-chemical reasons it is best to keep the electrolyte layers as thin as possible. However, for electrolyte-supported cells, the thin electrolytes are more susceptible to damage during production, assembly, and operation. The latest-generation electrolyte-supported SOFCs employ a honeycomb-type support structure that includes both thick and thin regions within the electrolyte. The thin regions are more electro-chemically efficient, while the thick regions provide mechanical support.
The performance of the electrolyte within the context of a mechanically and thermally loaded stack is being investigated. Temperature profiles are obtained from CFD models. Mechanical and thermal material properties are obtained from experiments with individual components. Single-component models are used to further characterize components with complex geometries, particularly the electrolyte and the compliant, electrically conducting metal foams. A 2-D stack model uses the data from experiments and single-component models to evaluate the mechanical response of the cells to loads comparable to those experienced in assembly and operation. The model is run both at room temperature and at operating temperature to determine which parameters can best reduce the demands on the brittle electrolyte without sacrificing electro-chemical efficiency.
INTRODUCTION
Fuel cells are electro-chemical devices which consist of an electrolyte and two electrodes which enable reactions in fuel and oxidant to produce energy. Solid Oxide Fuel Cells (SOFCs) in particular are characterized by a solid electrolyte which is electrically non-conducting and impermeable to gas diffusion, but permits ions to migrate through it. When brought up to their operating temperatures, the anode strips electrons from the fuel to form oxygen ions, which pass through the electrolyte to the cathode. The stripped electrons, which cannot pass through the electrolyte, are routed to the cathode through an external circuit, thus providing electrical power. Electrons arriving at the cathode combine with oxygen ions and with hydrogen in the fuel to produce water [1],[2] .
SOFCs are generally characterized by both their geometric configuration, most commonly tubular or planar, and by which of the ceramic layers provides the primary mechanical support, generally the anode or the electrolyte. Tubular cells have the advantage of being much easier to seal against cross-contamination of gases, but planar cells are generally preferable due to the potential for increased power density, for easier cell-to-cell interconnection, and significantly reduced manufacturing costs.[3]. Electrolyte-supported cells are advantageous over anode-supported cells because they are less susceptible to failure due to anode reoxidation or cathode reduction. However, the thicker electrolyte results in higher resistance and requires higher operating temperatures to minimize ohmic losses [4]. Electrolyte-support is also preferable because the porous anodes are generally harder to seal.
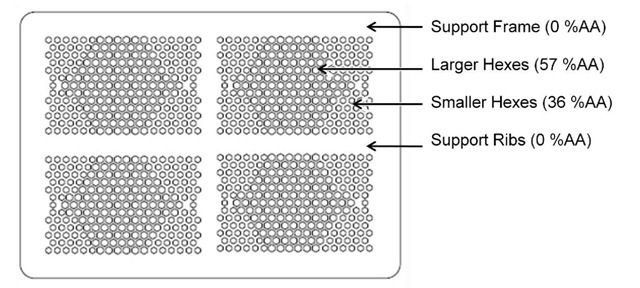
Fig. 1: In-plane geometry of a FlexCell Electrolyte
For electro-chemical reasons, it is best to keep the electrolyte as thin as possible. Thinner electrolytes can allow for lower operating temperatures and have lower resistive losses [5]. However, it remains important to maintain sufficient thickness that the electrolyte is mechanically robust enough to provide mechanical support.
In order to produce cells which are mechanically robust while electro-chemically efficient, NexTech Materials Ltd. has developed a new planar, electrolyte-supported SOFCs which it calls the FlexCell™ [6]. The design incorporates an electrolyte layer made up of alternating regions of thin, "active" regions supported by a thicker, hexagonal mesh, as shown in Fig. 1. The thin regions, which are approximately 40 microns in thickness, allow for more electrochemically efficient energy production, while the thicker regions, approximately 200 microns, provide mechanical support. The cells are produced in layers which are on the order of 100-1000 square centimeters in area, making them upwards of 2500 times larger in length in-plane than they are through the thickness.
To ensure robust, efficient designs, the ability to model the cells using finite element analysis is desirable. Previous work, which focused solely on the electrolyte, employed a two-scale modeling approach. Small-scale local geometry was studied with a full 3-D unit-cell model, and large-scale effects were studied with a shell-element model that did not require prohibitively many elements [7]. To study the performance of the electrolyte in the context of a full SOFC stack, further modeling and experiments have been run to characterize the surrounding SOFC components.
SOFC STACK COMPONENTS
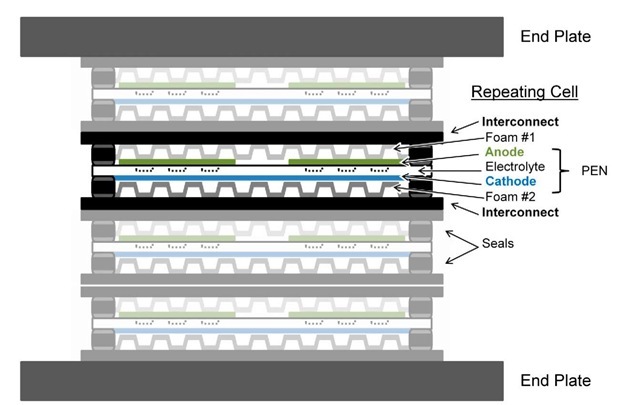
Aside from the electrolyte, a number of other components must be considered in order to model a full stack. Figure 2 is a schematic of a generic stack and shows all the different components down to the cell level. A porous anode and cathode are bonded to either side of the electrolyte, forming an energy-producing assembly that is often referred to as positive electrode-electrolyte- negative electrode, or PEN for short [8]. On either side of the electrodes, compliant, metal foams are used to direct current from the electrodes to the interconnect, while allowing gases to diffuse to and from the PEN layer. The steel interconnects form a separation between cells, as well as contain channels to direct the flow of gases. Additionally, seals are needed at the edges of cells to prevent the cross-contamination of fuel and oxidant from one side of the PEN to the other.
REPEATING CELL MODEL
To begin to model the stack, the repeating unit shown in Fig. 2 is modeled. To simplify the model, the electrolyte was treated as a solid layer with uniform thickness and equivalent mechanical properties that account for the effects of the thin regions. Finite element modeling was used previously to show that for any linear elastic material, the reduction in stiffness of a FlexCell electrolyte is dependent on the percentage of ‘active area’ devoted to thinner, active hexes.
Fig. 2: Schematic of a Planar SOFC Assembly
Percent active area is defined as follows:
For example, the electrolyte shown in Fig. 1 contains a combination of larger and smaller hexes. The large hexes are 4.5 mm across and are spaced 1.5 mm apart, taking up about 57% of their surrounding area. The small hexes, which are 3.0 mm across and spaced 3.0 mm apart, take up about 36%. The frame and ribs contain no hexes, so their %AA is zero.
The equivalent stiffness, Eeq for FlexCell geometries of varying thicknesses is written as follows:
where tm is the thickness of the active membrane, ts is the additional thickness added in the support regions, and f(%AA) is determined by a curve fit of 35 finite element simulations:
To further simplify the repeating cell model, it has also been assumed that the mechanical effects of the anode and cathode are minimal when compared to the effect of the electrolyte itself. The anode and cathode are porous cermets which are much softer than the electrolyte. In addition, the electrodes are applied in much thinner layers than the electrolyte, thus further reducing any strength. By neglecting the electrodes in the stack model, the model avoids having to devote many tiny elements to their region, which would be computationally prohibitive. Other researchers have shown that in electrolyte-supported cells, the difference in stress on the electrolyte between an electrolyte by itself and a full PEN assembly is only around 10% [9].
Fig. 3: 3-D Geometry of a Current Collector
In most of the stack components, the geometry is simple and the material properties are available in the literature. The electrolyte is typically made from Yttria-Stabilized Zirconia (YSZ), which has a Young’s Modulus of around 200 GPa [10]. As described above, in active regions of the FlexCell the equivalent stiffness is by definition lower. The interconnect layers are made typically from Crofer® 22 APU [11],[12]. The seals are each three layers: a steel shim sandwiched between two glass-ceramic seals which attach to the electrolyte frame and interconnect, respectively [13]. With the exception of the metal foams, all component geometries are able to be modeled as rectangles in a 2-D cross-sectional representation of the stack.
As shown in Fig. 3, the foam on the anode side is a nickel foam which is stamped into a corrugated pattern. The cathode side foam is Crofer which has been formed into sheets of expanded metal mesh and then stamped into a similar corrugation pattern. Mechanical properties for the nickel foam are obtained from existing literature [14], and the mechanical behavior of the expanded metal configuration is determined below.
MECHANICAL RESPONSE OF CATHODE-SIDE FOAM
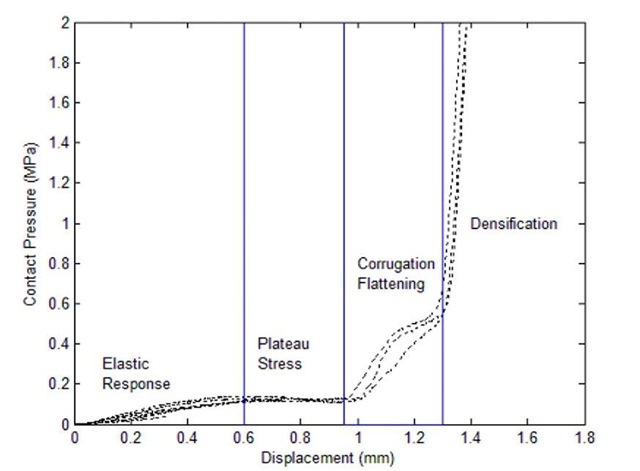
Samples of the expanded metal were compressed from an initial thickness of 1.5mm to a final thickness of 0.1 mm, resulting in the load-displacement data in Fig. 4. The samples were pressed between two cylindrical rods which were 31.75 mm in diameter. The recorded loads were divided by the rods’ cross-sectional area to determine a contact pressure. This contact pressure is later used with a finite element simulation. The experiments were performed at room temperature, although there are plans to repeat the measurements at the SOFCs’ operating temperature of up to 850 oC.
Fig. 4: Load-Displacement Response of Corrugated Expanded Metal
Like many foams found in literature, the deformed material initially exhibits a linearly elastic response, followed by a plateau stress in which the deformation is believed to be dominated by small-scale failure by buckling and/or plastic yielding [15]. After a plateau, traditional foams enter a stage called densification, in which the voids in the foam have compressed to the extent that opposite faces come into contact. Foams undergoing densification exhibit stress-strain behavior with slopes much steeper than the initial elastic response. The corrugated expanded metal appears to exhibit an analogous slope, but there is an additional unexplained behavior between the plateau stress and densification. Because this material is not a "true" foam, it is believed that this extra region may correspond to the flattening of the corrugation structure as both faces of the material in each of the flat regions come into contact with both load rods.
Based on the experimental data, a single-component model of the expanded metal current collector was generated in ANSYS. The model used a 2-D cross-section of the corrugated pattern as its geometry and is treated as a generic, isotropic, plastically-deformable solid. For boundary conditions, the nodes along the bottom surface of the foam were all fixed in place vertically, while the top surface nodes were subjected to incremental displacements downward. The model underwent compression with the same range of deformation as the samples loaded in the experiments.
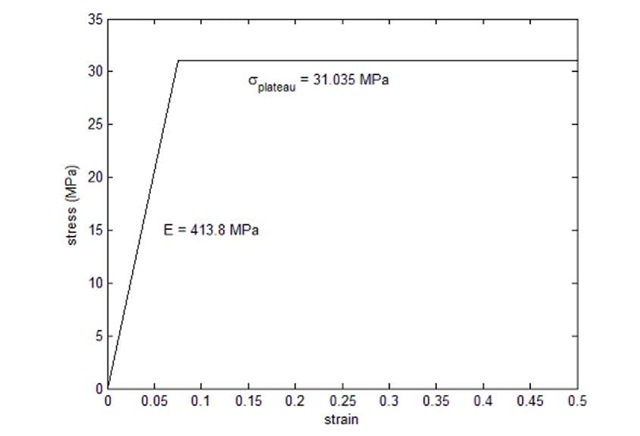
Fig. 5: Material Behavior Determined by Model
Fig. 6: Load vs. Displacement in Linear and Plateau Regions
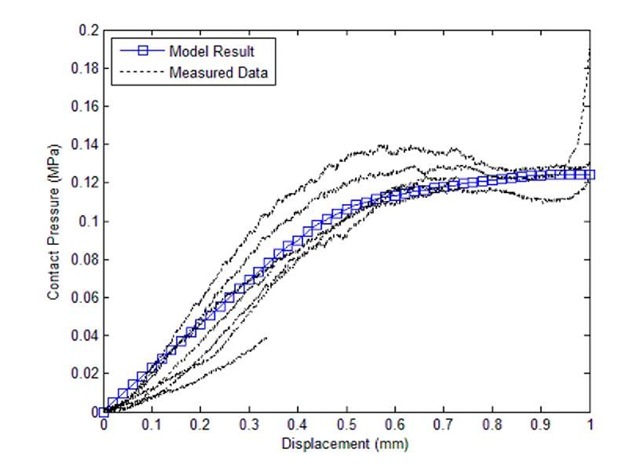
The material parameters in the model were modified over several iterations until the reaction forces reported by the displaced nodes agreed with the contact pressures measured by the load frame. The final stress-strain curve for the modeled material is given in Fig. 5. Simulations which used the material data from Fig. 5 resulted in the pressure vs. displacement data given in Fig. 6.
DISCUSSION OF RESULTS
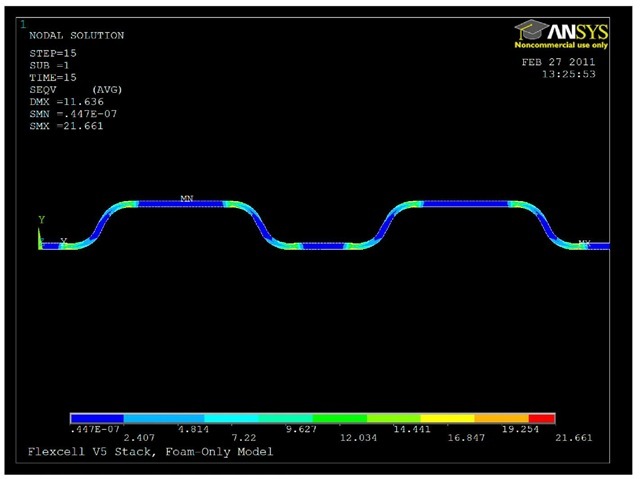
As is shown in Fig. 6, the model was able to replicate the load-displacement response in the elastic and plateau regions. However, the model was unable to reproduce the response of the later regions, regardless of the material properties that were defined. There are a number of possible reasons for this discrepancy. In conventional foams the expected response assumes that the foam is uniformly dense and undamaged throughout the material, whereas the stamped corrugations imply plastic yielding and collapse of the foam in and around the folds of the corrugation pattern. Whatever residual stresses or damage may have occurred in the folds is not accounted for in the finite element model. Regardless of prior damage or yielding, the presence of the folds in the model represents possible sites for stress concentration and plastic hinges. A sample stress contour, which shows the development of stress concentrations, is shown in Fig. 7.
Fig. 7: Stress Contours Present in Compressed Foam
For the purposes of building a full stack model, the ability to model the current collectors in the higher displacement regimes is not expected to be critical. What matters most is the amount of force transferred from the foam to the electrolyte under a given displacement. Because of the way that the material properties have been identified, the desired forces are automatically produced. Within the context of the surrounding stack, it is expected that by the time the foam reaches its flattening and densification regimes, it will already have undergone considerable displacement and the damage to the electrolyte will likely have already compromised the cell.
CONCLUSIONS
In order to produce a full stack model for the FlexCell design, characterization of the surrounding components must be performed. Many of the components exhibit simple geometries with well-understood properties, but a few, including the patterned, metal foam current-collectors, do not. To evaluate the impact on the electrolyte, it is critical to understand how loads and displacements are transferred between components. Since it is not important to understand the material response of the actual components, effective properties can usually be used.
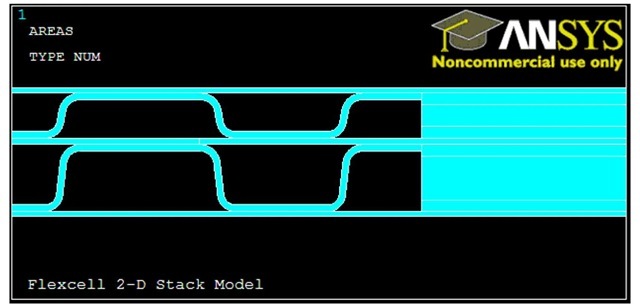
There is still further work to be done in evaluating the mechanical performance of the FlexCell. The above characterization needs to be repeated at higher temperature, and the results need to be incorporated into a model which includes the rest of the stack. Figure 8 shows a region of a cell containing both foams and seals. The stack model itself is computationally complex, containing nonlinear behaviors associated with materials and components which deform plastically, have sliding contact between components, and have coupled thermal-structural responses.
Fig. 8: Representative Segment of Stack Model
