To use the Hough transform to extract lines, the equation of a line must be rewritten to prevent undefined values that occur in Equation (7.2) for vertical lines. Instead of using slope and intercept, a line can be described by its distance to the origin, p, and its angle with the x-axis, 0 (Figure 7.2). With these two parameters, the line is now described by p and 0 are related to m and n through
The corresponding Hough space is two-dimensional, with coordinates p and 0. Following the same idea as in Equation (7.3), we can ask what type of trace an arbitrary point (yk,xk) would create in a coordinate system of p and 0. For this purpose we assume x and y to be constant: namely, (xk,yk) for the kth point in any set. We then insert where tan 9 = xk/yk. The sine function is always centered on p = 0, and its amplitude and phase shift are identical to the location of the point (yk,xk) in polar coordinates with an additional 90° phase shift.*
FIGURE 7.2 Definition of a straight line in polar coordinates [Equation (7.4)]. 0 is the angle of the line with the horizontal axis, and p is the minimum distance to the origin.
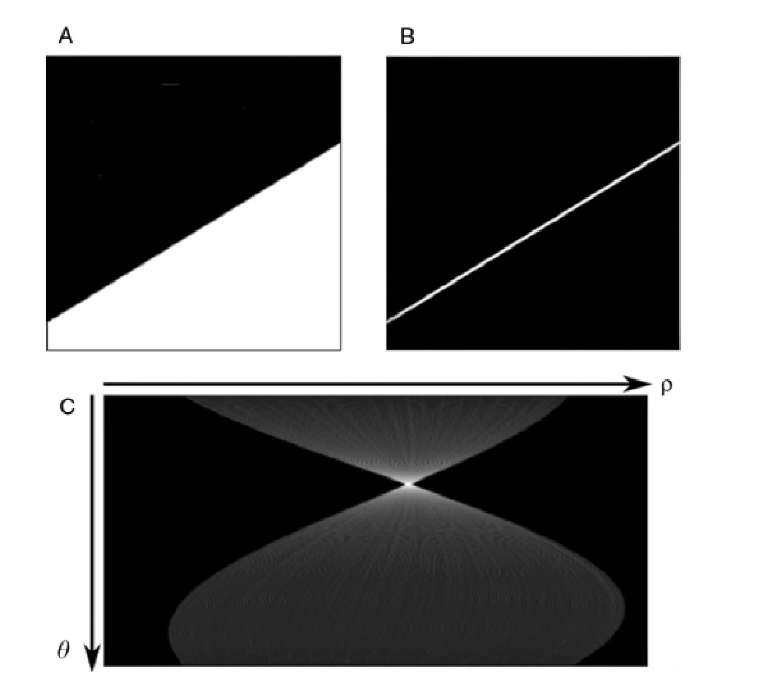
For the accumulating step, an arbitrary angular increment A0 with 0j = j A0 is chosen, and for each point of interest (yk,xk) the corresponding set of values p (0j) is computed using Equation (7.4). Since Hough space is discrete, the pixel at (p, 0j) in Hough space is increased for the kth point at each angle 0 (0 < 0 < 180°). Each point therefore produces a sinusoidal trace in Hough space following Equation (7.6). The restriction of 0 to angles below 180° is possible because of the symmetry of Equation (7.4). In the terminology of the Hough transform, the point (yk,xk) casts j votes for all angles 0j in Hough space. An example is given in Figure 7.3. First, an edge detector extracts the edges of the features (Figure 7.3B). For the actual Hough transform seen in Figure 7.3C, each white pixel from the edge is selected and Equation (7.4) is applied 180 times with 0 increasing from0° to 179° at 1° intervals. The Hough transform image is therefore 180 pixels high, and each row corresponds to the angle 0 in degrees. The points where multiple sinusoidal traces meet are brighter than other points. Once the votes for all points (yk,xk) have been accumulated in Hough space, a peak-finding algorithm or simple thresholding determines the pairs (p, 0) with the highest number of votes, and each of these pairs defines a straight line in Cartesian space. In the case of Figure 7.3C, the brightest pixel is found at the coordinates p = 21 and 0 = 29°. Application of Equation (7.5) yields the values m = 0.55 and n = 43 for the equation of the line representing the edge.
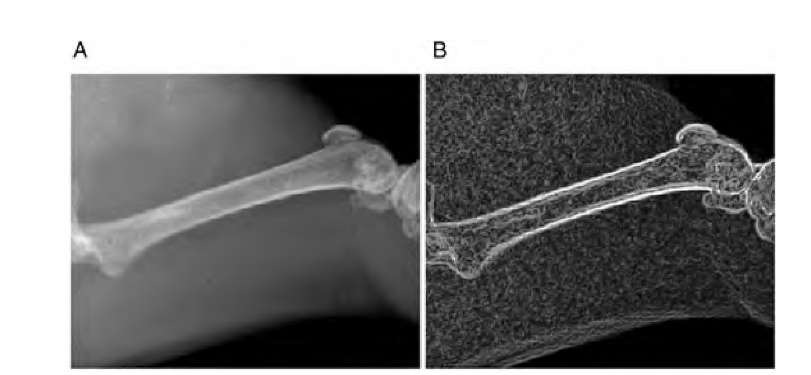
The following example illustrates the advantages and challenges of the Hough line transform. Figure 7.4 shows an x-ray image of a mouse bone together with its edge image. The edge image was created by applying the Sobel operator, thresholding, and then superimposing the edge over the Sobel image. As a consequence, the actual edges are visible as white lines in the Sobel image. These white lines are composed of the pixels that cast a vote in the Hough transform.
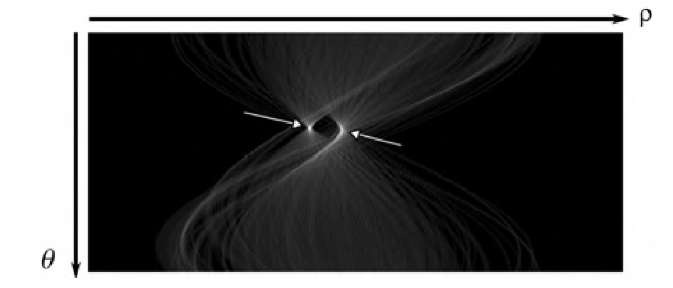
The Hough transform of the edges in Figure 7.4B is shown in Figure 7.5. Two areas of high votes (two local maxima) become evident. The left local maximum is well defined, whereas the right maximum is more spread out along a curve. These areas of local intensity maximum correspond to the upper and lower edges of the bone, respectively. Since the upper edge follows more closely a straight line, its local maximum in the Hough transform is more focused. Conversely, the lower edge is curved. Therefore, its corresponding local maximum is less focused and spread (xk,yk) in Equation (7.4), combine the terms with 0, and solve for p. The resulting equation describes a sine function:
FIGURE 7.3 Example image to demonstrate the Hough transform. Image A contains a feature with a dominant diagonal edge. In the first step, the edge is extracted by an edge detector such as the Sobel operator (B). Each point of image B that lies above a threshold (i.e., is considered as belonging to the edge) is allowed to cast a vote for all angles 0, and each point contributes votes along a sinusoidal curve in (p, 0) space (C). The traces meet in a single point, and the coordinates p and 0 coincide with the distance from the origin and the angle with the x-axis of the edge in image B. Image C was contrast-enhanced with a gamma function to improve visibility of the nonmaxima traces.
FIGURE 7.4 X-ray image of a mouse femoral bone (A) and the edges detected (B). Image B shows the edges as white lines and line segments superimposed over the Sobel image.
FIGURE 7.5 Hough transform of the edges in Figure 7.4B. Two areas with local intensity maxima (arrows) become evident. These areas correspond to the upper and lower edge of the bone. The image has been contrast-enhanced with a gamma function to improve the visibility of the traces.
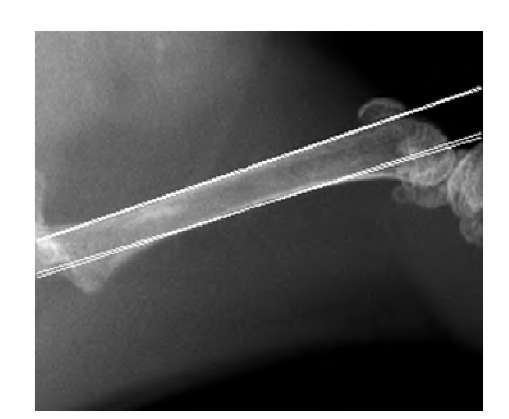
To identify the likely edge candidates, a local maximum filter needs to be applied next. In this example the filter found two pixels with an equal number of votes for the right local maximum (the lower, curved edge). Consequently, the inverse Hough transform contains two closely aligned lines for the lower edge. The inverse Hough transform superimposed over the original x-ray image is shown in Figure 7.6. It can be seen that the straight lines generated by the inverse Hough transform follow the bone outline very closely. The remarkable advantage of the Hough transform is its ability to detect dominant lines even in the presence of noise. Noise is amplified by the edge detection operation (Sobel operator). As a consequence, edges may be fragmented, and fragments of other edges remain in the image. This is particularly clearly visible in Figure 7.4B, where the knee joint (top right) contributes numerous pixels above the threshold (i.e., pixels that cast votes in the Hough transform).
FIGURE 7.6 The inverse Hough transform of the local maxima in Figure 7.5 superimposed on the original x-ray image. The local maximum for the lower edge was ambiguous (two pixels of an identical number of votes), and two closely aligned lines emerge.
One disadvantage of the line Hough transform is that the lines are defined by two parameters only and therefore extend over the entire image. Additional steps are necessary to trim the lines. Examples include limiting the lines by the thresholded version of the original shape, and limiting the lines to a region of interest or by analyzing intersections of multiple lines. Moreover, the examples in Figures 7.5 and 7.6 demonstrate that local maxima can be ambiguous and the line extraction relies strongly on a robust local maximum filter.
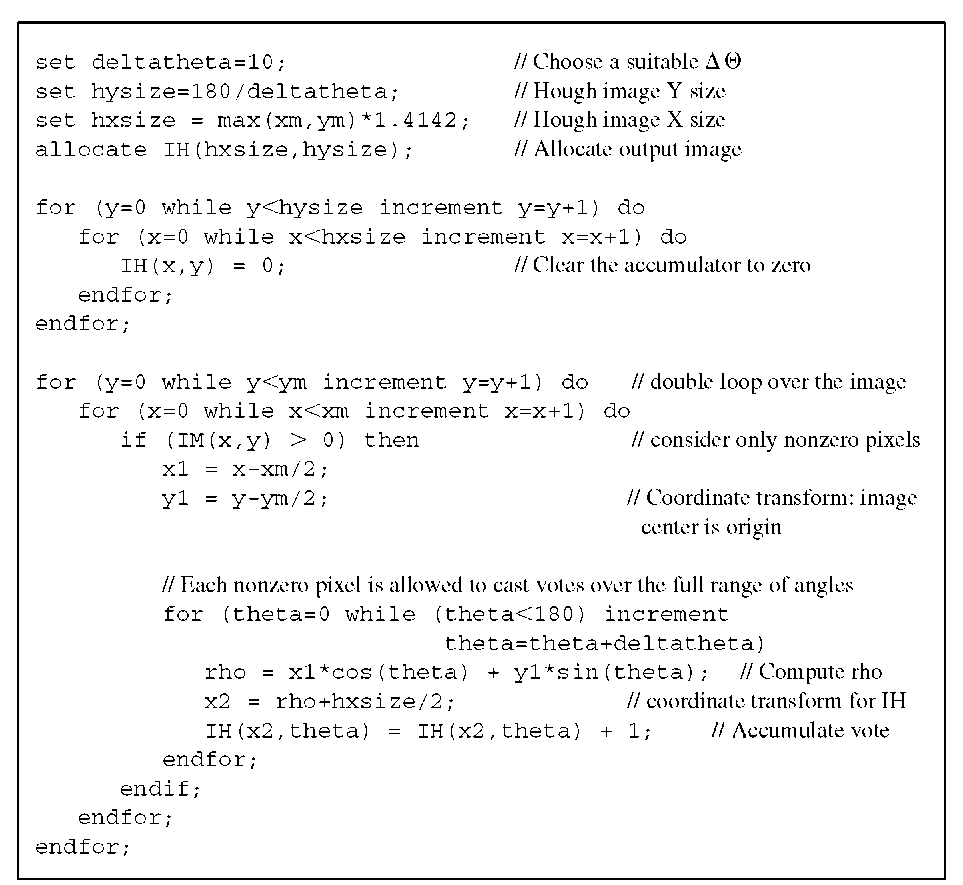
The basic algorithm for the line Hough transform is presented in Algorithm 7.1. Each nonzero pixel of the input image is allowed to cast a vote for all possible angles 0 over the full 180° angle range. For reasons of symmetry, the angles from 180° to 360° duplicate the votes from 0° to 180°, and computational efficiency can be increased by restricting the angles to 0° to 180°.
Algorithm 7.1 Hough transform for lines. The input image IM (size: xm, ym) is assumed to be thresholded, and each nonzero pixel is allowed to cast votes for angles theta from 0 to 180° with the angular increment of deltatheta. The output image IH contains the accumulated votes with values of p along the x-axis and values of 0 along the y-axis. A typical output image is shown in Figure 7.5.
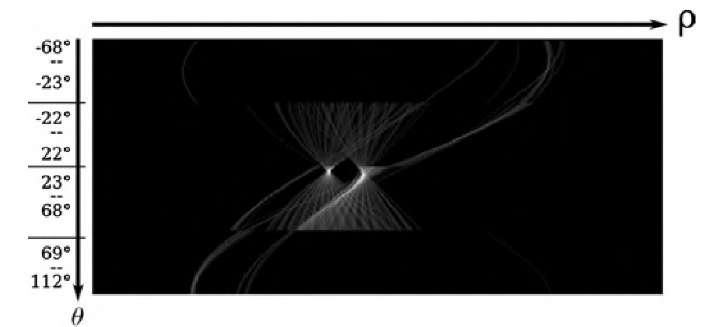
Further improvement in the line detection process using the Hough transform is possible when the direction of the edge is known.17 Further reduction of the angle range is possible by combining the Hough transform with the edge detector. The Sobel operator, for example, convolves the original image with two matrices, Gx and Gy [Equation (2.20)], to emphasize horizontal and vertical edges, respectively. The convolved images are combined on a pixel-by-pixel basis to provide the edge magnitude. The two convolved intermediate images contain additional information: If the pixel value computed by convolution with Gx is larger than the one obtained by convolution with Gy, the edge is horizontal (more precisely, between -45° and +45° from the x-axis), and the range of values for 0 where the pixel casts a vote can be restricted to the range 45° to -45°. In the opposite case (convolution with Gy creates a larger pixel value than convolution with Gx), the range for 0 can be restricted to the range 45° to 135°. The votes for each pixel can therefore deviate only by up to ±45° from the dominant edge direction. Further refinement is possible when the compass or Kirsch edge-detection operators are used (Figure 2.5). To emphasize edges with compass or Kirsch operators, four convolutions are performed, and the largest pixel value of the four convolution operations is taken as the edge value. In addition, the edge orientation is horizontal (-22° < 0 < 22°), upward diagonal (23° < 0 < 67°), vertical (68° < 0 < 112°), and downward diagonal (113° < 0 < 157° or -23° < 0 < -68°) when the maximum pixel value results from convolution with K1, K2, K3, and K4 [Equation (2.24)], respectively. The vote of each pixel is therefore limited to an angular horizontal band of 45° width in the Hough transform. Figure 7.7 shows the Hough transform of the edge image in Figure 7.4B with the limitation of the angle range. The main difference in Figure 7.5 is the restriction that pixels from the knee region are not allowed to cast votes into the horizontal band (68° < 0 < 112°).
There are two advantages of the use of restricted ranges for 0. First, the absence of pixel traces from nondominant edges in the band containing dominant edges reduces the number of local maxima. Dominant edges are therefore easier to find and isolate. Second, for each pixel only one-fourth of the original angle range needs to be computed. Provided that edge detection was required in both cases and that edge detection and Hough transform can be combined into one operation, computational efficiency increases markedly.
FIGURE 7.7 Hough transform of the edges in Figure 7.4B with angular restriction to ±22° from the edge orientation. The angular restriction divides the image into four horizontal sections, and pixels are not allowed to cast votes into sections that differ by more than ±22.5° from their main edge orientation.


![Definition of a straight line in polar coordinates [Equation (7.4)]. 0 is the angle of the line with the horizontal axis, and p is the minimum distance to the origin. Definition of a straight line in polar coordinates [Equation (7.4)]. 0 is the angle of the line with the horizontal axis, and p is the minimum distance to the origin.](http://what-when-how.com/wp-content/uploads/2011/06/tmp2043_thumb_thumb1.jpg)

