Skewness:
The lack of symmetry in a probability distribution. Usually quantified by the index, s, given by
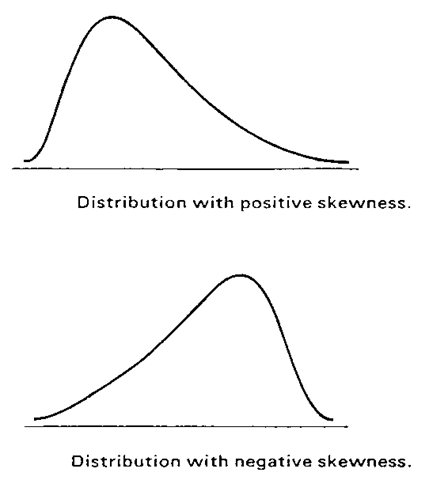
where and are the second and third moments about the mean. The index takes the value zero for a symmetrical distribution. A distribution is said to have positive skewness when it has a long thin tail to the right, and to have negative skewness when it has a long thin tail to the left. Examples appear in Fig. 124.
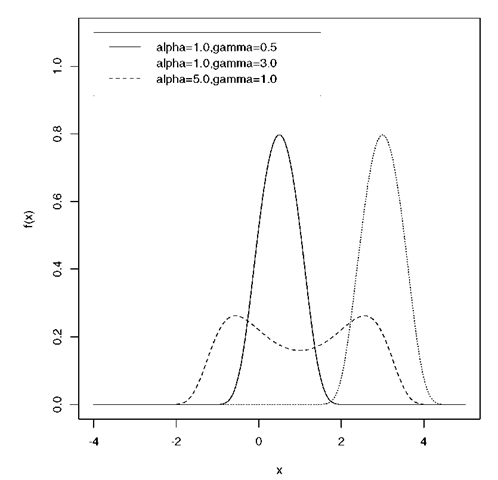
Fig. 123 Sinh-normal distributions for several values of a and y.
Skew-normal distribution:
A probability distribution, f (x), given by
For X = 0 this reduces to the standard normal distribution.
Skew-symmetric matrix:
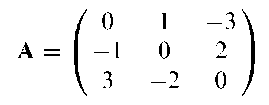
A matrix in which the elements aj satisfy
An example of such a matrix is A given by
Sliced inverse regression:
A data-analytic tool for reducing the number of explanatory variables in a regression modelling situation without going through any parametric or nonparametric model-fitting process. The method is based on the idea of regressing each explanatory variable on the response variable, thus reducing the problem to a series of one-dimensional regressions.
Fig. 124 Examples of skewed distributions.
Sliding square plot:
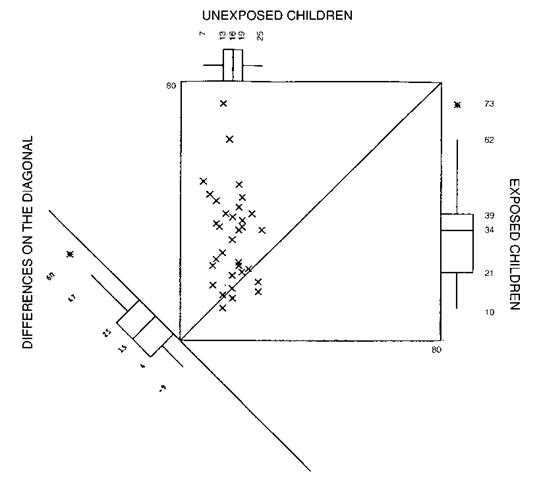
A graphical display of paired samples data. A scatterplot of the n pairs of observations (xt, y) forms the basis of the plot, and this is enhanced by three box-and-whisker plots, one for the first observation in each pair (i.e. the control subject or the measurement taken on the first occasion), one for the remaining observation and one for the differences between the pairs, i.e. x — y. See Fig. 125 for an example.
Slime plot:
A method of plotting circular data recorded over time which is useful in indicating changes of direction.
Slope ratio assay:
A general class of biological assay where the dose-response lines for the standard test stimuli are not in the form of two parallel regression lines but of two different lines with different slopes intersecting the ordinate corresponding to zero dose of the stimuli. The relative potency of these stimuli is obtained by taking the ratio of the estimated slopes of the two lines.
Slutzky, Eugen (1880-1948):
Born in Yaroslaval province, Slutsky entered the University of Kiev as a student of mathematics in 1899 but was expelled three years later for revolutionary activities. After studying law he became interested in political economy and in 1918 received an economic degree and became a professor at the Kiev Institute of Commerce. In 1934 he obtained an honorary degree in mathematics from Moscow State University, and took up an appointment at the Mathematical Institue of the Academy of Sciences of the Soviet Union, an appointment he held until his death. Slutsky was one of the originators of the theory of stochastic processes and in the last years of his life studied the problem of compiling tables for functions of several variables.
Slutzky-Yule effect:
The introduction of correlations into a time series by some form of smoothing. If, for example, fxt} is a white noise sequence in which the observations are completely independent, then the series fyt} obtained as a result of applying a moving average of order 3, i.e.
yt = (xt-1 + xt + xt+1 )/3
consists of correlated observations. The same is true if fxt} is operated on by any linear filter.
Fig. 125 An example of a sliding square plot for blood lead levels of matched pairs of children.
Small expected frequencies:
A term that is found in discussions of the analysis of contingency tables. It arises because the derivation of the chi-squared distribution as an approximation for the distribution of the chi-squared statistic when the hypothesis of independence is true, is made under the assumption that the expected frequencies are not too small. Typically this rather vague phrase has been interpreted as meaning that a satisfactory approximation is achieved only when expected frequencies are five or more. Despite the widespread acceptance of this ‘rule’, it is nowadays thought to be largely irrelevant since there is a great deal of evidence that the usual chi-squared statistic can be used safely when expected frequencies are far smaller.
Smear-and-sweep:
A method of adjusting death rates for the effects of confounding variables. The procedure is iterative, each iteration consisting of two steps. The first entails ‘smearing’ the data into a two-way classification based on two of the confounding variables, and the second consists of ‘sweeping’ the resulting cells into categories according to their ordering on the death rate of interest.
Smith, Cedric Austen Bardell (1917-2002):
Born in Leicester, UK, Smith won a scholarship to Trinity College, Cambridge, in 1935 from where he graduated in mathematics with first-class honours in 1938. He then began research in statistics under Bartlett, J. Wishart and Irwin, taking his doctorate in 1942. After World War II Smith became Assistant Lecturer at the Galton Laboratory, eventually becoming Weldon Professor in 1964. It was during this period that he worked on linkage analysis, introducing ‘lods’ (log-odds) to linkage studies and showing how to compute them. Later he introduced a Bayesian approach to such studies. Smith died on 16 January 2002.
Smoothing methods:
A term that could be applied to almost all techniques in statistics that involve fitting some model to a set of observations, but which is generally used for those methods which use computing power to highlight unusual structure very effectively, by taking advantage of people’s ability to draw conclusions from well-designed graphics. Examples of such techniques include kernel methods, spline functions, nonparametric regression and locally weighted regression.
SMR:
Acronym for standardized mortality rate.
S-N curve:
A curve relating the effect of a constant stress (S) on the test item to the number of cycles to failure (N).
Snedecor, George Waddel (1881-1974):
Born in Memphis, Tennessee, USA, Snedecor studied mathematics and physics at the Universities of Alabama and Michigan. In 1913 he became Assistant Professor of Mathematics at Iowa State College and began teaching the first formal statistics course in 1915. In 1927 Snedecor became Director of a newly created Mathematical Statistical Service in the Department of Mathematics with the remit to provide a campus-wide statistical consultancy and computation service. He contributed to design of experiments, sampling and analysis of variance and in 1937 produced a best selling topic Statistical Methods, which went through seven editions up to 1980. Snedecor died on 15 February 1974 in Amherst, Massachusetts.
Snedecor’s F-distribution:
Synonym for F-distribution.
Snowball sampling:
A method of sampling that uses sample members to provide names of other potential sample members. For example, in sampling heroin addicts, an addict may be asked for the names of other addicts that he or she knows. Little is known about the statistical properties of such samples.
Snowflakes:
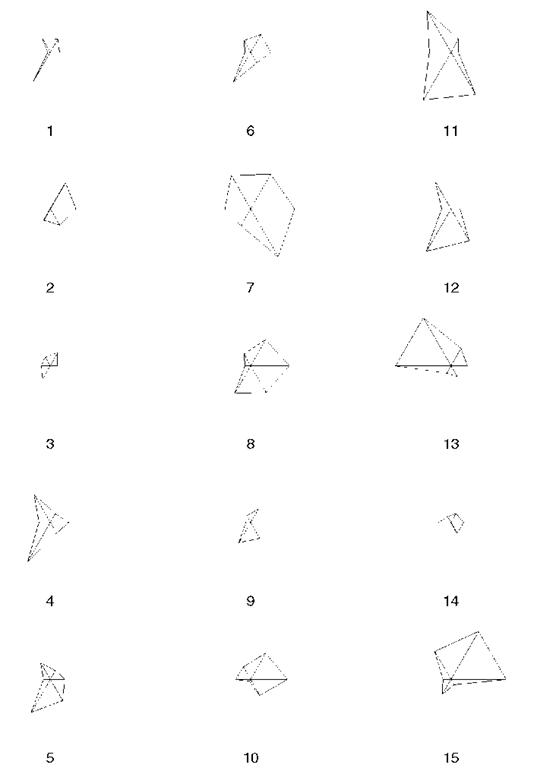
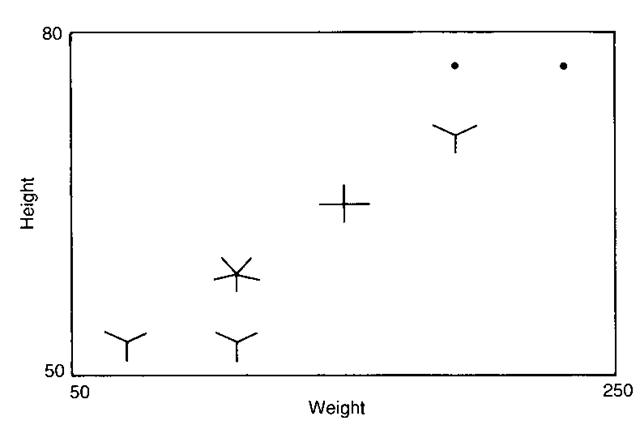
A graphical technique for displaying multivariate data. For q variables, a snow-flake is constructed by plotting the magnitude of each variable along equiangular rays originating from the same point. Each observation corresponds to a particular shaped snowflake and these are often displayed side-by-side for quick visual inspection. An example is given in Fig. 126. See also Andrews’ plots, Chernoffs faces and glyphs.
Sobel and Weiss stopping rule:
A procedure for selecting the ‘better’ (higher probability of success, p) of two independent binomial distributions. The observations are obtained by a play-the-winnerrule in which trials are made one at a time on either population and a success dictates that the next observation be drawn from the same population while a failure causes a switch to the other population. The proposed stopping rule specifies that play-the-winner sampling continues until r successes are obtained from one of the populations. At that time sampling is terminated and the population with r successes is declared the better. The constant r is chosen so that the procedure satisfies the requirement that the probability of correct selection is at least some pre-specified value whenever the difference in the P-values is at least some other specified value. See also play-the-winner rule.
Fig. 126 A set of snowflakes for fifteen, six-dimensional multivariate observations.
Sojourn time:
Most often used for the interval during which a particular condition is potentially detectable but not yet diagnosed, but also occurs in the context of Markov chains as the number of times state k say, is visited in the first n transitions.
SOLAS:
Software for multiple imputation.
SOLO:
A computer package for calculating sample sizes to achieve a particular power for a variety of different research designs. See also nQuery advisor.
Somer’s d:
A measure of association for a contingency table with ordered row and column categories that is suitable for the asymmetric case in which one variable is considered the response and one explanatory. See also Kendall’s tau statistics.
Sorted binary plot:
A graphical method for identifying and displaying patterns in multivariate data sets.
Sources of data:
Usually refers to reports and government publications giving, for example, statistics on cancer registrations, number of abortions carried out in particular time periods, number of deaths from AIDS, etc. Examples of such reports are those provided by the World Health Organization, such as the World Health Statistics Annual which details the seasonal distribution of new cases for about 40 different infectious diseases, and the World Health Quarterly which includes statistics on mortality and morbidity.
Space-time clustering:
An approach to the analysis of epidemics that takes account of three components:
• the time distribution of cases;
• the space distribution;
• a measure of the space-time interaction.
The analysis uses the simultaneous measurement and classification of time and distance intervals between all possible pairs of cases.
Sparsity-of-effect principle:
The belief that in many industrial experiments involving several factors the system or process is likely to be driven primarily by some of the main effects and low-order interactions. See also response surface methodology.
Spatial automodels:
Spatial processes whose probability structure is dependent only upon contributions from neighbouring observations and where the conditional probability distribution associated with each site belongs to the exponential family.
Spatial cumulative distribution function:
A random function that provides a statistical summary of a random field over a spatial domain of interest.
Spatial data:
A collection of measurements or observations on one or more variables taken at specified locations and for which the spatial organization of the data is of primary interest.
Spatial experiment:
A comparative experiment in which experimental units occupy fixed locations distributed throughout a region in one-, two- or three-dimensional space. Such experiments are most common in agriculture.
Spatial median:
An extension of the concept of a median to bivariate data. Defined as the value of 0 that minimizes the measure of scatter, T(0), given by
T(0) = Y, Ix,- – 0|
where | | is the Euclidean distance and x1, x2,…, xn are n bivariate observations. See also bivariate Oja median. [Journal of the Royal Statistical Society, Series B, 1995, 57, 565-74.]
Spatial process:
The values of random variables defined at specified locations in an area.
Spearman-Brown prophesy formula: A formula arising in assessing the reliability of measurements particularly in respect of scores obtained from psychological tests. Explicitly if each subject has k parallel (i.e. same true score, same standard error of measurement) measurements then the reliability of their sum is
where R is the ratio of the true score variance to the observed score variance of each measurement. [Statistical Evaluation of Measurement Errors: Design and Analysis of Reliability Studies, 2004, G. Dunn, Arnold, London.]
Spearman-Karber estimator:
An estimator of the median effective dose in bioassays having a binary variable as a response.
Spearman’s rho:
A rank correlation coefficient. If the ranked values of the two variables for a set of n individuals are a, and b,-, with d, = a, — b,-, then the coefficient is defined explicitly as
In essence p is simply Pearson s product moment correlation coefficient between the rankings a and b. See also Kendall’s tau statistics.
Specificity:
An index of the performance of a diagnostic test, calculated as the percentage of individuals without the disease who are classified as not having the disease, i.e. the conditional probability of a negative test result given that the disease is absent. A test is specific if it is positive for only a small percentage of those without the disease. See also sensitivity, ROC curve and Bayes’ theorem.
Spectral analysis:
A procedure for the analysis of the frequencies and periodicities in time series data. The time series is effectively decomposed into an infinite number of periodic components, each of infinitesimal amplitude, so the purpose of the analysis is to estimate the contributions of components in certain ranges of frequency, !, i.e. what is usually referred to as the spectrum of the series, often denoted h(n). The spectrum and the autocovariance function, y(k), are related by
The implication is that all the information in the autocovariances is also contained in the spectrum and vice versa. Such an analysis may show that contributions to the fluctuations in the time series come from a continuous range of frequencies, and the pattern of spectral densities may suggest a particular model for the series. Alternatively the analysis may suggest one or two dominant frequencies. See also harmonic analysis, power spectrum and fast Fourier transform.
Spectral radius:
A term sometimes used for the size of the largest eigenvalue of a variance-covariance matrix.
Spherical variable:
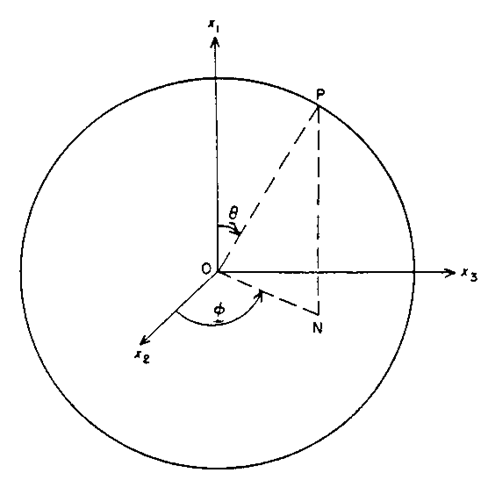
An angular measure confined to be on the unit sphere. Figure 127 shows a representation of such a variable.
Sphericity test:
Synonym for Mauchly test.
Spiegel man, Mortimer (1901-1969):
Born in Brooklyn, New York, Spiegelman received a masters of engineering degree from the Polytechnic Institute of Brooklyn in 1923 and a masters of business administration degree from Harvard University in 1925. He worked for 40 years for the Metropolitan Life Insurance Office and made important contributions to biostatistics particularly in the areas of demography and public health. Spiegelman died on 25 March 1969 in New York.
Splicing:
A refined method of smoothing out local peaks and troughs, while retaining the broad ones, in data sequences contaminated with noise.
Spline function:
A smoothly joined piecewise polynomial of degree n. For example, if t\; t2,…, tn are a set of n values in the interval a,b, such that a < t\ < t2 < ••• < tn < b, then a cubic spline is a function g such that on each of the intervals (a, t{), (t{, t2),…, (tn, b), g is a cubic polynomial, and secondly the polynomial pieces fit together at the points tt in such a way that g itself and its first and second derivatives are continuous at each tt and hence on the whole of a, b. The points tt are called knots. A commonly used example is a cubic spline for the smoothed estimation of the function f in the following model for the dependence of a response variable y on an explanatory variable x
y = f (x) + e
where e represents an error variable with expected value zero. The starting point for the construction of the required estimator is the following minimization problem; find f to minimize
where primes represent differentiation. The first term is the residual sum of squares which is used as a distance function between data and estimator. The second term penalizes roughness of the function. The parameter X > 0 is a smoothing parameter that controls the trade-off between the smoothness of the curve and the bias of the estimator. The solution to the minimization problem is a cubic polynomial between successive x-values with continuous first and second derivatives at the observation points. Such curves are widely used for interpolation for smoothing and in some forms of regression analysis. See also Reinsch spline. [Journal of the Royal Statistical Society, Series B, 1985, 47, 1-52.]
Fig. 127 An illustration of a spherical variable.
Split-half method:
A procedure used primarily in psychology to estimate the reliability of a test. Two scores are obtained from the same test, either from alternative items, the so-called odd-even technique, or from parallel sections of items. The correlation of these scores, or some transformation of them gives the required reliability. See also Cronbach’s alpha.
Split-lot design:
A design useful in experiments where a product is formed from a number of distinct processing stages. Each factor is applied to one and only one of the processing stages with at each of these stages a split-plot structure being used.
Split-plot design:
A term originating in agricultural field experiments where the division of a testing area or ‘plot’ into a number of parts permitted the inclusion of an extra factor into the study. In medicine similar designs occur when the same patient or subject is observed at each level of a factor, or at all combinations of levels of a number of factors. See also longitudinal data and repeated measures data.
S-PLUS:
A high level programming language with extensive graphical and statistical features that can be used to undertake both standard and non-standard analyses relatively simply.
Spread:
Synonym for dispersion.
Spreadsheet:
In computer technology, a two-way table, with entries which may be numbers or text. Facilities include operations on rows or columns. Entries may also give references to other entries, making possible more complex operations. The name is derived from the sheet of paper employed by an accountant to set out financial calculations, often so large that it had to be spread out on a table.
SPSS:
A statistical software package, an acronym for Statistical Package for the Social Sciences.
A comprehensive range of statistical procedures is available and, in addition, extensive facilities for file manipulation and re-coding or transforming data.
Spurious correlation:
A term usually reserved for the introduction of correlation due to computing rates using the same denominator. Specifically if two variables X and Y are not related, then the two ratios X/Z and Y/Z will be related, where Z is a further random variable.
Spurious precision:
The tendency to report results to too many significant figures, largely due to copying figures directly from computer output without applying some sensible rounding. See also digit preference.
SQC:
Abbreviation for statistical quality control.
Square contingency table:
A contingency table with the same number of rows as columns.
Square matrix:
A matrix with the same number of rows as columns. Variance-covariance matrices and correlation matrices are statistical examples.
Square root rule:
A rule sometimes considered in the allocation of patients in a clinical trial which states that if it costs r times as much to study a subject on treatment A than B, then one should allocate .Jr times as many patients to B than A. Such a procedure minimizes the cost of a trial while preserving power.
Square root transformation:
A transformation of the form y = -Jx often used to make random variables suspected to have a Poisson distribution more suitable for techniques such as analysis of variance by making their variances independent of their means. See also variance stabilizing transformations.
Staggered entry:
A term used when subjects are entered into a study at times which are related to their own disease history (e.g, immediately following diagnosis) but which are unpredictable from the point-of-view of the study.
Stahel-Donoho robust multivariate estimator:
An estimator of multivariate location and scatter obtained as a weighted mean and a weighted variance-covariance matrix with weights of the form W(r), where W is a weight function and r quantifies the extent to which an observation may be regarded as an outlier. The estimator has high breakdown point. See also minimum volume ellipsoid estimator.
Staircase method:
Synonym for up-and-down method.
Stalactite plot:
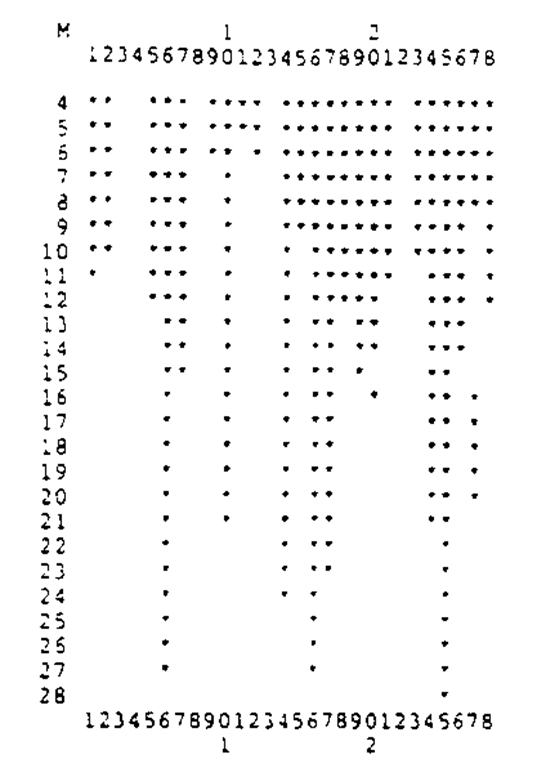
A plot useful in the detection of multiple outliers in multivariate data, that is based on Mahalanobis distances calculated from means and covariances estimated from increasing sized subsets of the data. The aim is to reduce the masking effect that can arise due to the influence of outliers on the estimates of means and covariances obtained from all the data. The central idea is that, given distances using m observations for estimation of means and covariances, the m + 1 observations to be used for this estimation in the next stage are chosen to be those with the m + 1 smallest distances. Thus an observation can be included in the subset used for estimation for some value of m, but can later be excluded as m increases. The plot graphically illustrates the evolution of the set of outliers as the size of the fitted subset m increases. Initially m is usually chosen as q + 1 where q is the number of variables, since this is the smallest number allowing the calculation of the required Mahalanobis distances. The cut-off point generally employed to define an outlier is the maximum expected value from a sample of n (the sample size) random variables having a chi-squared distribution on q degrees of freedom given approximately by Xp{(n — 0.5)/n}. In the example shown in Fig. 128 nearly all the distances are large enough initially to indicate outliers. For m > 21 there are five outliers indicated, observations 6,14,16,17, and 25. For m > 24 only three outliers are indicated, 6,16 and 25. The masking effect of these outliers is shown by the distances for the full sample: only observation 25 has a distance greater than the maximum expected chi-squared.
STAMP:
Structural Time series Analyser, Modeller and Predictor, software for constructing a wide range of structural time series models.
Standard curve:
The curve which relates the responses in an assay given by a range of standard solutions to their known concentrations. It permits the analytic concentration of an unknown solution to be inferred from its assay response by interpolation.
Standard design:
Synonym for Fibonacci dose escalation scheme.
Standard deviation:
The most commonly used measure of the spread of a set of observations. Equal to the square root of the variance.
Standard error:
The standard deviation of the sampling distribution of a statistic. For example, the standard error of the sample mean of n observations is o/^Jn, where o2 is the variance of the original observations.
Standard gamble:
An alternative name for the von Neumann-Morgensten standard gamble.
Fig. 128 An example of a stalactite plot.
Standardization:
A term used in a variety of ways in medical research. The most common usage is in the context of transforming a variable by dividing by its standard deviation to give a new variable with standard deviation 1. Also often used for the process of producing an index of mortality, which is adjusted for the age distribution in a particular group being examined. See also standardized mortality rate, indirect standardization and direct standardization.
Standardized mortality rate (SMR):
The number of deaths, either total or cause- specific, in a given population, expressed as a percentage of the deaths that would have been expected if the age and sex-specific rates in a ‘standard’ population had applied.
Standard normal variable:
A variable having a normal distribution with mean zero and variance one.
Standard scores:
Variable values transformed to zero mean and unit variance.
Star plot:
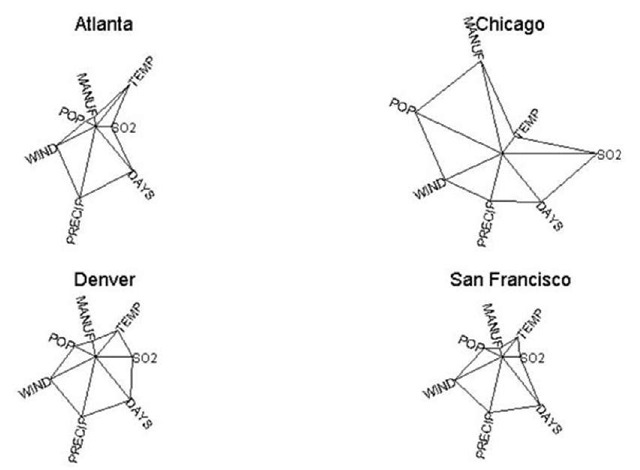
A method of representing multivariate data graphically. Each observation is represented by a ‘star’ consisting of a sequence of equiangular spokes called radii, with each spoke representing one of the variables. The length of a spoke is proportional to the value of the variable it represents relative to the maximum value of the variable across all the observations in the sample. The plot can be illustrated on the data on air pollution for four cities in the United States given in the profile plots entry. The star plots of each city are shown in Fig. 129. Chicago is clearly identified as being very different from the other four cities.
Fig. 129 Star plots for air pollution data from four cities in the United States.
STATA:
A comprehensive software package for many forms of statistical analysis; particularly useful for epidemiological and longitudinal data.
State-space representation of time series:
A compact way of describing a time series based on the result that any finite-order linear difference equation can be rewritten as a first-order vector difference equation. For example, consider the following auto-regressive model
The original model involves a two-stage dependence but the rewritten version involves only a (vector) one-stage dependence.
Stationarity:
A term applied to time series or spatial data to describe their equilibrium behaviour. For such a series represented by the random variables, Xt , Xt ,…, Xt , the key aspect of the term is the invariance of their joint distribution to a common translation in time. So the requirement of strict stationarity is that the joint distribution of {Xh, Xt2,…, Xtn} should be identical to that of {Xh+h, Xh+h,…, Xtn+h} for all integers n and all allowable h, —i < h < i. This form of stationarity is often unnecessarily rigorous. Simpler forms are used in practice, for example, stationarity in mean which requires that E{Xt} does not depend on t. The most used form of stationarity, second-order stationarity, requires that the moments up to the second order, E{Xt}, var{Xt} and cov{Xt.+h, Xt +h}, 1 < i, j < n do not depend on translation time. [TM2 Chapter 2.] i j
Stationary point process:
A stochastic process defined by the following requirements:
(a) The distribution of the number of events in a fixed interval (t1, t2) is invariant under translation, i.e. is the same for (t1 + h, t2 + h] for all h.
(b) The joint distribution of the number of events in fixed intervals (t1, t2], (t3, t4] is invariant under translation, i.e. is the same for all pairs of intervals (t1 + h, t2 + h], (t3 + h, t4 + h] for all h.
Consequences of these requirements are that the distribution of the number of events in an interval depends only on the length of the interval and that the expected number of events in an interval is proportional to the length of the interval.
Statistic:
A numerical characteristic of a sample. For example, the sample mean and sample variance. See also parameter.
Statistical expert system:
A computer program that leads a user through a valid statistical analysis, choosing suitable tools by examining the data and interrogating the user, and explaining its actions, decisions, and conclusions on request.
Statistical quality control (SPC):
The inspection of samples of units for purposes relating to quality evaluation and control of production operations, in particular to:
(1) determine if the output from the process has undergone a change from one point in time to another;
(2) make a determination concerning a finite population of units concerning the overall quality;
(3) screen defective items from a sequence or group of production units to improve the resulting quality of the population of interest.
Statistical quotations:
These range from the well known, for example, ‘a single death is a tragedy, a million deaths is a statistic’ (Joseph Stalin) to the more obscure ‘facts speak louder than statistics’ (Mr Justice Streatfield). Other old favourites are ‘I am one of the unpraised, unrewarded millions without whom statistics would be a bankrupt science. It is we who are born, marry and who die in constant ratios.’ (Logan Pearsall Smith) and ‘thou shalt not sit with statisticians nor commit a Social Science’ (W.H. Auden).
Statistical software:
A set of computer programs implementing commonly used statistical methods. See also BMDP, GLIM, GENSTAT, MINITAB, RSAS, S-PLUS, SPSS, EGRET, STATA, NANOSTAT, BUGS, OSWALD, STATXACT and LOGXACT.
Statistical surveillance:
The continual observation of a time series with the goal of detecting an important change in the underlying process as soon as possible after it has occurred. An example of where such a procedure is of considerable importance is in monitoring foetal heart rate during labour.
Statistics for the terrified:
A computer-aided learning package for statistics. See also Activ Stats.
STAT/TRANSFER:
Software for moving data from one proprietary format to another.
STATXACT:
A specialized statistical package for analysing data from contingency tables that provides exact P-values, which, in the case of sparse tables may differ considerable from the values given by asymptotic statistics such as the chi-squared statistic.
Steepest descent:
A procedure for finding the maximum or minimum value of several variables by searching in the direction of the positive (negative) gradient of the function with respect to the parameters. See also simplex method and Newton-Raphson method.
Stem-and-leaf plot:
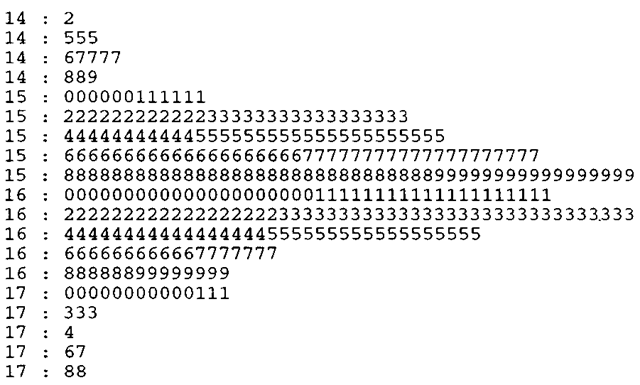
A method of displaying data in which each observation is split into two parts labelled the ‘stem’ and the ‘leaf’. A tally of the leaves corresponding to each stem has the shape of a histogram but also retains the actual observation values. See Fig. 130 for an example. See also back-to-back stem-and-leaf plot.
Fig. 130 A stem-and-leaf plot for the heights of 351 elderly women.
Stereology:
The science of inference about three-dimensional structure based on two-dimensional or one-dimensional probes. Has important applications in mineralogy and metallurgy.
Stirling’s formula:
The formula
n! « e~n
The approximation is remarkably accurate even for small n. For example 5! is approximated as 118.019. For 100! the error is only 0.08%.
Stochastic approximation:
A procedure for finding roots of equations when these roots are observable in the presence of statistical variation.
Stochastic frontier models:
Models that postulate a function h(-) relating a vector of explanatory variables, x, to an output, y
y = h(x)
where the function h(-) is interpreted as reflecting best practice, with individuals typically falling short of this benchmark. For an individual i, who has a measure of this shortfall, ri with 0 < ri < 1
yi = h(x)ti
The model is completed by adding measurement error (usually assumed to be normal) choosing a particular functional form for h(-) and a distribution for ri.
Stochastic process:
A series of random variables, {Xt}, where t assumes values in a certain range T. In most cases xt is an observation at time t and T is a time range. If T = {0, 1, 2,…} the process is a discrete time stochastic process and if T is a subset of the nonnegative real numbers it is a continuous time stochastic process. The set of possible values for the process, T, is known as its state space. See also Brownian motion, Markov chain and random walk. [Theory of Stochastic Processes, 1977, D.R. Cox and H.D. Miller, Chapman and Hall/CRC Press, London.]
Stopping rules:
Procedures that allow interim analyses in clinical trials at predefined times, while preserving the type I error at some pre-specifiied level.
Stratification:
The division of a population into parts known as strata, particularly for the purpose of drawing a sample.
Stratified Cox models:
An extension of Cox’s proportional hazards model which allows for multiple strata which divide the subjects into distinct groups, each of which has a distinct baseline hazard function but common values for the coefficient vector p.
Stratified logrank test:
A method for comparing the survival experience of two groups of subjects given different treatments, when the groups are stratified by age or some other prognostic variable. [Modelling Survival Data in Medical Research, 2nd edition, 2003, D. Collett, Chapman and Hall/CRC Press, London.]
Stratified randomization:
A procedure designed to allocate patients to treatments in clinical trials to achieve approximate balance of important characteristics without sacrificing the advantages of random allocation. See also minimization.
Stratified random sampling:
Random sampling from each strata of a population after stratification.
Streaky hypothesis:
An alternative to the hypothesis of independent Bernoullitrials with a constant probability of success for the performance of athletes in baseball, basketball and other sports. In this alternative hypothesis, there is either nonstationarity where the probability of success does not stay constant over the trials or autocorrelation where the probability of success on a given trial depends on the player’s success in recent trials.
Stress:
A term used for a particular measure of goodness-of-fit in multidimensional scaling.
Strip-plot designs:
A design sometimes used in agricultural field experiments in which the levels of one factor are assigned to strips of plots running through the block in one direction. A separate randomization is used in each block. The levels of the second
factor are then applied to strips of plots that are oriented perpendicularly to the strips for the first factor. [The Design of Experiments, 1988, R. Mead, Cambridge University Press, Cambridge.]
Structural equation modelling:
A procedure that combines aspects of multiple regression and factor analysis, to investigate relationships between latent variables.
Structural time series models:
Regression models in which the explanatory variables are functions of time, but with coefficients which change over time. Thus within a regression framework a simple trend would be modelled in terms of a constant and time with a random disturbance added on, i.e.
This model suffers from the disadvantage that the trend is deterministic, which is too restrictive in general so that flexibility is introduced by letting the coefficients a and p evolve over time as stochastic processes. In this way the trend can adapt to underlying changes. The simplest such model is for a situation in which the underlying level of the series changes over time and is modelled by a random walk, on top of which is superimposed a white noise disturbance. Formally the proposed model can be written as
for t = 1,…, T, ;t ~ N(0, aff2) and ft ~ N(0, o^). Such models can be used for forecasting and also for providing a description of the main features of the series. See also STAMP. [Statistical Methods in Medical Research, 1996, 5, 23-49.]
Structural zeros:
Zero frequencies occurring in the cells of contingency tables which arise because it is theoretically impossible for an observation to fall in the cell. For example, if male and female students are asked about health problems that cause them concern, then the cell corresponding to say menstrual problems for men will have a zero entry. See also sampling zeros. [The Analysis of Contingency Tables, 2nd edition, 1992, B.S. , Chapman and Hall/CRC Press, London.]
Stuart, Alan (1922-1998):
After graduating from the London School of Economics (LSE), Stuart began working there as a junior research officer in 1949. He spent most of his academic career at the LSE, working in particular on nonparametric tests and sample survey theory. Stuart is probably best remembered for his collaboration with Maurice Kendall on the Advanced Theory of Statistics.
Stuart-Maxwell test:
A test of marginal homogeneity in a square contingency table. The test statistic is given by
where d is a column vector of any r — 1 differences of corresponding row and column marginal totals with r being the number of rows and columns in the table. The (r — 1)x(r — 1) matrix V contains variances and covariances of these differences, i.e.
where n– are the observed frequencies in the table and ni: and n- are marginal totals. If the hypothesis of marginal homogeneity is true then X2 has a chi-squared distribution with r — 1 degrees of freedom. [SMR Chapter 10.]
Studentization:
The removal of a nuisance parameter by constructing a statistic whose sampling distribution does not depend on that parameter.
Studentized range statistic:
A statistic that occurs most often in multiple comparison tests. It is defined as
where Xlargest and Xsmallest are the largest and smallest means among the means of k groups and MSE is the error mean square from an analysis of variance of the groups. [Biostatistics, 1993, L.D. Fisher and G. van Belle, Wiley, New York.]
Student’s f-distribution:
The distribution of the variable
where x is the arithmetic mean of n observations from a normal distribution with mean a and s is the sample standard deviation. Given explicitly by
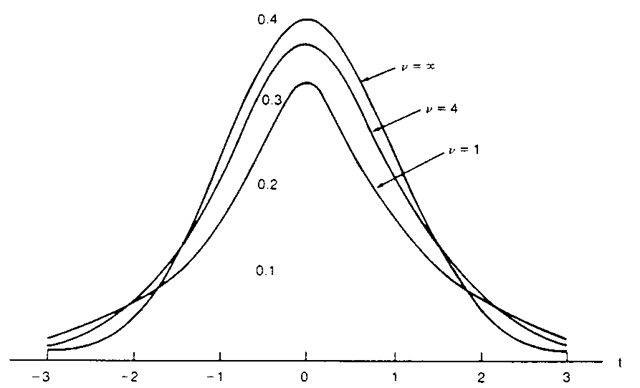
where v = n — 1. The shape of the distribution varies with v and as v gets larger the shape of the /-distribution approaches that of the standard normal distribution. Some examples of such distributions are shown in Fig. 131. A mutivariate version of this distribution arises from considering a q-dimensional vector x0 = [x1, x2, ..., xq] having a multivariate normal distribution with mean vector i and variance-covariance matrix R and defining the elements uf of a vector u as uf = + xf/y1/v, i = 1, 2, …, q where vy ~ xv. Then u has a multivariate Student’s t-distribution given by
Fig. 131 Examples of Student’s distributions at various values of v.
This distribution is often used in Bayesian inference because it provides a multivariate distribution with ‘thicker’ tails than the multivariate normal. For v = 1 the distribution is known as the multivariate Cauchy distribution.
Student’s t-tests:
Significance tests for assessing hypotheses about population means. One version is used in situations where it is required to test whether the mean of a population takes a particular value. This is generally known as a single sample t-test. Another version is designed to test the equality of the means of two populations. When independent samples are available from each population the procedure is often known as the independent samples t-test and the test statistic is
where and x2 are the means of samples of size n1 and n2 taken from each population, and s2 is an estimate of the assumed common variance given by
If the null hypothesis of the equality of the two population means is true t has a Student’s t-distribution with n1 + n2 — 2 degrees of freedom allowing P-values to be calculated. The test assumes that each population has a normal distribution but is known to be relatively insensitive to departures from this assumption. See also Behrens-Fisher problem and matched pairs t-test.
Sturdy statistics:
Synonym for robust statistics.
Sturges’ rule:
A rule for calculating the number of classes to use when constructing a histogram and given by no. of classes = log2 n + 1 where n is the sample size. See also Doane’s rule.
Subgroup analysis:
The analysis of particular subgroups of patients in a clinical trial to assess possible treatment-subset interactions. An investigator may, for example, want to understand whether a drug affects older patients differently from those who are younger. Analysing many subgroupings for treatment effects can greatly increase overall type I error rates. See also fishing expedition and data dredging.
Subjective endpoints:
Endpoints in clinical trials that can only be measured by subjective clinical rating scales.
Subjective probability:
Synonym for personal probability.
SUDAAN:
A software package consisting of a family of procedures used to analyse data from complex surveys and other observational and experimental studies including clustered data.
Sufficient statistic:
A statistic that, in a certain sense, summarizes all the information contained in a sample of observations about a particular parameter. In more formal terms this can be expressed using the conditional distribution of the sample given the statistic and the parameter f (y\s,6), in the sense that s is sufficient for 0 if this conditional distribution does not depend on 0. As an example consider a random variable x having the following gamma distribution;
Thus in this case the geometric mean of the observations is sufficient for the parameter. Such a statistic, which is a function of all other such statistics, is referred to as a minimal sufficient statistic.
Sukhatme, Panurang Vasudeo (1911-1997):
Born in Budh, India, Sukhatme graduated in mathematics in 1932 from Fergusson College in Pine. He received a Ph.D. degree from London University in 1936 and D.Sc. in statistics from the same university in 1939. Sukhatme started his career as statistical advisor to the Indian Council of Agricultural Research, and then became Director of the Statistics Division of the Food and Agriculture Organisation in Rome. He played a leading role in developing statistical techniques that were relevant to Indian conditions in the fields of agriculture, animal husbandry and fishery. In 1961 Sukhatme was awarded the Guy medal in silver by the Royal Statistical Society. He died in Pun on 28 January 1997.
Summary measure analysis:
Synonym for response feature analysis.
Sunflower plot:
A modification of the usual scatter diagram designed to reduce the problem of overlap caused by multiple points at one position (particularly if the data have been rounded to integers). The scatterplot is first partitioned with a grid and the number of points in each cell of the grid is counted. If there is only a single point in a cell, a dot is plotted at the centre of the cell. If there is more than one observation in a cell, a ‘sunflower’ icon is drawn on which the number of ‘petals’ is equal to the number of points falling in that cell. An example of such a plot is given in Fig. 132.
Fig. 132 A sunflower plot for height and weight.
Supercomputers:
Various definitions have been proposed, some based on price, ‘any computer costing more than 10 million dollars’, others on performance, ‘any computer where performance is limited by input/output rather than by CPU’. In essence super-computing relates to mass computing at ultra high speeds.
Super-Duper:
A random number generator arising from combining a number of simpler techniques.
Superefficient:
A term applied to an estimate which for all parameter values is asymptotically normal around the true value with a variance never exceeding and sometimes less than the Cramer-Rao lower bound.
Superleverage:
A term applied to observations in a non-linear model which have leverage exceeding one.
Supernormality:
A term sometimes used in the context of normal probability plots of residuals from, for example, a regression analysis. Because such residuals are linear functions of random variables they will tend to be more normal than the underlying error distribution if this is not normal. Thus a straight plot does not necessarily mean that the error distribution is normal. Consequently the main use of probability plots of this kind should be for the detection of unduly influential or outlying observations.
Supersaturated design:
A factorial design with n observations and k factors with k > n — 1.
If a main-effects model is assumed and if the number of significant factors is expected to be small, such a design can save considerable cost.
Support:
A term sometimes used for the likelihood to stress its role as a measure of the evidence produced by a set of observations for a particular value(s) of the parameter^) of a model.
Support function:
Synoymous with log-likelihood.
Suppressor variables:
A variable in a regression analysis that is not correlated with the dependent variable, but that is still useful for increasing the size of the multiple correlation coefficient by virtue of its correlations with other explanatory variables. The variable ‘suppresses’ variance that is irrelevant to prediction of the dependent variable.
Surface models:
A term used for those models for screening studies that consider only those events that can be directly observed such as disease incidence, prevelance and mortality. See also deep models.
Surrogate endpoint:
A term often encountered in discussions of clinical trials to refer to an outcome measure that an investigator considers is highly correlated with an end-point of interest but that can be measured at lower expense or at an earlier time. In some cases ethical issues may suggest the use of a surrogate. Examples include measurement of blood pressure as a surrogate for cardiovascular mortality, lipid levels as a surrogate for arteriosclerosis, and, in cancer studies, time to relapse as a surrogate for total survival time. Considerable controversy in interpretation can be generated when doubts arise about the correlation of the surrogate endpoint with the endpoint of interest or over whether or not the surrogate endpoint should be considered as an endpoint of primary interest in its own right.
Survey:
Synonym for sample survey.
Survival function:
The probability that the survival time of an individual is longer than some particular value. A plot of this probability against time is called a survival curve and is a useful component in the analysis of such data. See also product-limit estimator and hazard function.
Survival time:
Observations of the time until the occurrence of a particular event, for example, recovery, improvement or death.
Survivor function:
Synonym for survival function.
Suspended rootogram:
Synonym for hanging rootogram.
Switch-back designs:
Repeated measurement designs appropriate for experiments in which the responses of experimental units vary with time according to different rates. The design adjusts for the different rates by switching the treatments given to units in a balanced way.
Switching effect:
The effect on estimates of treatment differences of patients’ changing treatments in a clinical trial. Such changes of treatment are often allowed in, for example, cancer trials, due to lack of efficacy and/or disease progression. [Statistics in Medicine, 2005, 24, 1783-90.]
Switching regression model: A model linking a response variable y and q explanatory variables x1,…, xq and given by
y = P10 + P11x1 + P12x2 h—–h P1qxq + e1 with probability X
y = P20 + P21x1 + P22x2 +—–h fi2qxq + e2 with probability 1 – X
where e1 ~ N(0, of), e2 ~ N(0, a2) and X, of, o^ and the regression coefficients are unknown. See also change point problems. [Journal of the American Statistical Association, 1978, 73, 730-52.]
Sylvan’s estimator:
An estimator of the multiple correlation coefficient when some observations of one variable are missing. [Continuous Univariate Distributions, Volume 2, 2nd edition, 1995, N.L. Johnson, S. Kotz and N. Balakrishnan, Wiley, New York.]
Symmetrical distribution
: A probability distribution or frequency distribution that is symmetrical about some central value. [KA1 Chapter 1.]
Symmetric matrix:
A square matrix that is symmetrical about its leading diagonal, i.e. a matrix with elements ay such that ay = aj. In statistics, correlation matrices and variance-covariance matrices are of this form.
Symmetry in square contingency tables: See Bowker’s test for symmetry.
Synergism:
A term used when the joint effect of two treatments is greater than the sum of their effects when administered separately (positive synergism), or when the sum of their effects is less than when administered separately (negative synergism).
Synthetic risk maps:
Plots of the scores derived from a principal components analysis of the correlations among cancer mortality rates at different body sites.
SYSTAT:
A comprehensive statistical software package with particularly good graphical facilities.
Systematic allocation:
Procedures for allocating treatments to patients in a clinical trial that attempt to emulate random allocation by using some systematic scheme such as, for example, giving treatment A to those people with even birth dates, and treatment B to those with odd dates. While in principle unbiased, problems arise because of the openness of the allocation system, and the consequent possibility of abuse.
Systematic error:
A term most often used in a clinical laboratory to describe the difference in results caused by a bias of an assay. See also intrinsic error.
Systematic review:
Synonym for meta-analysis.

