Roaming brings significant profit to a wireless service provider’s bottom line. It is also one of the most popular services offered by service providers. Managing roaming services, however, is a challenge. There is minimal data available on roaming service from the network elements involved. Monitoring the network elements and associated signaling and data links for their availability status and performance provides a good indication of the network health but reveals very little about underlying services. In real-life situations, it is often observed that a roamer is not able to access a particular service although the network status shows no faults. For example, a network management center based on network element monitoring may not be able to generate an alert in case of an error in the routing table. An error in the routing table may result in roaming failure, as critical signaling messages such as update location may not be able reach HPLMN HLR. It is therefore necessary to evolve a different strategy for monitoring of services as complex as roaming.
Many times the disruption or degradation of roaming services goes unnoticed for a long time, resulting in loss of revenue, as roamers tend not to call customer care promptly. Inbound roamers, on encountering a problem, would rather move to another available network, as they have choice and no loyalty to any visited network, causing instant churn. Outbound roamers may not report back, as they are in a foreign country and report only after arrival to their home network. Therefore, it is important to monitor the roaming services proactively to detect degradation or disruption before the roamers notice it.
This topic examines various key quality indicators that characterize roaming services and how to monitor then proactively to ensure minimum disruption.
A typical user is not really aware and not concerned with how a particular service is designed and implemented. Generally, users express their degree of satisfaction in using a service in a nontechnical way. The user perception of quality is based simply on his/her experience in using services end to end. The network performance is a critical factor, but quality of service is not just about that. Other external factors, such as the mobile phone, service tariff, and customer care, all have a serious influence on user perception and resulting satisfaction. The question is how to measure the user perception on quality of service.
One of the most frequently used definitions for quality of service (QoS) is stated in ITU-T Recommendation E.800. It defines QoS from the end-user perspective and its relationship with the network performance.
The quality of service is the collective effect of service performance, which determines the degree of satisfaction of a user of the service.
ITU-T E.800 further defines network performance as:
The network performance is defined as the ability of a network portion to provide the functions related to communication between users.
Network providers measure the performance of their network portions or individual service components against the agreed key performance indicators (KPIs). By definition, the KPIs are network focused. The KPIs are very useful and important measurements for network operations, as they indicate the health of a service component. However, they alone cannot be used to specify a user’s QoS requirements nor represent end-to-end service delivery quality. As the user is concerned only with the end product offered by service/network providers, new key quality indicators (KQIs) are defined to measure a specific aspect of the performance of the product and product components, i.e., services and service elements. The KQIs are derived from the KPIs and other data sources that may influence customer satisfaction.
Table 10-1 illustrates the distinction between network performance and quality of services as described in ETSI ETR 300 specification.
Service-independent quality indicators
Network accessibility. When a roamer tries to access the visiting network, the visited network authenticates the roamer with the home network and obtains roamer information by means of the update location procedure. The success of this action depends on the performance of both home and visited networks.
TABLE 10-1 NP and QoS
|
Network performance |
Quality of service |
|
Provider oriented, network focused |
User oriented, service focused |
|
Connection element attribute, e.g., throughput |
Service attribute, e.g., speed |
|
Focus on planning, design and development, operation and maintenance, e.g., error rate |
Focus on user-observable effects, e.g., accuracy |
|
End-to-end or network connection element capabilities, e.g., delay, delay variance |
Between (at) service access points, e.g., dependability |
■ The visited network provides radio access and routing of required messages back to the home country.
■ The home network updates the HLR with the new location and provides the necessary subscriber information to the visited network.
The UL success rate provides a good indication of the network coverage and security and is used as a measure of network accessibility for both GSM and GPRS networks from a roamer perspective. In GPRS, for example, it is indicated by ability to attach in the visited network.
Service-dependent quality indicators
Service accessibility. The service access quality is determined by the success rate of the services a roamer tries to access, such as establishing a voice call, receiving a voice call, and sending/receiving an SMS/MMS. The QoS as experienced by a user while using a service is termed service integrity. For example, speech quality in a voice call is an indicator of service integrity.
Service retainability. Service retainability describes the termination of services (in accordance with or against the will of the user). For example, once a user establishes a call and is in the conversation phase, it should remain in this phase till one of the parties decides to disconnect. However, in a real-life scenario, there is a possibility that the call will get terminated prematurely without the will of the users, e.g., because of blind spots in radio coverage.
Quality indicators by services
GSM services. Table 10-2 lists the key quality indicators (KQIs) for some popular GSM services used by a roamer. The formula to compute each KQI is also defined.
TABLE 10-2 GSM Services and KQIs
|
Services |
Services access—KQIs |
Abstract formula |
|
Voice calls |
Service accessibility Call setup time Speech quality Call completion rate (CCR) |
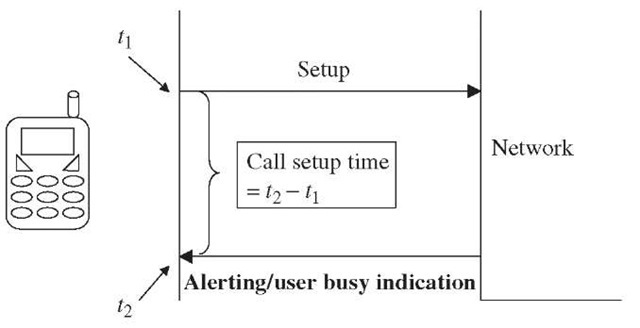
Service accessibility (%) = number of successful call attempts x 100/number of call attempts. See Figure 10-1. Speech quality is measured according to ITU-T Recommendation P.862. The quality is indicated in terms of MOS score. CCR (%) = number of intentionally terminated calls x 100/number of successful call attempts. |
|
SMS |
Service accessibility— MO-SMS Access delay— MO-SMS End-to-end delivery time Completion rate, SMS circuit switched |
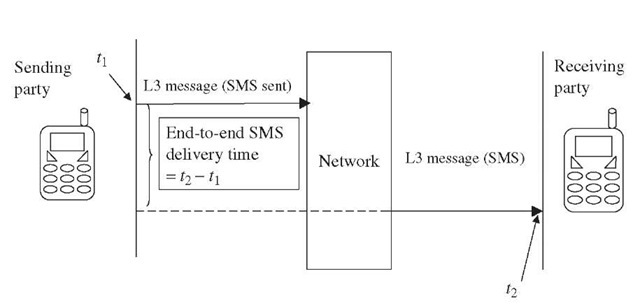
Service accessibility MO-SMS = number of successful SMS service attempts x 100/number of all SMS service attempts. See Figure 10-2. See Figure 10-3. CS = (successful received test SMS— duplicate Test SMS—corrupted test SMS) x 100/number of all test SMS sent. |
|
Circuit-switched data services |
Service accessibility Setup time Data quality |
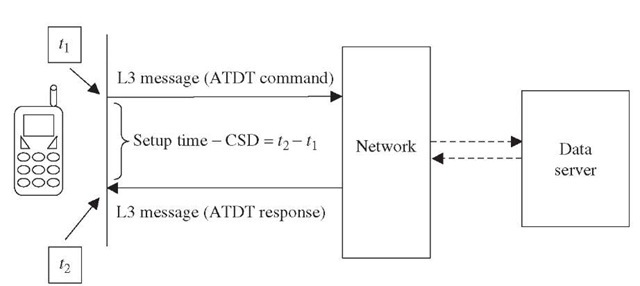
SA-CS (%) = Number of successful call attempts x 100/number of call attempts. See Figure 10-4. The end-to-end data quality (DQ) is measured in terms of average data throughput in both uplink and downlink directions on best-effort basis. For conversational class data: DQ (uplink) = X bits/second DQ (downlink) = X bits/second |
|
Completion rate |
For streaming class data: DQ (downlink) = X bits/second CR = number of calls terminated by end users/number of successful data call attempts. |
GPRS services. Table 10-3 lists the key quality indicators (KQIs) for a few popular GPRS services used by a roamer. The formula to compute each KQI is also defined.
QoS parameter for bearer-independent data services. The end-to-end data quality for bearer-independent data services is measured in terms of average throughput in bits/second during a session/call.
Figure 10-1 Call setup time for voice calls.
Figure 10-2 Access delay MO-SMS.
Figure 10-3 End-to-end SMS delivery time.
Figure 10-4 Setup time for circuit-switched data call.
TABLE 10-3 GPRS Services and KQIs
|
|
|
|
|
Services |
Services access—KQIs |
Abstract formula |
|
Packet-switched data |
Service accessibility rate |
SA = number of successful session |
|
services (GPRS) |
attempts/number of session attempts. |
|
|
Setup time |
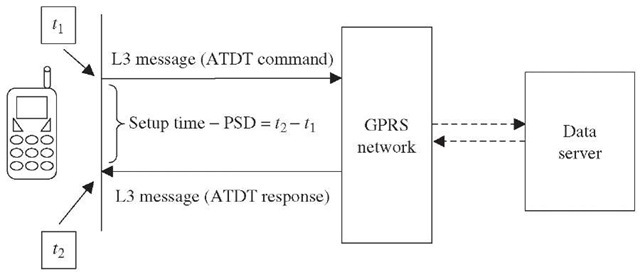
See Figure 10-5 for definition. |
|
|
Data quality |
The end-to-end data quality is measured in terms of average data throughput in both uplink and downlink directions on a best-effort basis. For conversational class data: DQ (uplink) = X bits/second DQ (downlink) = X bits/second For streaming class data: DQ (downlink) = X bits/second |
|
|
Completed session ratio |
CSR = number of sessions not released other than by end user/number of successful data session attempts. |
|
|
MMS |
Service accessibility rate (send) |
Service accessibility MMS-send = number of successful MMS (post) attempts x 100/ number of all MMS (post) attempts. |
|
Service accessibility rate (retrieve) |
Service accessibility MMS-receive = number of successful MMS (get) attempts x 100/number of all MMS (get) attempts. |
|
|
MMS send time |
See Figure 10-6. |
|
|
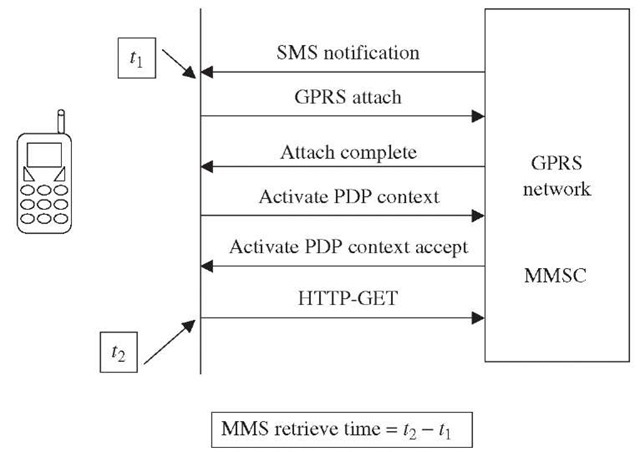
MMS retrieval time |
See Figure 10-7. |
Figure 10-5 Setup time for packet-switched data call.
Depending upon the traffic class, it is measured in uplink, downlink, or both directions. Table 10-4 lists the traffic classes and their characteristics. In addition to average throughput, the minimum and maximum throughput is also measured. To measure the minimum/maximum throughput, the call/session duration is divided into 10 blocks and average throughput is calculated for each block.
Figure 10-6 MMS send time.
Figure 10-7 MMS retrieve time.
TABLE 10-4 Traffic Classes
|
Traffic class and characteristics |
Data quality computation |
|
Conversational class, e.g., voice |
DQ (received A side) = X bits/second |
|
■ Preserve time relation |
DQ (received B side) = X bits/second |
|
■ No buffering |
|
|
■ Symmetric traffic |
|
|
■ Guaranteed bit rate |
|
|
Streaming class, e.g., |
Generally, streaming class data quality is |
|
streaming video |
measured in the downlink direction. However, |
|
■ Preserve time relation |
if the application requires streaming in the |
|
■ Minimum variable delay |
uplink direction, additional measurement |
|
■ Buffering allowed |
may be required. |
|
■ Asymmetric traffic |
DQ (received A side) = X bits/second |
|
■ Guaranteed bit rate |
|
|
Interactive class, e.g., Web browsing |
The end-to-end data transmission is computed by the time taken to download a specified file of a fixed data size from a data server. |
|
■ Request response pattern |
|
|
■ Preserve payload content |
|
|
■ Variable delay (moderate) |
DQ download time [seconds] = t2 – t1 |
|
■ Buffering allowed |
|
|
■ Asymmetric bit rate |
t1 = point of time when data request was sent |
|
■ No guaranteed bit rate |
t2 = point of time when data file was received without any errors |
|
Background, e.g., background |
Same as in case of interactive class |
|
download of email |
|
|
■ Preserve payload content |
|
|
■ Variable delay |
|
|
■ Buffering allowed |
|
|
■ Asymmetric bit rate |
|
|
■ No guaranteed bit rate |
