To begin our study, we’ll take a look at some images that illustrate the range of data types found in remote sensing and show how what we can learn from remote sensing varies with spatial resolution and wavelength. The illustrations are chosen to suggest the variety of organizations involved with remote sensing—military and civil systems dominate, but there are also important private systems. A recurrent point of these examples is the tension between spatial resolution and coverage, and the competing interests of temporal sampling. We begin with (nearly) whole-Earth visible imagery. The cover image from Apollo 17 illustrates several important points—in particular a vexing one for remote sensing: clouds. Do you see indications of intelligent life?
Visible
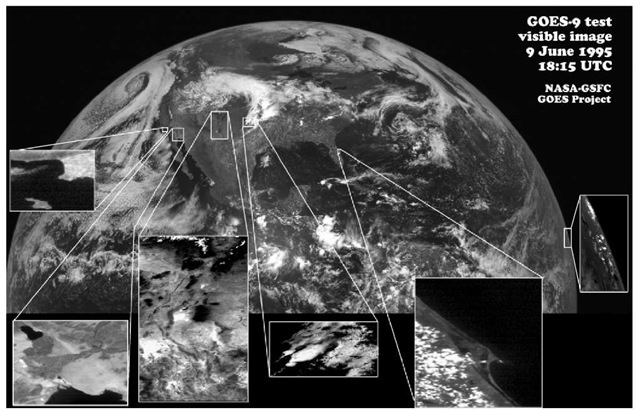
GOES, whole Earth
High-altitude satellites (such as weather satellites) image most of a hemisphere. The GOES-9 visible imager acquires an image of one hemisphere every 30 min, or the northern quad once every 15 min, with a spatial resolution of 1 km. The familiar weather news is frequently illustrated by images from GOES satellites.
Figure 1.9 GOES-9 visible image, June 9, 1995, 18:15 UTC.
What value do such data have for the military? For one thing, cloud coverage is revealed. Clouds are a major concern in modern warfare, directly affecting the ability of pilots and autonomous weapons to locate targets. This whole-Earth image also begins our illustration of the important tradeoffs between spatial resolution, fTequency of coverage, and area of coverage. High-altitude satellites, such as geosynchronous weather satellites, provide large-area coverage, more or less continuously, producing an image every 15-30 min, at a spatial resolution of 1 km, as noted.
DMSP (0.5 km), Earth at night
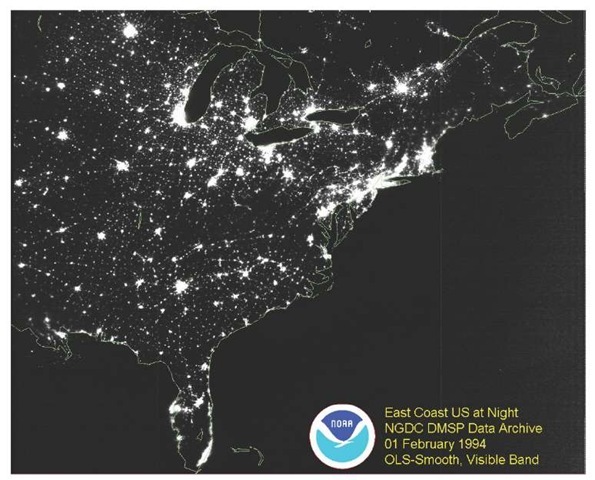
Similar spatial and temporal characteristics are found in a second example, from a complementary military weather system. The Defense Meteorological Satellite Program (DMSP) operates low Earth-orbiting satellites. These polar-orbiting satellites image the Earth at a resolution of 1 km during the day, with results similar to those from GOES. It provides coverage at high latitudes that cannot be obtained from geosynchronous systems, but with relatively poor temporal coverage; any given low- to mid-latitude region will be imaged only a few times a day. A more unusual capability emerges after dark.
Figure 1.10 DMSP image of the U.S. East Coast at night.
The operational line-scan system, photomultiplier tube (OLS-PMT) sensor on DMSP sees clouds at night. DMSP’s low-light capability includes the ability to see city lights, large fires (as of oil wells and forests), and the aurora borealis, as well as less-obvious light sources such as those produced by industrial activity. The image here was obtained at a spatial resolution of 2.6 km. The imager is designed to see clouds at night via moonshine; the brightness of city lights saturates the photomul-tiplier tube detectors (or photon counters).
UoSAT (100 m), San Francisco
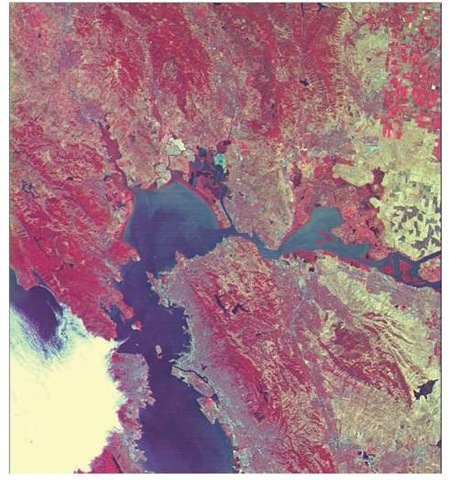
The third illustration in our sequence, a TMSAT image, improves spatial resolution by a factor of 10. UoSAT shows the possibilities inherent in small satellite technologies at remarkably low cost. Figure 1.11 shows imagery from a small satellite built by Surrey Satellite Technology, Ltd. (SSTL), one in a series of capable small satellites. SSTL is a commercial spin-off from the University of Surrey and the Surrey Space Centre. This image was taken by TMSAT, owned and operated by the Thai Microsatellite Company (TMSC), Bangkok, Thailand.
Figure 1.11 TMSAT image of San Francisco Bay. Various manmade features are discern-able, including the Bay Bridge connecting San Francisco and Oakland (though the Golden Gate Bridge is shrouded in fog), and the runways at San Francisco and Oakland airports, standing out as long straight lines on the bay shore. The variety of wavelengths gives additional information.
Red areas indicate dense, healthy vegetation (due to the strong, near-IR reflectance of chlorophyll), mainly forests on the Santa Cruz and Diablo mountains. Urban areas are generally blue-gray. To the right, the intensive agriculture of the Sacramento and San Joaquin valleys is visible as a patchwork of fields, whose colors indicate vegetative status (bare soil, marsh, young or mature vegetation, etc.).14
The TMSAT micro-satellite captured the image shown here on August 29, 1998, at 18:54:15 UTC (38.3°N 122.6°W) over the cities of Oakland and San Fran-cisco in California. This multispectral image was produced by combining the data from three narrow-angle cameras, sensing in the green, red, and near-IR spectra. Each image contains 1020 x 1020 pixels, covering an area of 100 x 100 km at a mean ground resolution of 98 m/pixel. Satellites like this run on the order of $2 million, delivered on orbit (as of the year 2000).
This imagery is a remarkable testimony to the possibilities inherent in small satellites. More recent launches by UoSAT involve sensors with 10-m resolution in the panchromatic band and 32-m resolution in the multispectral (e.g., color) bands. These robust systems cost about $10 million (circa 2004). A fairly recent model was UoSat-12, launched for Algeria as AlSAT-1. UoSAT expects to orbit 2-m resolution systems in the near future, at a similar price.
The main limitation in smaller systems is telemetry bandwidth, which limits overall coverage. Higher-bandwidth telemetry demands higher-power systems, and all such systems are considerably larger than the Surrey designs.
Landsat 5 (30 m), San Diego
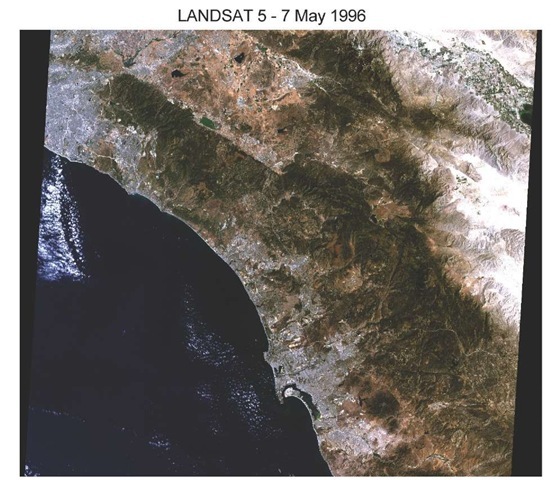
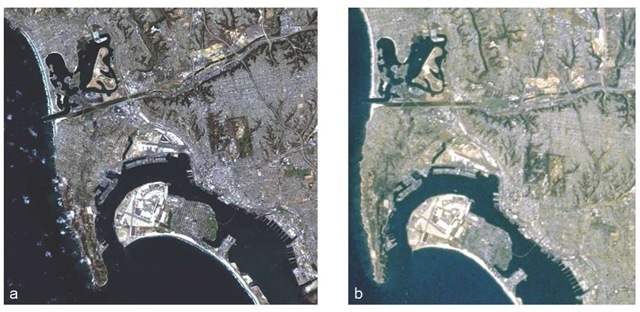
Multiple wavelength images (or multispectral) are most commonly applied to Earth resources. Landsat has been the flagship system for Earth resources studies of the Earth for over three decades. The low-Earth orbiting satellites image the whole Earth once every sixteen days. The Thematic Mapper (TM) sensors provide 30-m resolution imagery in seven spectral bands.15 The image in Fig. 1.12 was taken from three visible-wavelength sensors and combined to make a "true" color image. The top frame is one complete Landsat scene. Figure 1.13(a) shows a small segment covering San Diego Harbor. This image chip has been extracted to illustrate the highest resolution of the TM sensor.
Note that the Coronado Bridge is just visible crossing from San Diego to Coronado Island. Long linear features like bridges and roads show up well in imagery, even if they are narrow by comparison to pixel size. In comparison to an imager like GOES, the penalty paid for this high spatial resolution is a reduced field of view—nominally 185 km across in any image.
Astronaut photography
Landsat imagery gives a fair idea of what can be seen from space by the human eye. To further illustrate this, two images by astronauts, taken with handheld Hasselblad cameras from aboard the space shuttle, are included. Shuttle astronauts have produced a variety of noteworthy images over the years.
Spatial resolution in such photographic images is comparable to that of Landsat, but resolution varies with the satellite’s altitude and the lenses used. The standard telephoto, a (250 mm optic) yields resolution similar to that of Landsat, as illustrated in the photographic image of San Diego in Fig. 1.13(b), which is typical of the NASA film libraries’ astronaut photography. For the Hasselblad cameras, the 250 mm optic would be considered a 3* telephoto lens.
Figure 1.14 shows the effect of altitude. This photographic image of Egypt and Saudi Arabia was chosen because it is taken from an unusually high altitude for the shuttle, and a fairly large area can be seen. We find that North Africa and the Middle East are mostly cloud free, as with many Earth images.
Figure 1.12 Landsat 5 image of San Diego, May 7, 1996.
Figure 1.13 (a) Landsat 5 image enlarged, (b) Photographic image, STS064-080-021 (STS064 launch September 9, 1994).
Figure 1.14 Eastern Egypt, the Red Sea, and Saudi Arabia in a single view of the Near East (26.5N, 36.5E) from a 330-nautical-mile orbit on April 29, 1990. Easily seen are eastern Egypt, the Nile River, Lake Nassar, the Red Sea, and almost half of Saudi Arabia.
SPOT (10 m)
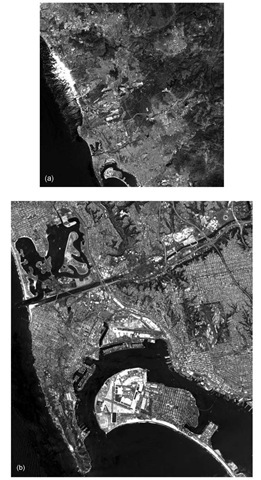
For over a decade, the highest-resolution commercial imagery available came from the French SPOT satellite. Featuring a panchromatic sensor with 10-m resolution, SPOT has been the companion to Landsat since 1986.18 Here an image of San Diego County provides a full frame of data, and an image chip details the harbor area and downtown. Looking at Fig. 1.15(b), note that the Coronado Bridge is sharper than in previous images. Details of the airport are apparent, and elements of information relevant to AOB start to emerge. The piers have emerged as distinct objects, and one detects ships’ movement in the water—or at least their wakes.
Notice that the implicit conflict between coverage and spatial resolution has by now emerged explicitly. The two high-resolution cameras on SPOT each provide imagery of 60-km-swath width. Combined, this is still down from the 185 km provided by Landsat. This comparison of resolution and coverage has to be made with similar satellite generations—in particular with telemetry systems of comparable capacity.
Figure 1.15 (a) SPOT-3 image of San Diego County. (b) San Diego Harbor, SPOT image.
IRS (5 m)
The Indian remote-sensing satellite, IRS-1C, launched in December 1995, provided the highest-resolution images available commercially for a 4-year interval before IKONOS was launched in 1999. The IRS system is included next to illustrate the capability of the 5-6-m resolution the Indian system offers. Equally important, the IRS illustrates the global nature of remote sensing, and how capabilities fare outside the major western powers. India has labored for a number of years under a burden of technology-transfer limitations, and it is noteworthy that one result has been the evolution of an indigenous manufacturing capability.20 Israel has exhibited similar prowess, and Surrey Satellite Technology provides many smaller countries with assets they can control.
Figure 1.16 shows San Diego Harbor again. The inset is the entire "scene." Note the substantially reduced coverage compared to the Landsat scene in Fig. 1.12. Once again, images from a common technology era are confined to similar numbers of bits or pixels—in other words, coverage is traded for resolution. In fact, the problem emerges simply in showing this image: the Coronado Bridge has been left out for lack of room.
Following the paradigm at the beginning of the topic, consider this scene in relation to AOB and NOB. What can you see (and not see) at 5-10-m resolution? Ships are now clearly visible in the water; can you see ships at the piers? There is at least one carrier docked on the north side of Coronado Island, homeport for the Kitty Hawk and Constellation. Can you identify any ships? What can you tell about San Diego’s airport? Given the length of the runways at Lindbergh field, can you estimate the length of the runways at Coronado Naval Air Station?
