12-Lead ECG Interpretation
Like the approach to a 12-lead ECG analysis, the approach to the 12-lead ECG interpretation must likewise be disciplined. First, the Paramedic should assemble the list of abnormalities (i.e., presence and location of Q waves, R wave progression, ST changes, and T wave abnormalities). Reflecting on these changes, the Paramedic should assess for lead groupings. Lead groupings are ECG changes in contiguous leads that are suggestive of involvement of a specific ventricular wall.
Armed with this information, the Paramedic can attempt to identify the culprit artery that is involved. Understanding coronary artery involvement can help the Paramedic predict the progression of the acute coronary event and prepare for these predictable events. For example, the right coronary artery (RCA) supplies the AV node in the vast majority of patients.44 ECG changes suggestive of an inferior wall myocardial infarction (IWMI) implicate the right coronary artery (RCA) and vis-a-vis the AV node ischemia. This AV node ischemia can manifest as type I heart block. The first indication of a type I heart block is a prolonged PR interval (PRI). Therefore, a Paramedic confronted with a possible IWMI would monitor the PRI in an IWMI for a possible heart block.
Finally, the Paramedic should consider the 12-lead ECG as a whole. ECG changes in adjoining walls may be suggestive of the extent and the evolution of the AMI. For example, ST changes and T wave abnormalities across all of the pre-cordial leads, from V1 to V6, are suggestive of an extensive AMI. Such a pattern of ischemia could be suggestive of a left main coronary artery occlusion.45 The implications of left main coronary artery occlusion include acute pulmonary edema (backward failure), cardiogenic shock (forward failure), and sudden cardiac death (cardiac arrest).
A combination of Q waves, ST changes, and T wave abnormalities across one or more ventricular walls may be suggestive of an AMI later in its evolution. While every STEMI has the potential for reversal, the prognosis in a late evolution AMI is poorer and the morbidity higher.
Paramedic Prognosis
If the AV node is suffering from a lack of oxygenated blood, it will malfunction. As noted in previous topics, the AV node is responsible for delaying the impulse and allowing the atria to contract and push blood into the ventricles. The node is also the electrical connection between the atria and the ventricles. The artery that serves the AV node is the right coronary artery. If ischemic or injury patterns in the ECG leads which look at the area served by the RCA occur, the Paramedic can anticipate conduction abnormalities in the monitoring strip. The conduction abnormalities may lead to a decrease in coronary output sufficient to decrease preload and drop the blood pressure. Concurrently, blood may back up into the venous system, leading to distention in the neck veins. Also associated with RCA occlusions are bradycardias.
With LAD occlusions, the conduction is affected at the bundle of His, making for more serious conduction abnormalities and unreliable escape mechanisms. The anterior wall is the largest portion of the left ventricle and is responsible for ejecting blood into the high pressure system. Damage to the anterior wall may lead to the inability to eject the blood delivered to it and the backup of blood to the lungs. Anterior wall damage caused by occlusion of the LAD may lead to pump failure. Treatment options for anterior wall damage include anticipation of cardiogenic shock, gross irritability of the muscle cells leading to ventricular fibrillation, and reduction of heart rate and workload, leading to a reduction in myo-cardial oxygen demand.
Further 12-Lead ECG Interpretation
As the heart’s muscle depolarizes, the energy moves down the electrical pathway from the sinoatrial node (SA node) to the atrioventricular node (AV node) as a wave front. The electrical wave front then moves across the septum in a left-to-right fashion, then to the bundle branches, and finally the wave front radiates outward across the ventricular mass. Each of these electrical events can be recorded, over time, on an ECG. The graphic representation of these events is the traditional PQRS complexes seen on an ECG.
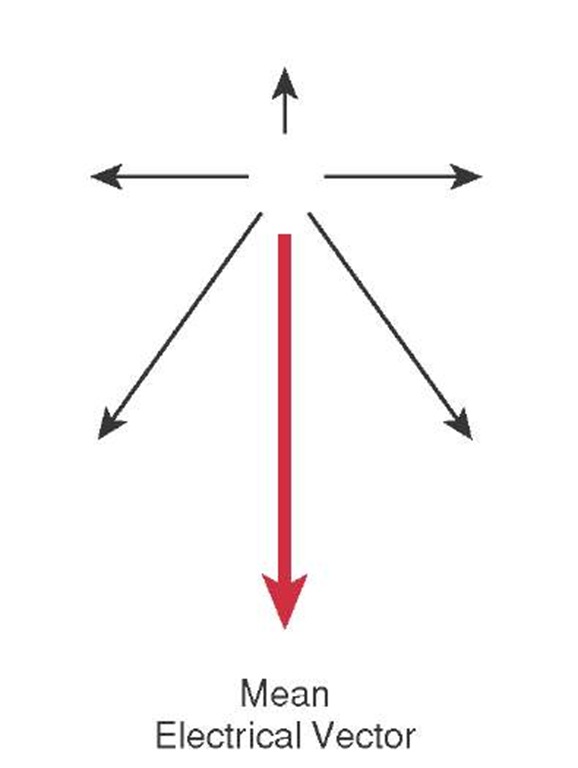
There is another way to look at the electrical event. Instead of looking at depolarization in fragments of P, Q, R, and S, the Paramedic could look at the sum of these events. The sum of these electrical events would be the common direction of the electrical wave front called the mean electrical vector (Figure 34-23).
To explain vectorography in another way, these electrical events could be likened to a battle front during a war. While an army may send out many patrols, some going in different directions, the main objective of the army is to move the front forward. This common direction would be the army’s vector. Similarly, while there may be minor deflections on the ECG, the major direction of the energy during depolarization is toward the apex of the heart. This common direction, or vector, of the energy of depolarization is called the heart’s electrical axis. Any aberration from a normal electrical axis could be indicative of disease (which is explained in more detail shortly).
Figure 34-23 Electrical vector.
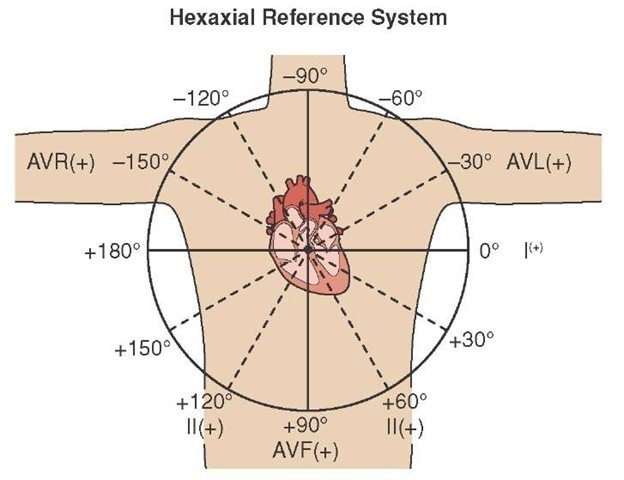
Figure 34-24 Hexaxial reference system.
To help conceptualize the heart’s normal axis, and to help determine if there is any axis deviation, an artificial construct called the hexaxial reference system was created. To create the hexaxial system, the limb leads were drawn around the heart and Lead I, the lead that is horizontal and on the right side, was assigned zero degrees and the left side 180 degrees. As the limb leads are part of Einthoven’s Triangle (an equilateral triangle), then Lead II would be at 60 degrees and negative 120 degrees and Lead III would be at 120 degrees and negative. The three axes are then all drawn into the middle of the heart and the three augmented leads overlaid with aVF at 90 degrees, aVL at negative 30 degrees, and aVR at 30 degrees and negative 150 degrees. The resulting construct shows the heart divided into equal 30-degree segments (Figure 34-24).
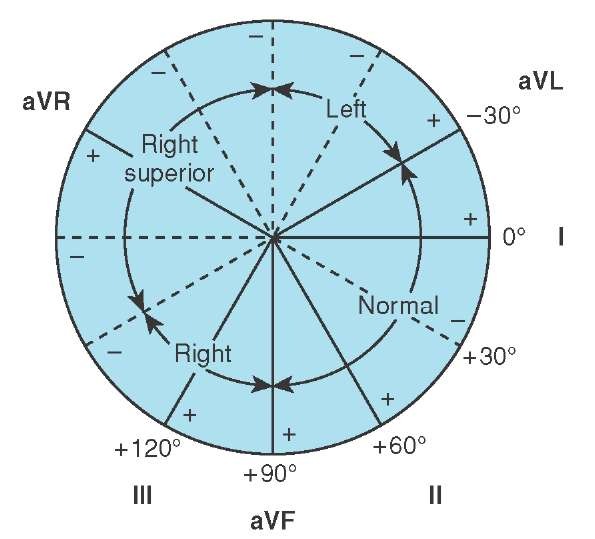
The traditional method of calculating the mean electrical axis was to find the most equiphasic lead of the frontal leads (I, II, III, aVR, aVL, and aVF). An equiphasic lead is an QRS complex with an R wave that is equal in height to the depth of the S wave. An equiphasic wave would be neither going toward the vector nor away from it, but would be perpendicular to it. Using that lead, the Paramedic would plot it on the hexaxial reference system (Figure 34-25). The lead represented on the perpendicular spoke would be the heart’s mean electrical axis in degrees. For example, if the equipha-sic QRS was Lead I, then the perpendicular axis would be 90 degrees.
Figure 34-25 Axis determination using the hexaxial reference system.
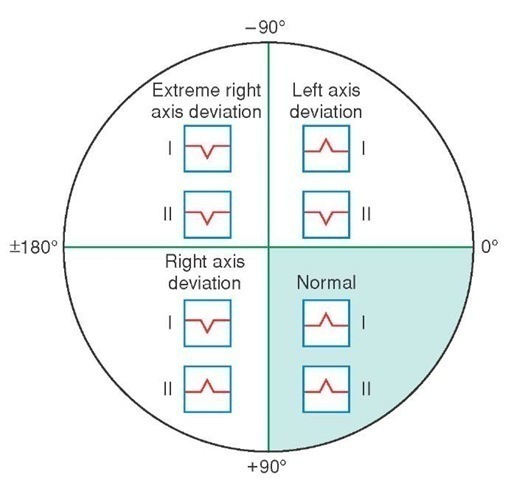
This method of axis determination, while very accurate, is cumbersome in the field. An acceptable alternative is the Grant method. With the Grant method, the Paramedic would refer to Lead I and Lead II only (Figure 34-26). If both leads are upright, then there is a normal axis deviation. If Lead I is upright but Lead II is primarily downward in deflection, then a left axis deviation is assumed. Alternatively, if Lead I is primarily downward but the QRS in Lead II is upright, then it can be assumed it is a right axis deviation. If the QRS for both Lead I and Lead II is negatively deflected, then the axis is called an extreme left axis deviation; nicknamed "no man’s land" because it represents extreme abnormal depolarization.
Figure 34-26 Determination of axis using Lead I and Lead II.
STREET SMART
Many 12-lead ECGs provide a reading of the axis, listed as P-R-T axes. The Paramedic need only read the R axis and compare it to the hexaxial reference to determine the axis.
To reduce confusion, some Paramedics use their thumbs to represent the QRS deflection-Lead I on the right hand and Lead II on the left hand. If Lead I is upright (i.e., the right thumb is up and the left thumb is down), then there is a left axis deviation. If both Lead I and Lead II are negative, then both thumbs are down.
Axis Deviation
Axis deviation is any time the heart’s axis is not normal. Determining axis deviation is another means of observing many pathological conditions. Coupled with other physical findings, axis determination can help the Paramedic establish a diagnosis. For example, a right axis deviation which is abnormal can often suggest pulmonary pathologies such as pulmonary embolism and chronic obstructive pulmonary disease.46
A slight left axis deviation, from 0 to (-) 30 degrees, may be physiologic and seen in obese patients or women who are in their third trimester of pregnancy. A larger left axis deviation, from (-) 30 to (-) 90 degrees, is often associated with left ventricular hypertrophy, secondary to heart failure, inferior wall MI, or (in some cases) Wolff Parkinson White syndrome.47
Of greater concern to the Paramedic is an extreme left axis deviation (>180 degrees) into "no man’s land." While conditions such as congenital transposition of the great vessels and dextrocardia can produce this, extreme left axis deviation in the normal heart is suggestive of ventricular tachycardia. During ventricular tachycardia, the electrical source is in the ventricle and the wave front runs backward through the conduction system.
Differentiating VT from SVT with Aberrant Conduction
Paramedics (and other practitioners) often have difficulty determining whether a fast rhythm with a wide QRS complex is ventricular tachycardia or supraventricular tachycardia with aberrant conduction. Some patients can tolerate a sustained monomorphic ventricular tachycardia for a prolonged period of time, despite opinion that patients cannot tolerate ventricular tachycardia (VT). Because the patient is tolerating what appears to be a wide complex tachycardia of unknown etiology, the assumption is it must be supraventricular tachycardia (SVT) with aberrant conduction. Some patients do develop a rate-related bundle branch block.
The determination is important as treatments for SVT, such as calcium channel blockers, can lead to rapid patient deterioration if the rhythm is actually VT. Instead of trialing a medication to "see if it works," at the risk of patient discomfort and wasted time, a 12-lead ECG can provide the necessary information.
Ventricular tachycardia occurs most often in patients with acute cardiac ischemia or those with a cardiac history. The Paramedic should first obtain a quick patient history, paying attention to antiarrythmic medications that indicate a previous history of cardiac dysrhythmia or medications that may predispose the patient to arrhythmias (proarrhythmic medications).
Alternatively, supraventricular tachycardias often occur in otherwise healthy individuals. Some of these patients may have a history of SVT or a diagnosis of WPW or LGL syndromes.
Next, the Paramedic should obtain a 12-lead ECG, paying particular attention to axis deviation and R wave progression. The first step is to determine if the rhythm is regular. Ventricular tachycardia is usually very regular. SVT with aberrancy is also usually regular unless the underlying cause is an atrial fibrillation with a rapid ventricular response. If the rhythm is atrial fibrillation, then the ventricular response will be irregularly irregular. While regularity will not help differentiate an interpretation of either VT or SVT, an irregularly irregular rhythm is suggestive of atrial fibrillation.48
Next, the Paramedic should examine the QRS morphology in V1. In ventricular tachycardia, the V1 lead will be an R wave, where typically there is no R wave. Looking across the chest leads, the Paramedic may also observe an S wave where typically there is no S wave.
In fact, if all of the QRS complexes in the chest Leads V1 through V6 are in the same direction (a phenomena called concordance), the ECG interpretation favors VT. The direction of the QRS (the polarity) can be either positive or negative but should be in the same direction.
Next, the Paramedic should look at Lead I and Lead II. If both leads are negative, or the R vector on the 12-lead ECG reads between (-) 90 degrees and (-) 180 degrees (i.e., extreme left axis deviation), then the interpretation of VT is supported.
Table 34-8 Comparison of VT vs. SVT with Aberrancy
|
Ventricular Tachycardia |
Supraventricular Tachycardia |
|
|
• |
History of ischemia |
• Healthy individual |
|
• |
Proarrythmic medications |
• History of SVT |
|
• |
Regular or irregular rhythm |
• Regular or irregular rhythm |
|
• |
Dissociated P wave activity |
• P waves before each QRS |
|
• |
Concordance in the chest leads |
• R wave progression |
|
• |
In V1 ( MCL1), R wave, Rr’, QR, RS |
• In V1 (MCL1), rSR’ |
|
• |
In V6 (MCL6), rS, QS, QR |
• In V6 (MCL6), qRs |
|
• |
QRS duration of 0.16 sec or more |
• QRS duration > 0.12 but < 0.16 sec |
|
• |
Initial notching or slurring of QRS |
• Absent or ending slurring of QRS |
|
• |
Axis of -90 to -180 degrees |
• Axis of -90 to +180 |
Finally, the Paramedic should observe the 12-lead ECG for the presence of P waves. Atrial depolarization still occurs in VT, independent of the ectopic ventricular pacemaker. Because of the independent atrial and ventricular activity (i.e., atrial-ventricular dissociation), P waves will randomly appear throughout the 12-lead ECG. P waves that appear regularly in front of a QRS suggest a supraventricular ectopic pacemaker (Table 34-8).


