Normal Depolarization and Repolarization
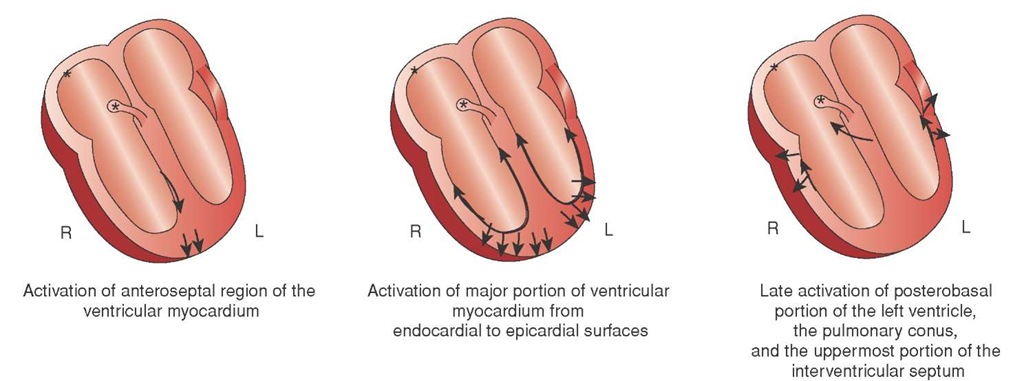
Normal ventricular depolarization begins with the onset of the QRS complex. The first negative deflection, called a Q wave, represents the depolarization of the septum.
Figure 34-8 Septal depolarization.
A Q wave is not always visible in every patient, nor is it seen in every lead (Figure 34-8). The presence of a small Q wave, called a physiologic Q wave, is normal.24
Following the depolarization of the septum, ventricular depolarization occurs. Normally, ventricular depolarization proceeds from the endocardium outward to the epicardium (Figure 34-9). The specific wave pattern (i.e., rS, Rs, etc.) is a function of the electrode’s placement. For example, since the energy is going away from V1, the QRS deflection should be negative. The energy is going toward V6 and the QRS deflection in V6 should be primarily positive.
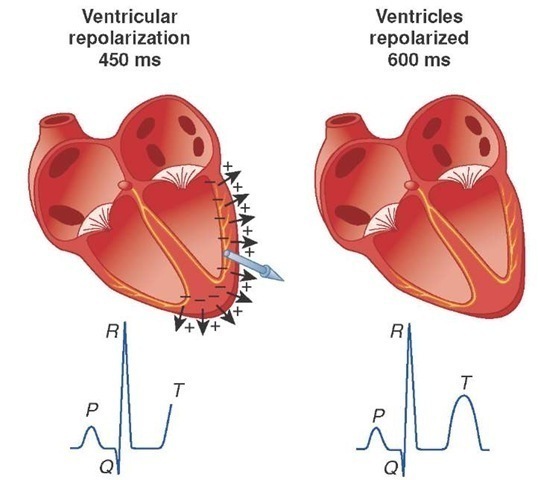
Normally the segment between the QRS and the T wave, called the ST segment, is isoelectric as the Purkinje fibers start to repolarize (Figure 34-10).
Ventricular repolarization is represented by the T wave. In a reverse process, normal repolarization begins at the epi-cardial surface and progresses through the ventricular walls to the endocardium. The process of repolarization involves resuming a negative interior of the cell compared to the outside. The combination of the interior of the cell becoming more negative while moving away from the positive electrode results in a positive deflection on the screen. The T wave representing ventricular repolarization is positive or upright in all leads except aVR.
Figure 34-9 Ventricular depolarization.
Figure 34-10 Ventricular repolarization.
Ischemic Patterns
A healthy myocardial cell requires oxygen, glucose, and a balance of electrolytes in order to function (i.e., to depolarize, then repolarize). Abnormal depolarization/repolarization occurs whenever the myocardial cells lack these essential conditions. The most common cause of myocardial dysfunction is acute occlusion of the coronary arteries.
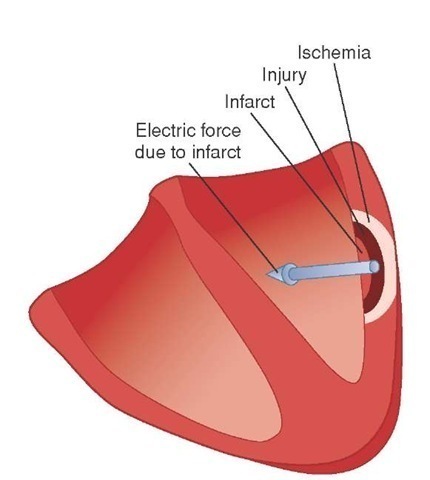
As a result of this occlusion, and subsequent hypoxia, the myocardial cells go through a predictable pathway to cell necrosis and myocardial infarction called penumbra (Figure 34-11). The cellular changes that occur during penumbra can be witnessed by the Paramedic as changes in the ECG. These ischemic patterns are the result of abnormal repolarization.
Figure 34-11 The ischemic penumbra.
There are three successive stages before myocardial cell death: ischemia, injury, and infarction. These stages are evolutionary and affect tissues incrementally, spreading out from a central point in a bull’s eye fashion. They can be described as the three "I’s" of acute coronary syndrome (ACS).
Ischemia
The first change is myocardial ischemia. During the ischemic phase, myocardial cells are deprived of oxygen and hypoxia ensues. During this phase, the myocardial cells convert to anaerobic metabolism to conserve energy. This decreased cellular activity slows myocardial repolariza-tion. As coronary perfusion occurs from the surface (or epi-cardium) inwardly, the deeper myocardial tissues become ischemic first. This limited ischemic involvement is called subendocardial ischemia. This slowing of repolarization does not alter the direction of repolarization; therefore, the ECG will appear normal, but it does lengthen the time for repolarization. Accordingly, the first manifestation of myocardial ischemia can be a lengthening QT interval.
Figure 34-12 Hyperacute T waves.
As the cell’s sodium-potassium pump starts to falter, due to insufficient ATP, potassium leaks from the cell. The leaking potassium causes an increase in the amplitude of the T waves, called a hyperacute T wave, in the leads facing the damage (Figure 34-12).
Transmural ischemia occurs as the ischemia reaches the point where it affects the entire thickness of the myocardium, from the endocardium to the epicardium. Then, the deeper myocardial cells begin to malfunction.
Normally, when repolarization occurs, the polarity changes as potassium is pumped back into the cell. This reverses the current. Repolarization results in an upright T wave on the ECG.
However, when the ischemic endocardial cells deeper in the myocardium fail to repolarize, the result is a loss of the change in direction of polarity which normally occurs during repolarization. This failure to change in direction causes a negative deflection in the T wave. Without repolarization and the subsequent negative polarity of the myocardium, the normally upright T waves become inverted in the ECG leads that overlay the ischemic area. In some cases, inverted T waves will be one of the first electrocardiographic changes that the Paramedic will observe.
Injury
The persistent hypoxia causes the myocardial cells to change from ischemia to injury. The faltering sodium-potassium pump of the injured myocardial cells can no longer maintain polarization and the cell becomes electrically inert. At first the injured endocardial cells tend to draw the ST segment downward (ST-segment depression). An ST segment, by definition, is a >1 mm depression below the J point from isoelectric baseline. To decide if the ST segment is depressed, the Paramedic must first ascertain the J point.
J Point
To decide if an ST segment is depressed or elevated, the Paramedic starts by identifying the J point. The J point is the start of the ST segment and is found at the juncture of the QRS and the ST segment, the point where the angle from the QRS changes. To find the J point, the Paramedic starts at the beginning of the P wave and draws a straight line across to where it crosses the T wave. If any portion of the ST segment is below that line, then there is ST-segment depression. If any portion of the ST segment is above this line, there is an ST-segment elevation. If the Paramedic is unable to find the beginning of the P wave, then the line is drawn from the bottom of the calibration wave straight across.
ST-Segment Elevation
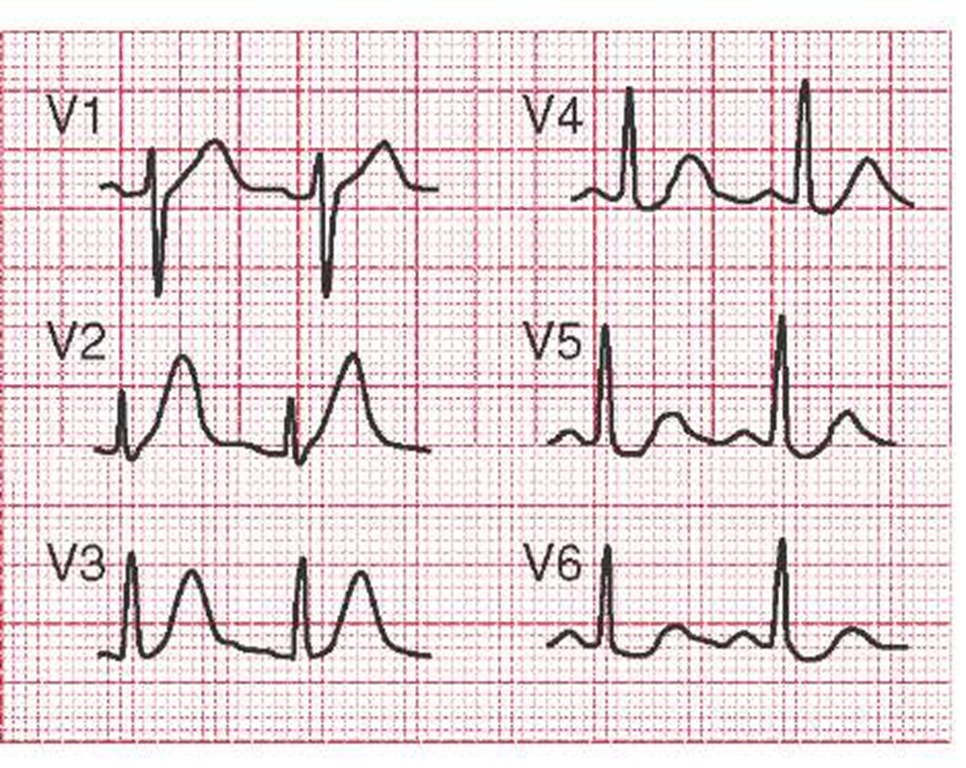
As the injury continues and becomes full thickness (transmu-ral), the ST segment starts to rise (ST-segment elevation). Myocardial injury, as manifested by ST-segment elevation in the ECG leads overlying the area, generally occurs after 20 to 40 minutes of ischemia.25 Some examples of ST-segment elevations in the anterior leads include some "tombstone" elevations in V2, V3, and V4 (Figure 34-13).
Patterns of Ischemia and Penumbra
At this point, the Paramedic may see a complex picture of T wave inversions, ST-segment depressions, as well as ST elevations. These markings represent the process of ischemia and are manifestations of penumbra. The key is to focus on those leads that indicate the greatest degree of damage. The other ECG changes should radiate away from the location of the primary event.
Infarction
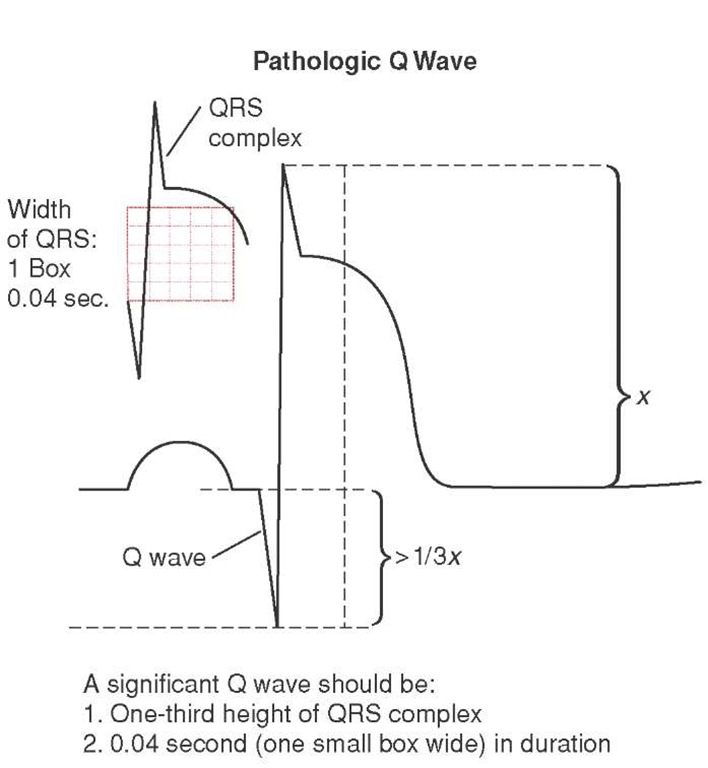
Without oxygen, the myocardial cells eventually die (myocardial infarction), and the area begins necrosis, a physiologic process in which dead cells are removed and new cell growth may occur. The ECG hallmark of this change is the development of pathologic Q waves. Pathologic Q waves indicate electrical silence (i.e., no depolarization) in that portion of the ventricular wall. Because that portion of the ventricular wall is electrically silent, the depolarization in the opposite wall, going away from the electrodes in that lead, is the only signal present. It is recorded as a negative deflection on the ECG.
STREET SMART
It is estimated that in some 50% of initial ECGs taken on patient’s with cardiac related chest pain, the Paramedic may not see ST-segment elevations with the initial 12-lead ECG because the event has not evolved to that level. Nevertheless, it is important to obtain a baseline ECG for later analysis, particularly for QT intervals and T wave changes.
Figure 34-13 ST-segment elevation due to acute MI tracings. A and B show oblique straightening; C and D show a concave upward appearance; E and F show a more horizontal or flattened ST appearance.
Q waves can also represent the depolarization of the intraventricular septum. As the septum depolarizes from left to right, any leads that are looking from the left (i.e., the lateral leads I, V5, and V6) will show a negative deflection. These physiologic or septal Q waves are normal (Figure 34-14).
While some Q waves are normal (physiologic), the Q waves associated with infarction (pathologic Q waves) are deep (greater than 25% of the R wave) and wide (typically 0.04 seconds). These characteristics, and the presence of Q waves in contiguous leads, suggests pathology and infarction.26
The presence of a Q wave in a 12-lead ECG is confirmation that the patient has had a transmural myocardial infarction. Q waves can remain for years, alerting the Paramedic to the presence of an acute myocardial infarction (AMI) in the past. In up to 30% of 12-lead ECGs with Q waves, the Q waves resolve, especially in the inferior wall, within one year.27
Figure 34-14 Q waves.
STREET SMART
An isolated pathologic Q wave in Lead III may be a normal finding and is not indicative of an inferior wall AMI unless it is accompanied by other ECG changes in the contiguous leads II and aVF.

