ABSTRACT
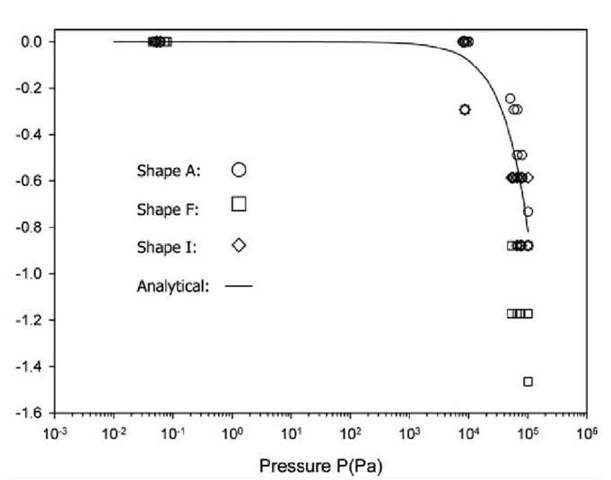
Damping effects on different geometries were investigated by testing them in air at different pressure levels, ranging from the atmospheric pressure of 105 Pa to 10-2 Pa. The resulting responses of these geometries followed the same trend as the analytical plot for the rectangular shape structure. As the relative resonant frequency of the structure is proportional to the intrinsic resonant frequency, measured at the lowest pressure levels achieved by the AFM system, different shapes showed different amount of responses as a function of pressure. As the intrinsic resonant frequency of the triangular shape was the highest, its relative resonant frequency was the highest; the modified geometry showed intermediate responses among the three geometries.
INTRODUCTION
In recent years, Microcantilever based sensors have been applied to detect different physical quantities, such as acceleration of automobiles to deploy airbags, and different chemical [1-8] and biological species [8-17] present in different environments. Sensors consist of two elements: sensing and transduction elements. The sensing element measures the measurand, which can be a physical quantity, property or a certain condition, from the input signal that can be magnetic, chemical, electromagnetic, mechanical, thermal etc. Microcantilever based sensors use two types of detection schemes, one of them involves deflection of the cantilever beam structure due to the mass loading on the beam in static condition, while the other one involves the change in the resonant frequency of the cantilever beam structure due to the mass loading on the beam under dynamic conditions.
Biosensors usually use acoustic wave based sensing devices for detection. They use elastic waves at frequencies well above the human audible range propagating through the sensing structures. Microcantilever based sensor devices fall into this category. Datskos et al. [18], Oden [19] and Stern et al. [20] have compiled and compared performances of acoustic wave based sensors based upon mass sensitivity, which can be expressed by the equation 1,
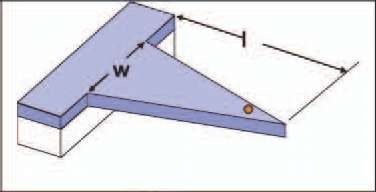
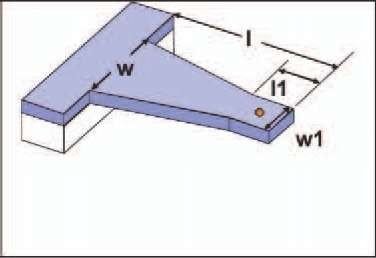
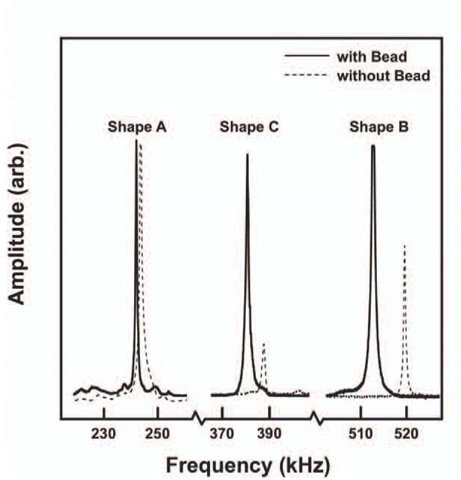
where, f is the resonant frequency, Af the resonant frequency shift and Amsmin the minimum detectable surface mass density. In prior work [21], we reported on a simplistic approach for significantly enhancing the mass sensitivity of microcantilever acoustic sensors by modifying the cantilever geometry. The approach involved modifying the geometry to minimize the effective mass at the free end of the microcantilever. Polystyrene beads were attached at specific locations and the resonant behavior and mass sensitivity was compared between geometries. Resonance behavior was assessed via the laser reflection method. Mass sensitivity was found to increase by nearly an order of magnitude for the new geometrical shapes over the rectangular geometry, which is the standard shape for microcantilever acoustic sensors. Triangular geometries yielded the best performance increase over the standard rectangular geometry; however a compromise was made to ensure there was sufficient area at the microcantilever free end to capture target species in frequency shift by mass addition applications, see Table 1. Resonant frequency shifts that result from the attachment of a single bioparticle are shown in Figure 1. Our results indicated that modifying the geometry of a microcantilever to reduce the amount of effective mass at the end of the microcantilever was successful in significantly enhancing its performance. Mass sensitivity was increased by 8.77 times that of a standard rectangular microcantilever when in a triangular shape of the same length and geometry and 4.55 times for the adapted geometry.
Another aspect to consider is how damping influences these geometries, as these types of sensors for biological agents are almost exclusively operated in liquid environments. An initial thought experiment would seems to conclude the modified geometries would be less influenced by damping as their cross-sectional interface with the surrounding medium is less than the standard rectangular cantilever. One can then conceptually generate a schematic of how the relative resonant frequency shift would behave with viscosity of the medium, see Figure 2.
Table 1: Comparison of numerical performances of different aeometrical shaDes
Figure 1: Frequency spectrum for the different shapes indicating the resonant frequency both with and without the attached polystyrene bead.
Figure 2: Schematic figure showing expected viscosity dependence on different geometrical shapes.
This range of viscosity can be divided into three separate regions [22-27]. At low pressure levels the vibrating cantilever beam structure loses energy due to internal damping, known as the intrinsic regime. At this pressure level air molecules can be considered non-interacting with the vibrating structure. Thus, the damping effect due to the medium can be neglected. At higher pressure levels, near the atmospheric pressure, the damping effect is dominated by the external effect imposed by the molecules present in the medium. This region of external damping is referred to as the viscous regime. In between these two regimes, there is a transition regime where both the internal and the external damping effects play roles. This work is aimed at experimentally determining how damping influences the mass sensitivity of the different geometrical shapes.
EXPERIMENTAL PROCEDURE
The devices fabrication was identical to that described in out prior work [21]. The microcantilevers were fabricated using standard surface and bulk micromachining techniques. Silicon-on-insulator (SOI) wafers were used that possessed a 1 pm SiO2 layer 4.3 pm below the wafer surface. The process is summarized in 5 steps, see Fig. 2: (1) Spin coat photoresist on the top side, pattern and develop; (2) deep reactive ion etching (DRIE) of the exposed silicon on the top-side; (3) spincoat photoresist on the top and bottom side and pattern and develop the bottom side; (4) DRIE etching of silicon from the bottom side using the ‘Bosch’ process27-29 until the silicon oxide layer is met; and (5) etching of the SiO2 layer with an H2O:HF solution (10:1) to release freestanding microcantilever structures. Complete fabrication procedures are described elsewhere. [21]
The resonance behavior of the microcantilevers was measured at ambient air pressure via the laser reflection method. A JEOL 5200 Scanning Probe Microscope operating in non-contact AC mode was employed to excite the microcantilevers and measure their resonant properties. Temperature was maintained at a 24.7°C to ensure that it did not influence the measurement and the microcantilevers were placed in the test rig 1 hour before testing to allow them to equilibrate. Microcantilevers were initially characterized to determine their resonance frequency and then remeasured after application of the polystyrene beads. Polystyrene beads 10 pm in diameter, obtained from Polysciences Inc., were attached on the free end of the microcantilever beam where it is most sensitive to mass attachments [21]. The beads were manipulated with a probe station tip to a location on the central axis of the microcantilever approximately 20 pm from its free end. In order to rigidly affix the beads to the microcantilevers, they were annealed above the bead’s glass transition temperature, 95°C, at a temperature of 120°C for a period of 15 minutes. The result was bead attachment suitable for the resonance measurements. The nominal diameter of each bead was 9.8 ± 0.2 pm with a mass of 513.5 ± 0.2 pg.
To investigate the damping effect on these geometries and their performances the A, F and I shaped cantilevers were tested and compared. The resonant frequency of these geometries was measured in air at different pressure levels, starting from atmospheric pressure to the lowest vacuum pressure attainable (of 105 to 10-2 Pa) by a JEOL SPM 5200 Scanning Probe Microscope system. The laser diode and photodetector of the system were employed to measure resonance frequency.
RESULTS AND DISCUSSIONS
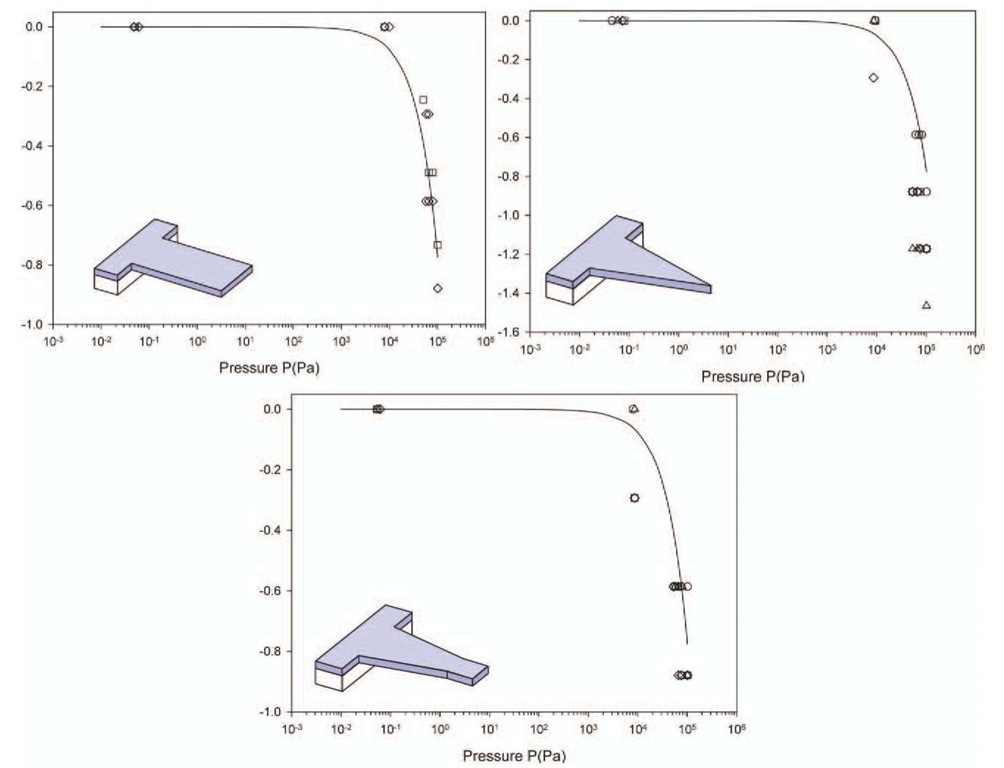
The relative resonant frequencies were calculated from the experimental data for each of the samples of all three geometries and plotted in Figures 3. To make a comparison, an analytical model for a rectangular cantilever was attached to each of the plots for different shapes (solid line). Sandberg et al. [38] had developed this analytical expression for pressure dependence of the resonant frequency of a regular rectangular shaped cantilever beam structure:
Here, f0 = intrinsic resonant frequency, M = molar mass of the medium (in this case 28.97 gm/mol for air), p: = pressure, R = gas constant (8.314 J/mol.K), T = temperature (room temperature, approximated as 300 K), p = density of the beam material (for Si it is 2.329 gm/cm ), and h = bean thickness. From equation (2), the relative resonant frequency can be calculated using the following expression:
where, the intrinsic resonant frequency was assumed to be the same as the maximum resonant frequency that was measured at the lowest pressure attained by the system during testing for each samples. To calculate the analytical results for a rectangular shape cantilever, the average value of the thickness of the samples and the average value of the intrinsic resonant frequencies of the samples were used.
The separate plots in Figure 3 were combined into a single figure to better enable comparison, see Figure 4. From these plots it can be seen that there are no significant differences among the three geometries, in terms of relative resonant frequencies. Proving the expectation to be wrong which was summarized in the schematic plots attached in Figure 2. This may be due to the fact that the relative resonant frequency is highly dependent on the intrinsic resonant frequency, as can be seen from the Equation (3). Although the damping effects on the triangular shape might be the smallest, its intrinsic resonant frequency was the highest. Thus, the change in the resonant frequency became comparable to that of the other shapes. On the other hand, the rectangular shape had the largest surface area for damping effect to take place, while it had the lowest intrinsic resonant frequency. Thus, the change in the resonant frequency due to damping became comparable to the other shapes.
Figure 3: Relative resonant frequency as the function of pressure for the 3 shapes.
It is interesting to note that the triangular shape was significantly more influenced by damping than the standard rectangular shape. Our initial assumption was that its reduced cross-sectional interface with the medium would reduce damping effects. However, it appears to be the opposite effect. The reason involved their significantly different resonant frequencies, 194 KHz for the rectangular and 390 KHz for the triangular. The triangular has twice the vibration rate as the rectangular shape, meaning it possesses twice as much contact time with the medium. Even though the triangular shape possesses less cross-sectional contact, its higher resonant frequency producs more contact with the medium and is there for damped to a larger degree. Unfortunately this erodes, in part, the benefits gained in mass sensitivity by changing the geometry.
Figure 4: Relative resonant frequency as the function of pressure comparing all three shapes.
CONCLUSIONS
Our prior work revealed that changing the standard rectangular shape of microcantilever sensors to more triangular-like shapes can significantly improve the mass sensitivity, by nearly an order of magnitude. However, this work revealed that this change can significantly increase damping effects that erode some of the performance enhancement that triangular-based geometries offer.


