ABSTRACT
Two different resistance measurement techniques are used in an epoxy material reinforced separately with carbon black (CB) micro-particles and carbon nano-tubes (CNTs) to evaluate the effectiveness of both the techniques and type of reinforcement on damage detection under uni-axial tensile loading. Two techniques, namely traditional four-point probe (FPP) and four-circumferential ring probe (FCRP) are employed and a constant current is applied through outer probes. The resulting voltage drop between inner probes is measured using a commercial high resolution electrometer based system. Since current density distribution in both techniques is different, the measured change in resistance (both qualitatively and quantitatively) is also different. In addition to change in current density due to different techniques, the size of conductive reinforcement also has significant impact on both current distribution and further change in resistance. CB reinforced epoxy showed very high percentage change in resistance against CNTs reinforced epoxy for both techniques. It was identified that CNTs reinforced epoxy showed no significant difference for both FPP and FCRP methods. However, for CB reinforced epoxy, significant difference in percentage change in resistance was observed for both resistance measurement methods.
Introduction
Due to their high electrical conductivity, carbon black and carbon nanotubes were used as a sensory network in detecting damage initiation and growth in concrete [1-3] and in polymer composites [4-6] when they were subjected to mechanical loads. The damage initiation and growth was detected by measuring the change in resistivity of the above materials using traditional four point probe (FPP) measurement methodology [1-5]. In this methodology either constant current or voltage is supplied between two outer probes and respective change in voltage or current was measured through inner probes to record the change in material resistivity associated with the damage. To discuss few studies in this paper, Thostenson and Chou [4] recorded maximum percentage change in resistance of 300% due to damage at a peak load in glass fiber-epoxy composites. Nofar et al., [5] indentified a maximum percentage resistance change of about 40% due to damage in CNT reinforced laminated Bidirectional woven glass fibers epoxy composites during tensile and fatigue loading. However, traditional FPP methodology allows the current to flow though small depth below the surface and the damage detection zone is limited. However, to detect significantly large amount of damage inside the materials due to mechanical loads, we expected that a four circumferential ring probe (FCRP) methodology is a better choice. Although there are no many studies reported using FCRP approach, Park et al., [7] employed FCRP approach in determining change in resistivity due to damage during carbon fiber pull-out test of carbon nanotube reinforced epoxy composites.
In this study, we conducted a comprehensive experimental investigation of both FPP and FCRP techniques in an epoxy material reinforced separately with carbon black (CB) micro-particles and carbon nano-tubes (CNTs) under uni-axial tensile loading. A constant current is applied through outer probes of above techniques and the resulting voltage drop between inner probes is measured using a commercial high resolution electrometer based system. Due to change in current density of above two techniques and also due to the size of conductive reinforcement, we expected to see significant change in resistance measurements (both qualitatively and quantitatively).
Experimental Procedures
Material Fabrication
Given the simplicity of casting and low curing temperature, the matrix used in this study is an epoxy polymer based on bisphenol-A resin (Buehler Epothin (20-8140-128)) and an epoxy hardener (Buehler Epothin 20-8142-064). The mixing ratio of Part-A to Part-B was 50g to 18 g. The multi-wall carbon nanotubes (purity > 95%) used were supplied by NanoLab. The nanotubes had outside diameters of 30 ± 15 nm, lengths of 5 to 20 microns and a specific surface area of 200-400 m2/g. Two different weight fractions of CNTs 0.3 and 0.5% wt were tested to understand percolation threshold. Carbon black (CB) has irregular particle shape and has average size of 1-5|J,m and they have mass density of 1.8-2.0 gm/cm3. In this study a weight fraction of 10% was used in making composites.
Due to high surface energy, carbon nanotubes tend to agglomerate into bunches. These agglomerations can act as defects rather than enhancements which directly affects the transport properties of the material [8]. To effectively disperse CNTs and enhance electrical response of the material under study, the present work implemented high-intensity ultrasonication and high-speed shear mixing.
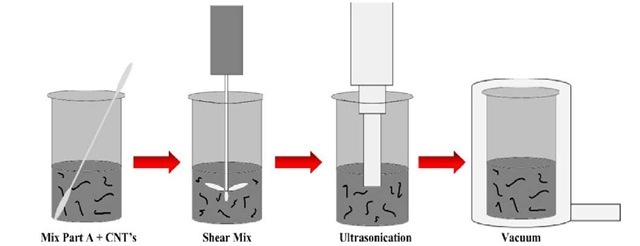
Fig. 1. Schematic of nanocomposite fabrication procedure
A schematic of the general procedure for material preparation is shown in Fig 1. Pre-measured amounts of Epothin Part-A Resin and carbon nanotubes were combined in a copper beaker. The mixture was mechanically stirred for 5 minutes. The mixture was then placed into a shear mixer (Ika Werke RW 16 Basic) outfitted with a 3-blade propeller stirrer (R1381 Propeller stirrer) operating at a speed of 450 RPM for 30 minutes. Following shear mixing, the mixture was then immediately irradiated. The ultrasonication process was applied for one hour on pulse mode, 4.5 sec on 9 sec off (Sonics & Materials Inc. VCX750). During the sonication process, the copper beaker containing the mixture was submerged into a cooling bath in order to maintain a mixture temperature of 18°C – 30°C. It is essential to control the temperature of the mixture during the entire process in order to prevent any avoidable damage that would occur to the nanotubes during the sonication process [9]. Any damage of the nanotubes would diminish the electrical properties of the final composite. Cooling bath was designed to control the temperature of the mixture by adjusting the flow rate of liquid nitrogen through a series of copper coils submerged in an anti-freeze solution. The weight fraction of CNTs in the solution may determine a required cooling rate for the temperature control.
After the sonication process, the mixture was moved into a vacuum chamber to remove trapped air bubbles generated during the mechanical mixing process [10]. Once all air was removed from the mixture, it was combined with and mechanically stirred for 2 minutes. The mixture was once again placed back into the vacuum chamber for 5 minutes. Finally, the CNT-epoxy solution was slowly poured into pre-manufactured molds. The samples were allowed to cure for 24 hrs.
In the case of carbon black, Epothin Part-A (Resin) and carbon black were combined in a copper beaker. The mixture was mechanically stirred for 5 minutes. The mixture was then placed into a shear mixer (operating at a speed of 450 RPM for 45 minutes). Then the mixture was placed in vacuum chamber until complete degassing was performed. Later the mixture was mixed with Part-B and shear mixed for 2 minutes. The final mixture was again placed in vacuum chamber for 5 min and after that the solution is poured in molds.
Electrical Characterization
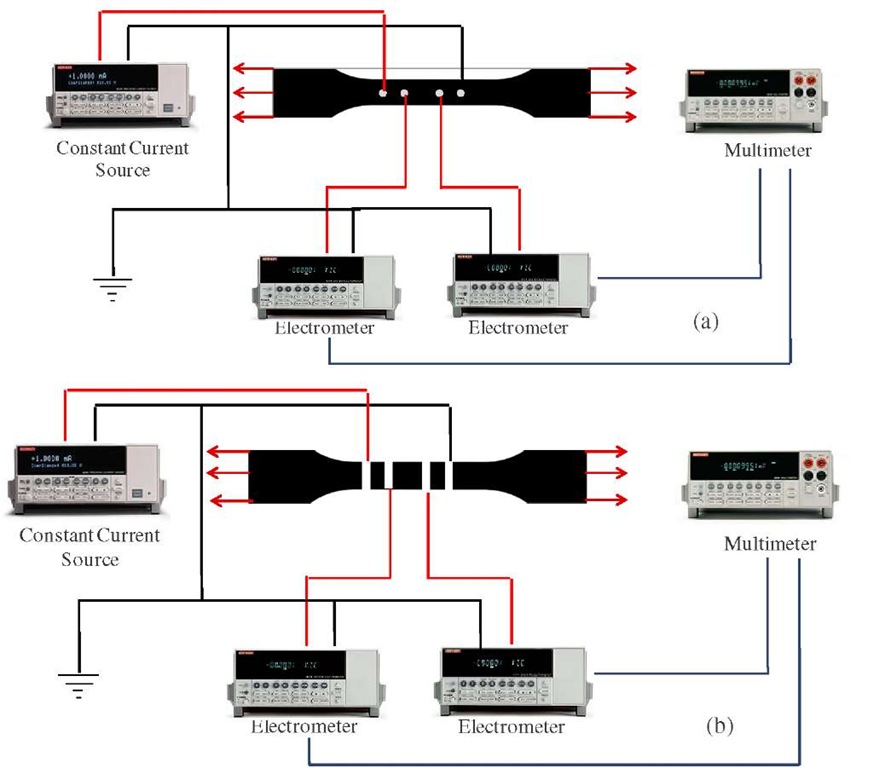
In the present study, dog bone specimen configuration was used for uni-axial testing. Two novel approaches four-point probe method and four-circumferential ring method were implemented to capture the electrical resistance change during mechanical loading. As seen in fig (4a), silver epoxy (MG Chemicals 8331-14G) was used for point method and as shown in fig (4b) silver paint (SPI-Paint 05001-AB) was used for circumferential ring method. A constant current was passed through the outer probes; voltage drop across two inner probes was measured to determine the electrical resistance of the middle section. Since the current flow, i, was constant and the voltage change, V, between the two inner probes was measured, the instantaneous resistance between the two inner probes, R’, was calculated. Percent change in resistance was taken as,
Table 1. Selection of suitable current
|
Current(amps) |
Resistance(H) |
|
100e-6 |
3.64e+5 |
|
75e-6 |
3.84e+5 |
|
50e-6 |
4.16e+5 |
|
25e-6 |
4.82e+5 |
|
200e-9 |
1.21e+6 |
|
175e-9 |
1.21e+6 |
|
150e-9 |
1.21e+6 |
|
125e-9 |
1.18e+6 |
|
100e-9 |
1.22e+6 |
|
75e-9 |
1.19e+6 |
|
50e-9 |
1.32e+6 |
|
25e-9 |
1.13e+6 |
|
2e-9 |
1.9e+6 |
where R0 is the initial resistance between the two inner probes. Due to the complexity and variability of the networks present within each specimen, the initial R value was served as a baseline resistance for each experiment. Suitable current must be chosen for the experiment. Various amount of current ranging from 100|A – 2nA passed and initial resistance is calculated for all currents. Within a range of currents the initial resistance will kept constant as seen in Table 1. A current should be selected from that range for experiment to avoid fluctuations in resistance measurements while applying mechanical loads. The experimental setup used in quasi-static tests is shown in Fig 2. A constant current source (Keithley Instruments Model 6220) was used to generate a constant current flow through outer probes. Two electrometers (Keithley Instruments Model 6514) measured the voltage reading at each of the two individual inner probe rings. The difference between the two voltage readings, which corresponds to the voltage drop across the two inner probes, measured by the electrometers would then be shown on a digital multimeter (Keithley Instruments Model 2000 DMM) and recorded using a LabView system.
Fig. 2. Experimental set-ups for measuring resistance change under quasi-static conditions (a) Four-Point, (b) Four circumferential ring
Quasi-Static Loading
The quasi-static loading was implemented by a servo-hydraulic system (Instron 5582), as shown in fig (5). Specimens were loaded at a constant rate of 1 mm/min. The displacement of the loading head corrected by the machine compliance was utilized to calculate the strain of the specimen under quasi-static loading.
Results and Discussion
Percolation Behavior Study
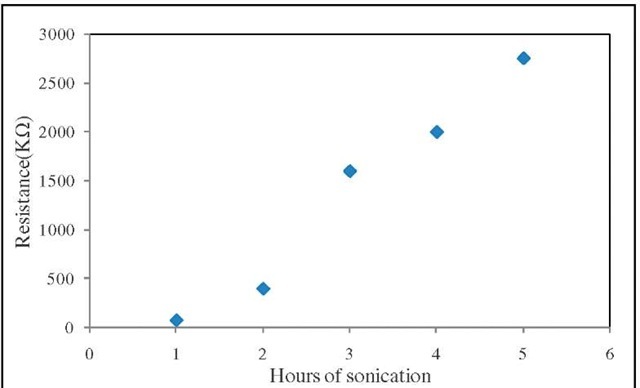
Prior to experimentally studying the electrical response of CNT- epoxy nanocomposites under loading, a detailed investigation was conducted to determine the percolation threshold of the fabricated composites under no loading conditions. This study was essential in order to determine the optimum duration of sonication as well as the concentration of CNTs for the manufacturing of the test specimens to ensure a proper network being formed within the material. Although the results are discussed here in this paper, we identified that 0.5% weight fraction generates optimum percolation threshold. Previous studies have shown similar electrical percolation behavior in nanotube-epoxy composites [11]. Beyond 0.5 wt% the percolation threshold, there is no further significant improvement in electrical conductivity. Therefore, the concentration of CNTs was set to 0.5 wt. % in the present study. Using this 0.5% weight fraction, the effect of the duration of the sonication process on the base resistance of the material was determined. The resulting change in resistance with sonication time is shown in shown in Fig 3.
Fig. 3. Experimental results of static resistance measurements as a function of sonication duration
While the base resistance show apprarent change immediately after one hour of sonication, it begins to drastically increase as sonication duration is further extended. This may be attributed to the nanotubes being damaged due to an excessive sonication. The high local temperatures and pressures during the sonication process may have damaged and weakened the nanotubes, thus creating a less efficient percolation network. From this observation, sonication was set to 1 hour during the specimen fabrication process in present study.
Electro-mechanical response:
For statistical significance and consistency of the experimental data, minimum six experiments were conducted for specific case of material & technique. Having high confidence on our experimental data, we only present in this section, a representative data for each situation.
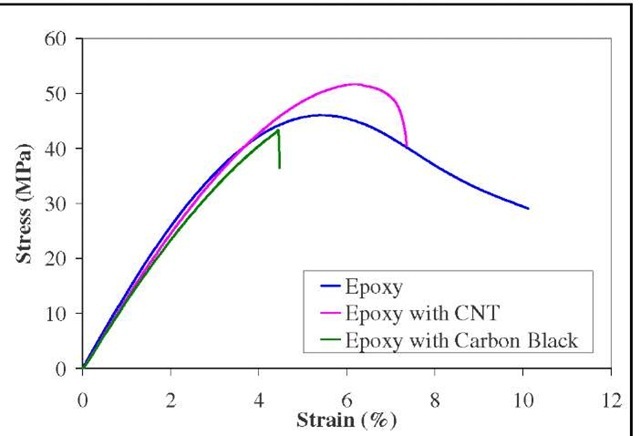
Fig. 4. Engineering stress vs strain diagrams of pure epoxy, epoxy reinforced with CNT and carbon black
Before the electromechanical response of both CNT and carbon black reinforced epoxy is discussed in this section, typical engineering stress vs. strain diagrams of pure epoxy, epoxy reinforced with CNTs and carbon black is shown in Fig. 4. With the reinforcement of CNTs, the composite’s percentage elongation at break decreases to around 7.75% and the same for carbon black reinforced epoxy is at around 4.5%. There is no considerable change in tensile strength of all three materials. These stress-strain diagrams would be useful in explaining the nature of percentage changes in resistance of CNT & carbon black reinforced epoxy composites later in this section.
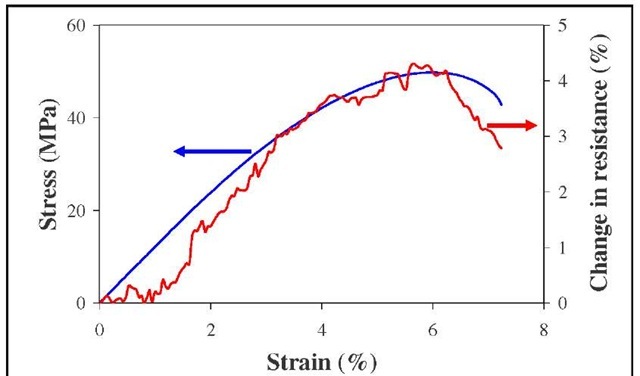
Fig. 5 provides the variation of both applied stress and percentage change of electrical resistance against axial strain of CNT reinforced epoxy using FPP methodology. In the first stage (until 3% strain), as the applied strain increases, the resistance increases monotonically at rapid rate.
Fig. 5. Typical stress-strain and electrical repsonse of CNT reinforced epoxy using FPP methodology
Fig. 6. Typical stress-strain and electrical repsonse of CNT reinforced epoxy using FCRP methodology
In the second stage (beyond 3% strain until it reaches maximum stress value), the resistance of the specimen increases at a decreasing rate compared to stage-1. As soon as the maximum stress is reached, the resistance decreases (instead of further increase) due to relaxation of the material between maximum stress and breaking stress. As soon as the specimen breaks, the specimen realizes high resistance. The maximum percentage change in resistance recorded for CNT reinforced epoxy with FPP technique was about 4%.
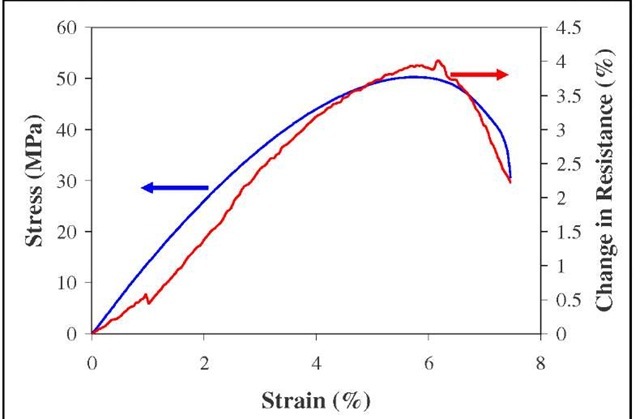
Fig. 6 provides the variation of both applied stress and percentage change of electrical resistance against axial strain of CNT reinforced epoxy using FCRP methodology. A similar trend to that of FPP technique shown in Fig. 5 can be seen for FCRP case. All three stages as discussed for Fig. 5 can be noticed in Fig. 6 too.
Fig. 7. Typical stress-strain and electrical repsonse of CB reinforced epoxy using FPP methodology
Fig. 8. Typical stress-strain and electrical repsonse of CB reinforced epoxy using FCRP methodology
The maximum percentage recorded for this technique is as well about 4%. Hence we conclude from Fig. 5 and 6 that both FPP and FCRP techniques resulted same stages and maximum value of change in resistance for CNT reinforced epoxy composites.
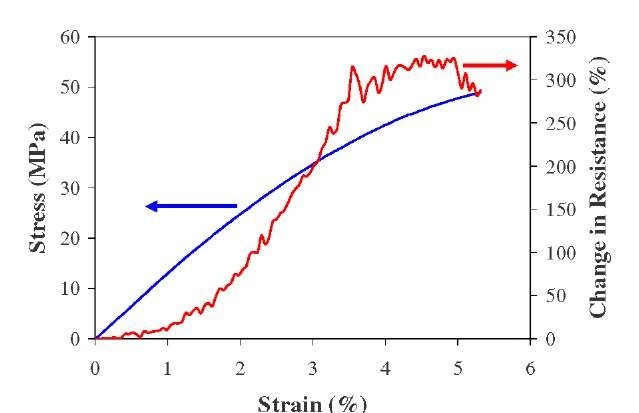
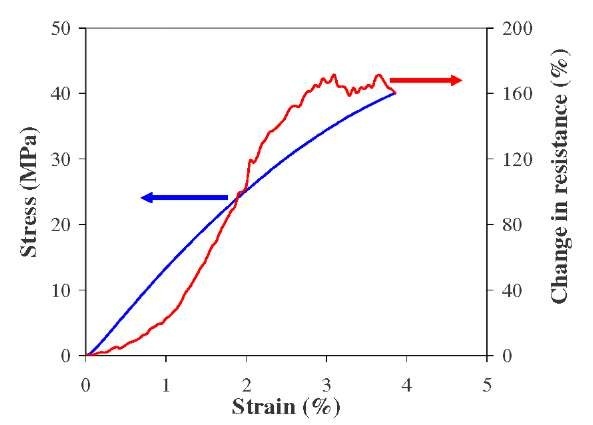
Figs. 7 and 8 provide the variation of both applied stress and percentage change of electrical resistance against axial strain of CB reinforced epoxy using FPP and FCRP methodologies respectively. The first major difference between CB reinforcement against CNT reinforcement is that the maximum change in resistance in former case is 40 to 80 times higher than that of later case. The major reason for such a big change is severe voids formation that occurs around the CB particles and the resulting growth of damage. As it can be see from Fig. 4 that percentage elongation at break of CB reinforced epoxy is almost half that of pure epoxy and which is due to severe void formation around the CB particles. This phenomenon is significant in CNT reinforced epoxy.
In can be noticed for both techniques for CB reinforcement, there exists again three stages of change of electrical resistance. Unlike in Figs. 5 and 6, in these both cases, the rate of change of resistance are less in the beginning until about 1% strain. In the second stage, after about 1%, the there is significant increase in the rate of change of resistance in both methods as shown in Figs.7 and 8. In the third stage, the maximum value of change in resistance happens before the mechanical axial load reaches maximum value. This is not the case for CNT reinforced epoxy as shown in Figs. 5 and 6. After reaching maximum value, the resistance varies about the maximum and tries to stay there again decrease that is seen in Figs. 7 and 8. The major significant difference that can be noticed in Figs 7 and 8, the FPP method notices higher change of resistance (about 315%) against maximum value (about 170%) in FCRP method for carbon black reinforced epoxy material under uni-axial tensile loading. We are not quite sure about the reasons for this difference and we would be able to explore them and present them in the conference.
Conclusions
A comprehensive experimental study has been conducted to fabricate CNT and CB reinforced epoxy to verify the effectiveness of either four point probe or four circumferential probe measurement systems to capture electrical response during uni-axial tensile loading. Even though CB reinforcement generated very high percentage change in electrical resistance, CB reinforcement is recommended because the damage the reinforcement induces will corrupt the detection of actual damage of caused by the epoxy. Although CNT reinforcement induced reduction of percentage elongation to break by 30%, the resistance change can be directly attributed to damage of the epoxy matrix and may not be primarily due to CNT reinforcement itself. Moreover, both FPP and FCRP methods yielded similar qualitative and quantitative resistance changes, hence we recommend to use four-point probe methodology using CNT reinforcement as sensory network for detecting damage in polymer systems in future studies.
