As you have seen in the previous sections, MATLAB provides many quick ways to generate very useful plots. You’ve also seen that by passing various strings and vectors you can tailor certain aspects of your plot to customize it to your needs. What you have done so far is to use the specific plotting functions, and various helper functions, e.g., title, legend, etc., to annotate and adjust your plots. As you will learn now, MATLAB provides some easy high-level and low-level graphics capabilities through a, somewhat, intuitive user interface. In this section we will discuss how to change specific features of a plot using MATLAB’s Plot Editing Mode, and the Property Editor. You will find these techniques very handy for one-time quick changes for your plots.But for the one-time touch-up, the methods here can be quite useful.
It all starts with the Figure Window; the window that you have seen with the previous examples. It pops up whenever you issue a plotting function. As you might have noticed, the Figure Window has a few tool buttons and pull-downs. You’ve might have already discovered these, but in case you haven’t we will discuss them now.
Plot Editing Mode
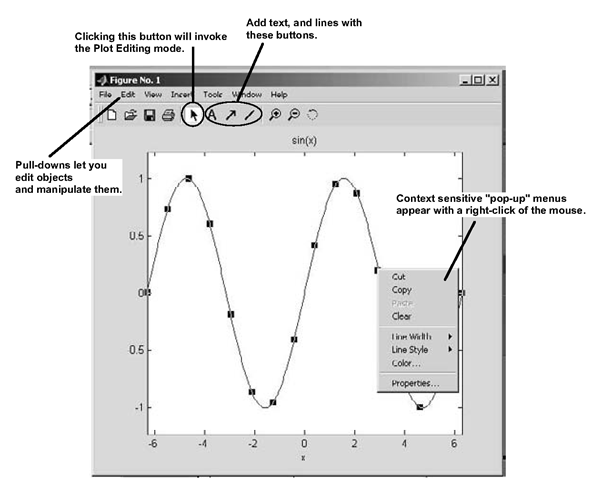
When you see the Figure Window, after you have issued a command that generates one, you will notice that there are several buttons as well as a pulldown menu. Clicking on the button that looks like an arrowhead will turn on the Plot Editing Mode. The buttons next to it let you add text and draw lines to annotate your plot. Figure 3.62 highlights some of the features available in the Plot Editing Mode.
Figure 3.62 The Figure Window in Plot Editing Mode.
The plot shown in the above figure was generated with ezplot(‘sin(x)’). Once you have entered the Plot Editing Mode, when you click on an object in the plot, like the line or the axis, the object will become highlighted with distinctive markers. Clicking once on the trace above selects the line; clicking the right mouse button will reveal a pop-up menu with properties for that object. For example, by selecting the "Line Width" property the width of the line can be changed by a simple click of the mouse. You don’t have to click on the object with the left mouse button and then the right to get the case-sensitive pop-up menu. If you place the cursor over the object, clicking the right mouse button will both select the object and reveal the menu.
You can also invoke the Plot Editing Mode from the command line in MATLAB with plotedit or plotedit(fig) where the former will begin the Plot Editing Mode for the current figure and the latter lets you specify a figure for editing by passing the figure number fig. In use, this is identical to selecting the Plot Editing Mode with the mouse.
The Property Editor
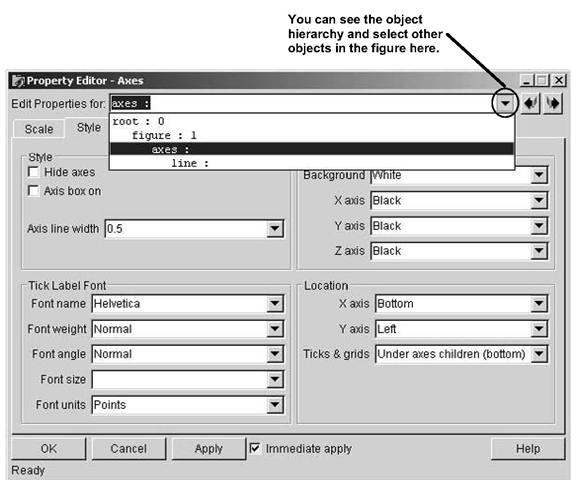
When you open the context-sensitive pop-up menu you will notice that the last menu item in the list is "Properties." Selecting this will open the Property Editor. Invoking the Property Editor on the axis in the sine plot shown in the previous figure gives the user interface shown in Figure 3.63.
Figure 3.63 The Property Editor invoked on the axes.
As you can see in Figure 3.63, a whole host of properties associated with the axes are available to you to adjust, or mangle, as you desire. You can also start the Property Editor by double clicking on an object in the plot, such as the axis. (Note that double clicking on a text object will not start the Property Editor, but instead will give you an edit box with which you can change the text.) If you keep the Property Editor open, you can click on different objects in the Figure Window and the panels in the Property Editor will change to reveal the property selections for that object.
Another nice feature of the Property Editor is the "Edit Properties for:" selection box. If you click on the down-triangle to the right, the Property Editor will show you the hierarchy of objects. Figure 3.64 highlights this.
Figure 3.64 Viewing the object hierarchy.
Unfortunately, the pages of a topic make showing you the simple nature of pointing and clicking in the Property Editor a bit cumbersome. We recommend that you spend some time with an example and see what you can learn. Try changing the line color, the axis limits, the background color, and turning grids on and off on your own using the Plot Editing Mode and the Property Editor; also try adding or editing the title and axis labels. Although very useful, the Property Editor doesn’t present all the properties available for an object, just the ones you are likely to use for high-level editing. Later we will explore another handy tool called the Property Inspector and see how it can help us appreciate the richness of objects in MATLAB.
Zooming and Rotating
To the right of the line buttons are three buttons that look like this:
With the first button here, you can zoom in on your plot by simply dragging the mouse in a box around the area at which you want to look more closely. When you do, you will see that MATLAB automatically scales the axis for the result. You can also place the cursor on a point in the image and get a 2x zoom with each click. The resulting plot will be centered at the point of the cursor. Selecting the second button, the "zoom out" will reduce the zoom by 2x each time you click it.
The third button shown here will be more useful to us after we have discussed 3-D plots. It is the rotate 3-D button and with it you can change the viewing perspective of your plot. You can use this button with a 2-D plot, but there aren’t many reasons to do so.
Exporting, Copying, and Pasting
Once you have created a plot you probably want to save it to a file, or perhaps paste it into a word processor or presentation application. You can easily prepare your plots for this right from the Figure Window. Later we will see how we can use some MATLAB commands to produce versions of our plots to use in other applications, but for now we will focus on those available to us from the Figure Window.
Figure 3.65 Changing preferences in the Figure Copy Template.
If you select File Preferences… from the Figure Window, you will open the preferences user interface as shown in Figure 3.65. In that you can choose the "Figure Copy Template" or "Copy Options" and make changes to the way MATLAB will produce representations of your plots for uses in other applications.


