ABSTRACT
Crazing is one of the dominant failure mechanisms in amorphous polymers. The micro-mechanics of crazing is often incorporated by embedding Cohesive Zone Models (CZM) into continuum models. In CZM, a traction separation law for the cohesive zone is specified with a maximum traction and a critical opening as the parameters. The main focus of the present study is to determine the cohesive parameters of crazes in thin polystyrene films. Polystyrene granules were dissolved in Toluene on a glass slide which was then transferred to a spin coater. By changing the spinning speed, polystyrene films of the desired thickness were prepared. Single Edge Notch Tension (SENT) specimens were cutout of the prepared sheets and fracture tests were conducted inside a Scanning Electron Microscope (SEM) using a tensile tester at a loading rate of 0.1 mm/min. The critical opening of the cohesive zone was directly measured from the SEM images while the /-Integral was calculated from the load-displacement curve. The opening traction was calculated by differentiating the /-Integral with the measured critical craze opening.
Introduction
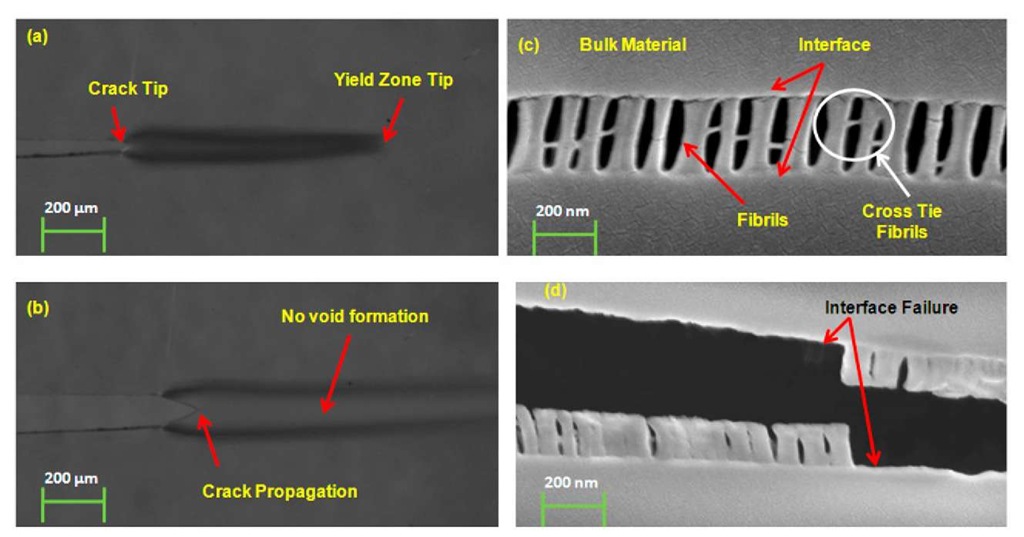
Glassy amorphous polymers are attractive materials for many engineering applications because of their low density, excellent optical clarity and ease of fabrication. They are also used as matrices in fiber composites. However, the tendency of these materials to fracture in a brittle manner and their relatively low fracture toughness have somewhat limited their applicability. Fracture in glassy polymers involves two mechanisms of localized deformation: shear yielding and crazing. Shear yielding involves plastic deformation in the form of shear bands. Shear bands are formed in polymers which exhibit strain softening in their stress-strain response. Upon further deformation, the material hardens due to molecular orientation and this leads to multiplication and propagation of shear bands. The deformation zone formed during shear yielding does not have any voids or premature cracks. Crazing is another mechanism which starts with the formation of micro voids in region of stress concentrations and primarily normal to the maximum principle stress. These voids do not coalesce to form cracks since highly stretched molecular chains (fibrils) stabilize this process to create crazes. However further craze widening leads to the breakdown of fibrils and eventually to the formation and propagation of a crack. Figure 1 shows both deformation processes observed during the fracture of glassy polymers (polycarbonate and polystyrene). .
Unlike cracks, crazes are load bearing with the craze surfaces bridged by large number of thin polymers fibrils. Usually crazes eventually generate into a crack by the breakdown of craze fibrils. Therefore, controlling crazing is a viable way of increasing the fracture toughness of polymers. The plastic work required to create crazes ahead of the growing crack appears as the major contribution to the fracture toughness GIc.
Fig. 1 Shear yielding in 0.5 mm thick sheet of polycarbonate (a) before crack propagation (b) after crack propagation and crazing in 800 nm thick polystyrene film (c) fibril formation (d) fibril breakage
The earliest works on crazing can be found in Rabinowitz and Beardmore [1], Kambour [2] and Gent [3]. The first authoritative experimental work on crazing was reported by Lauterwassar and Kramer [4]. They determined the stress distribution around the craze surface using the craze displacement profile determined experimentally. To this end they employed a Fourier transform method due to Sneddon [5].
Generally, the phenomena of crazing proceeds in three steps namely, craze nucleation, craze widening and craze breakdown. Many authors have proposed different models for different aspects of crazing. Argon and Hannoosh [6] assumed that the critical event in the craze nucleation is the formation of a critical level of porosity in the material. Sternstein and Ongchin [7] proposed a simple empirical relation for the craze initiation. Craze growth is associated with two important aspects, namely craze tip advance and craze widening. Donald and Kramer [8], Kramer [9] and Kramer and Berger [10] performed systematic experiments and proposed a criterion for craze widening. William [11] postulated that craze breakdown and subsequent crack advance occurs when a critical craze opening displacement is reached. From fracture experiments on various glassy polymers (Doll [12], Doll and Konczol [13]), indeed such a critical constant craze maximum opening has been observed.
Various authors (Estevez R. [14], Tijssens MGA [15], Van der Giessen [16], Saad Gouider [17], Basu et al. [18] and others) have studied the crazing phenomena in glassy polymers using numerical techniques like Finite Element Analysis (FEA) with Cohesive Surface Modeling. The success of a CZM depends on how faithfully the traction separation behaviour mimics the actual micromechanical processes of initiation, widening and breakdown. To this end, critical opening, maximum stress and the energy release rate (area under the traction-separation curve) are the critical parameters. These parameters have to be carefully determined from the experiments in order to successfully apply the CZM in FEA. The main focus of the present study is to determine the cohesive parameters of crazes in thin polystyrene films. The paper is organized as follows: In the next section we discuss the experimental methods which include the preparation of the polystyrene (PS) film and measurement of cohesive parameters. Results obtained from experiments and final conclusions are drawn in the last section.
Experimentation
Sample preparation
PS in the form of beads was procured from the Gail Petrochemicals, India. The molecular weight of the material was measured using Gel Permeation Chromatography (GPC). The measured molecular weights were Mw = 1.88 x 10⁵ and Mn = 4.15 x 10⁴, where Mw and Mn are the weight average and number average molecular weights. PS beads of 50 % by weight were dissolved in Toluene solution by continuous stirring and then filtered using vacuum filtration technique. The films were prepared using the spin coating technique. For that, the solution of PS was transferred to a glass slide which was mounted on the spin coater and by changing the speed of the spin coater; films of desired thickness were prepared. For the present study, a PS film of 52 ^m thickness was used.
Testing
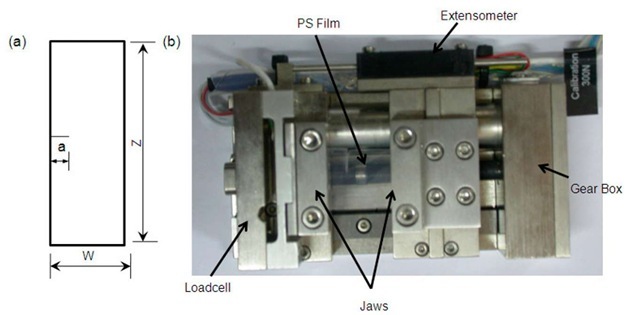
The films so formed could be easily peeled off from the glass slides and cut into the desired dimensions. The width (W) and length (Z) of the films were 15 mm and 30 mm respectively. Crack of 5 mm length (a) was cut using a razor blade. Fig 2a shows the schematic diagram of the specimen used for in situ experiments. Since PS is an insulator it tends to get charged up by the electron beam of the SEM and images tend to become blurred at high magnifications. Hence it is required to gold coat the PS film before testing under an SEM.
Fig 2 (a) Specimen geometry (b) micro tensile testing machine.
The sample was fixed on the micro tensile machine (Deben UK Ltd, UK) after gold coating using flat jaws which was then mounted on a mobile stage of FESEM (Field Emission Scanning Electron Microscope). The imaging parameters used are given in Table 1. The micro tensile machine was operated through a separate data port which could be connected to the computer. Figure 2b shows the micro tensile machine used for experiments clearly indicating the jaws for holding the specimen. The micro tensile machine was connected to the digital computer via a controller unit. The function of the controller unit is to give power supply to the micro tensile machine and to transfer the test data to the digital computer. The micro tensile machine had a load cell of capacity 300 N. The specimen was then subjected to tensile loading at a slow loading rate of 0.1 mm/min. Successive micrographs of the events occurring at the crack tip was recorded at regular intervals. The load corresponding to each micrograph was also noted. This helped to record the evolution of the craze from the crack tip as the load was increased. Further analysis of these micrographs helped in finding various parameters associated with crazing.
Table 1 Parameters for single scan imaging
|
Imaging Properties |
Zeiss SUPRA 40VP |
|
Magnification |
500X |
|
Electron detector |
In lens |
|
Working distance (mm) |
9 |
|
Vacuum mode |
High Vacuum |
|
Accelerating voltage (kV) |
10 |
|
Image size |
1022 x 685 |
|
Recording pixel shape |
Square |
|
Image quantization |
8 |
Results
In situ observations
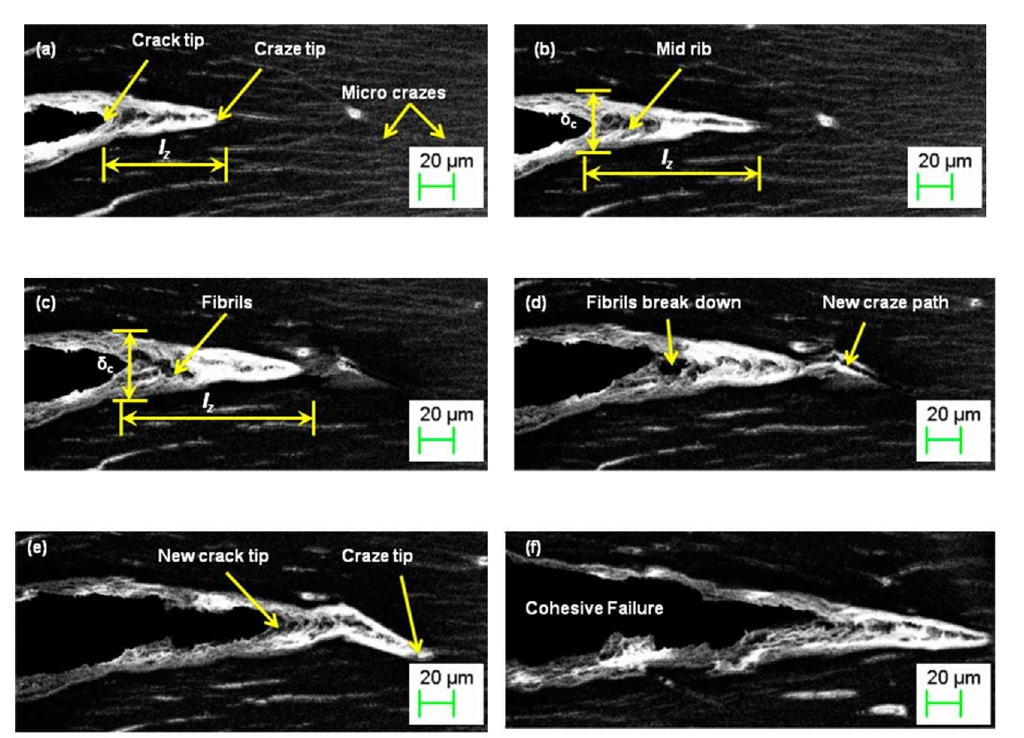
Figure 3 shows the successive micrographs of events happening at the crack tip during the fracture test. The micrographs clearly show the nucleation, growth and final breakdown of a craze at the tip of a crack. It can be observed that during loading, a fibrillated zone formed ahead of the crack tip. In Fig 4a, the crack tip and the incipient craze are clearly seen.
Fig. 3 Deformation stages of the PS film at various load levels.
The distance between the crack tip and the craze tip is marked as lz, length of the craze. The craze evolved gradually with applied load. Fibrils in the craze elongated till a critical load after which they broke down at the midrib. Critical opening and the length of the cohesive zone during loading were directly measured from the SEM images.
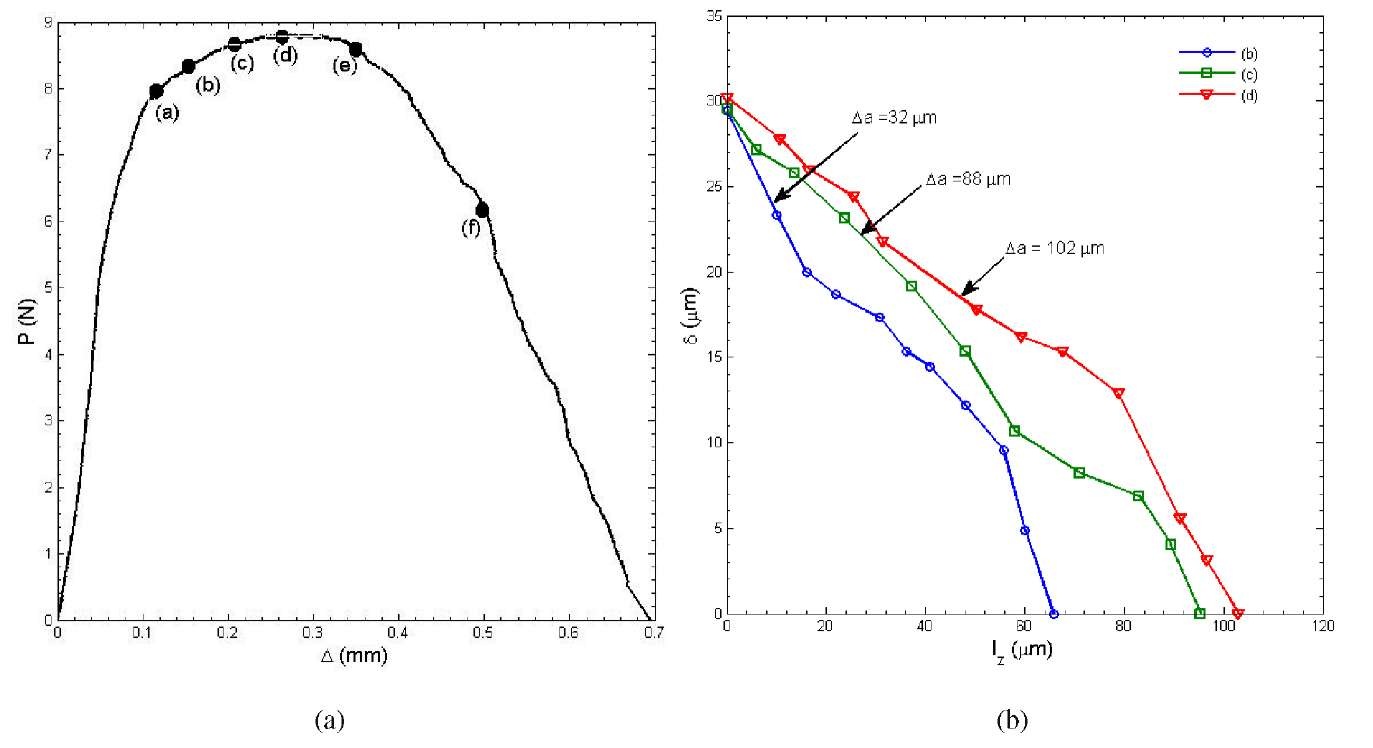
Figure 4 shows the global load-displacement curve measured during the fracture test. The curve shows an initial linear portion followed by a plateau before dropping to zero. Points marked (a) – (f) on the load displacement curve corresponds to the SEM images marked (a)-(f) in Fig. 3. The craze opening (d) as a function of the craze length (lz) measured from the SEM images at different load intervals is shown in Fig. 4b. The craze opening was measured at the crack tip. It can also be seen from Fig. 4b that the craze opening was constant with applied load but the length of the craze changes. The opening at the crack tip is known as the critical opening of the craze which should be constant and can be treated as a material property. The critical opening was measured to be 30 ^m.
Fig. 4 (a) Load-displacement curve for SENT specimen made of PS (B = 52 ^m) (b) opening profile of craze 3.2 Determination of Traction-Separation Law (TSL)
To determine the cohesive law or TSL, the /-integral approach was used. The relation between the /-integral and strain energy release rate which is valid for Linear Elastic Fracture Mechanics (LEFM) was used. LEFM can be applied when the material remains elastic except in the small damage zone forming ahead of the crack tip. The length of the damage zone should be smaller than the initial crack length (lz < a). Here the maximum length of the cohesive zone was 100 ^m before crack propagation which is much smaller than the initial crack length (a = 5.93 mm). In LEFM, the /-integral is correlated to the energy release rate, G, and can be calculated from the load displacement curves shown in Fig. 4a.
where Ue is elastic component of the strain energy, ^e is the elastic work factor and B is the thickness of the specimen. The elastic work factor can be evaluated for a given specimen geometry from the LEFM shape factor, Y(a/W). For SENT specimen geometry, is given by [18-19] as
where
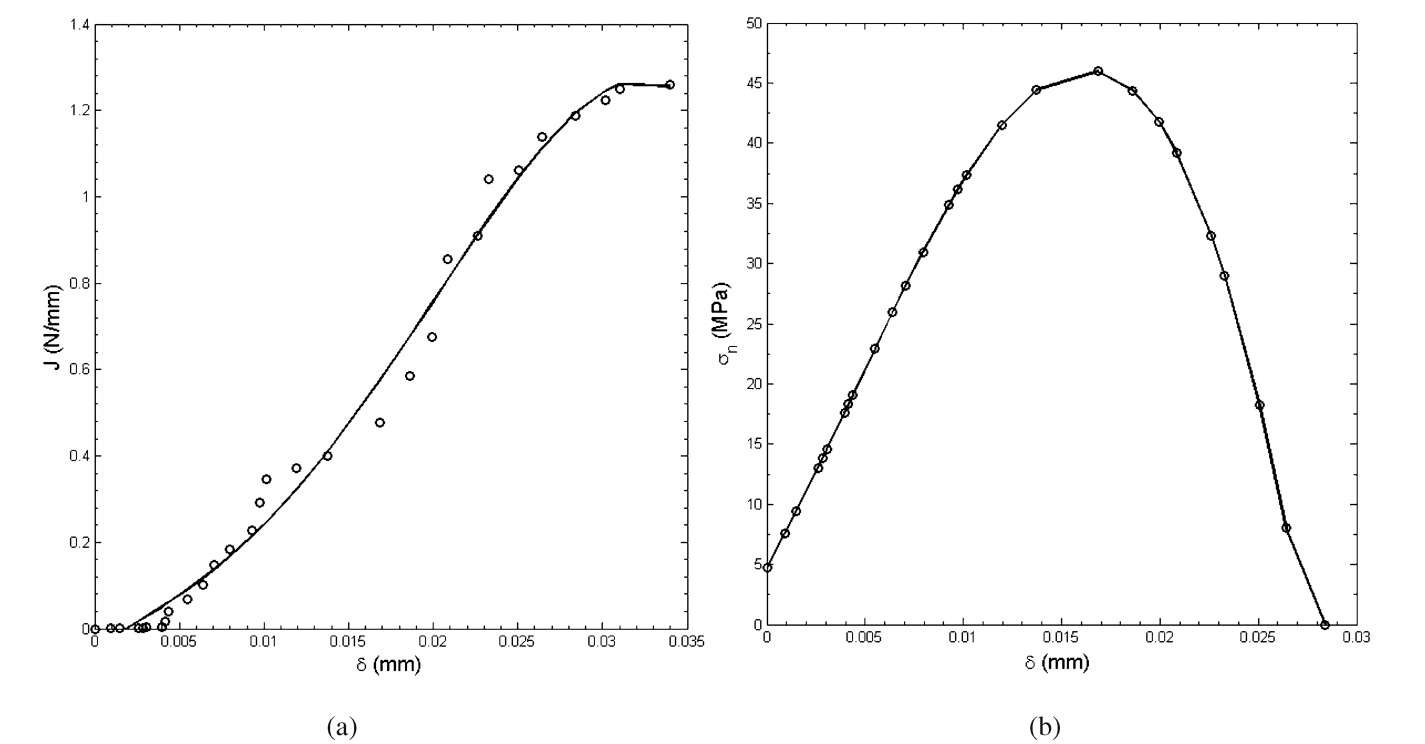
Z is the gauge length. For the present case, Z = 30 mm and a/W = 0.39. For the given geometric dimensions, the value of elastic work factor was 1.85. To determine the cohesive law, the /-integral was determined experimentally using eq. (1) and the crack tip opening (d) was directly measured from SEM images. The cohesive stress was calculated by numerically differentiating the measured /-integral with the measured crack tip opening as
Fig. 5 (a) /-integral as a function of crack tip opening (b) Traction Separation Curve
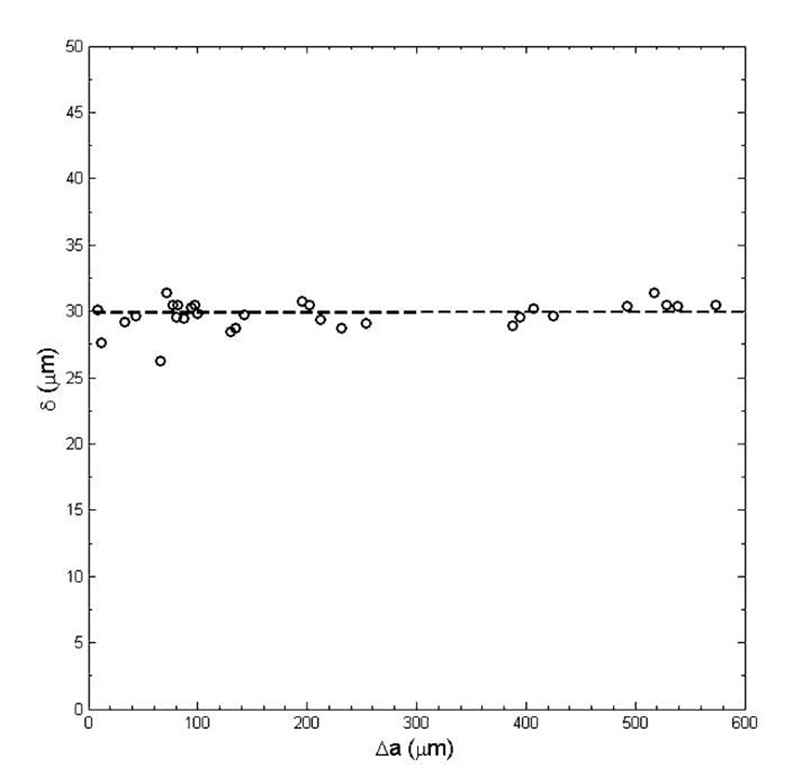
The calculated /-integral as a function of crack tip opening is shown in Fig. 5a while the TSL obtained from eq. (4) is shown in Fig.5b. Figure 5b shows that the normal traction increases with crack tip opening, reaches its maximum value at approximately 15 ^m, then decreases and eventually vanishes when fibrils brake and the crack propagates. The critical opening (corresponding to zero traction) is 28.5 ^m. The energy release rate measured from the TSL was 0.83 N/mm. Also the opening of the craze zone was measured during crack extension and it can be observed from the Fig. 6 that the maximum opening remains constant during crack propagation. The average critical opening measured directly from the SEM images is in good agreement with that shown in figure 5(b).
Fig. 6 Critical opening as a function of a crack extension
Conclusions
In-situ fracture experiments were performed inside an SEM on PS film using the SENT geometry. The nucleation, growth and final breakdown of the craze at the tip of the crack was captured in real-time. The critical opening before crack propagation was measured directly from the SEM images. The /-integral was calculated from load-displacement diagram. This /-integral was numerically differentiated by the opening at the crack tip which was measured from SEM images to obtain the traction. The maximum traction before crack propagation was determined as 46 MPa. The critical opening at which the stresses are zero was 28.5 ^m. The critical energy release rate (area under the TSL) was calculated as 0.83 N/mm. It was also observed that the critical opening, directly measured from SEM images, at different crack lengths remained essentially constant.
