RESULTS AND DISCUSSIONS TENSILE STRENGTH
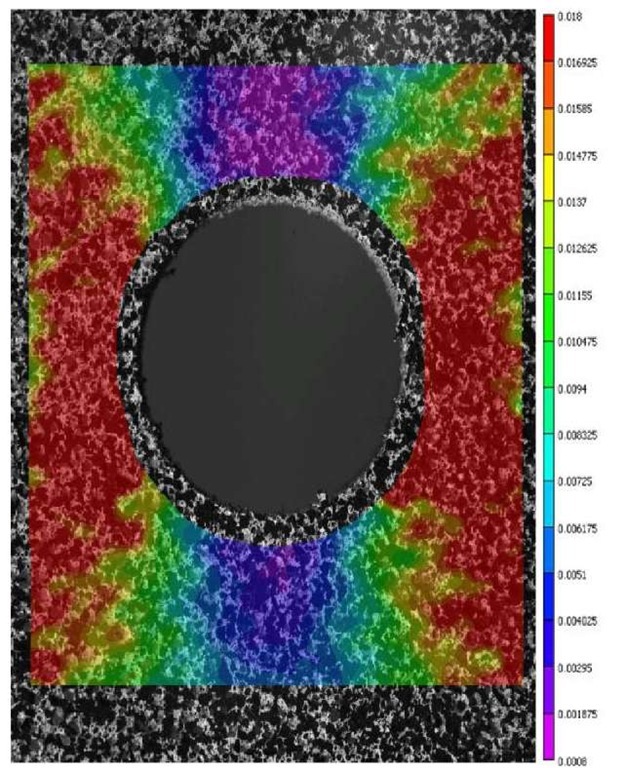
The tensile load measured directly through the load cell was used to calculate the tensile strength and the average of strains along the defect section obtained from the DIC was used to calculate the corresponding strain. The net section strength, in the case of a specimen with sharp cracks, a notch and a hole, is defined as the tensile load divided by the remaining intact area in the section with the defect. A typical strain field near the circular hole under a tensile load is shown in Fig. 3. The strain time plot at different points along the cross-section of the spacemen with center hole is shown Fig. 4. The average of these strains along the diameter of the hole is used in the strain-stress plot.
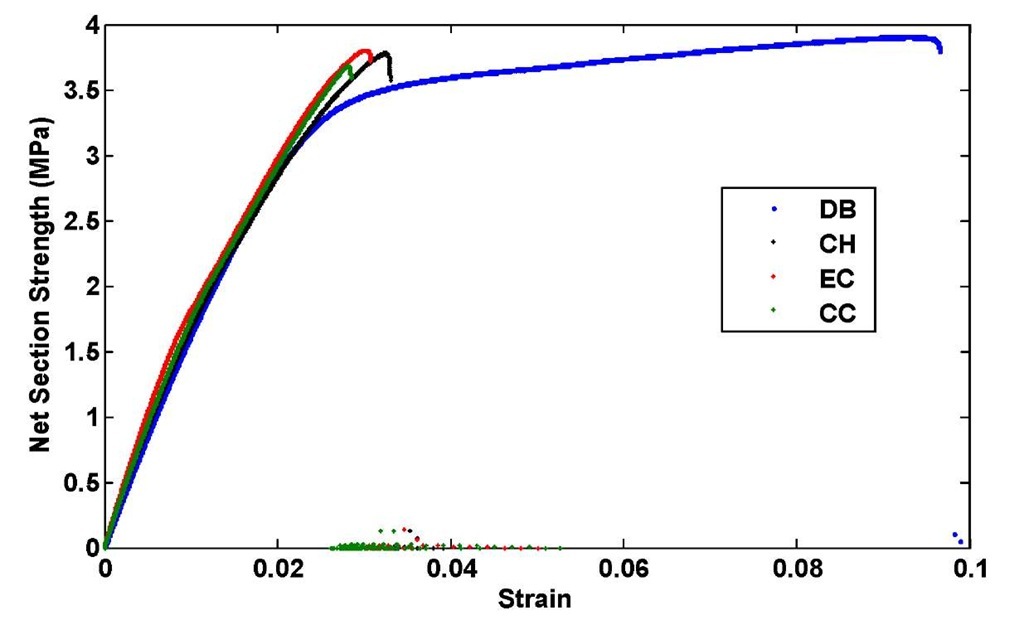
Typical stress-strain plot for all the specimen geometries considered are plotted in Fig. 5. The result was compared with the dog-bone tensile experiment of the intact specimen. From the figure it is clear that, the specimens without defect showed a typical strain-stress plot of a soft material, yielding followed by hardening and failure. The entire specimens with discontinuity shows a similar trend and result disrespect of the type of defects considered. In the case of specimens with defects, the failure takes place before any hardening effect is observed. It can also be seen that, the specimens with defects show a higher tensile yield strength compared to the intact specimen. This could be due to the relocation of failure from the weak plane in the case of cracks with defects. The failure stress is about the same for the both case, with defects and without but the failure strain decrease in the case of specimen with defects compared to specimen without defect. The failure strain in the case of specimen without any defect is about 10 % and the failure strain for specimens with defects is about 3 %.
Fig 3 A typical DIC strain field for tensile specimen With a center hole (CH) under tension
Fig 4 Strain-time plots along the midline of the hole in tensile specimen with a center hole (CH) under tension
Fig 5 Net section strength-strain plot for different tensile specimen geometries
STRESS INTENSITY FACTOR
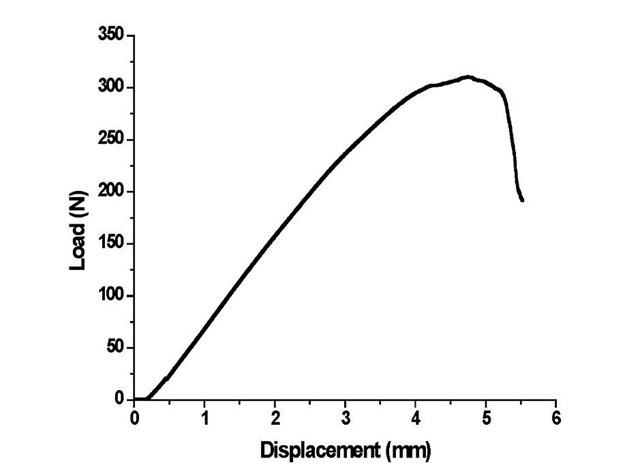
A typical load – deflection curve obtained from SENB experiment is plotted in Fig.6. The stress intensity factor was calculated using Eq. 1 and the critical load from the load-deflection curve. The average value of K obtained from the critical load measurement is 0.39 MPa m12 with in an error of -0.011 to + 0.028.
Fig 6 Typical load displacement curve for three-point bend test
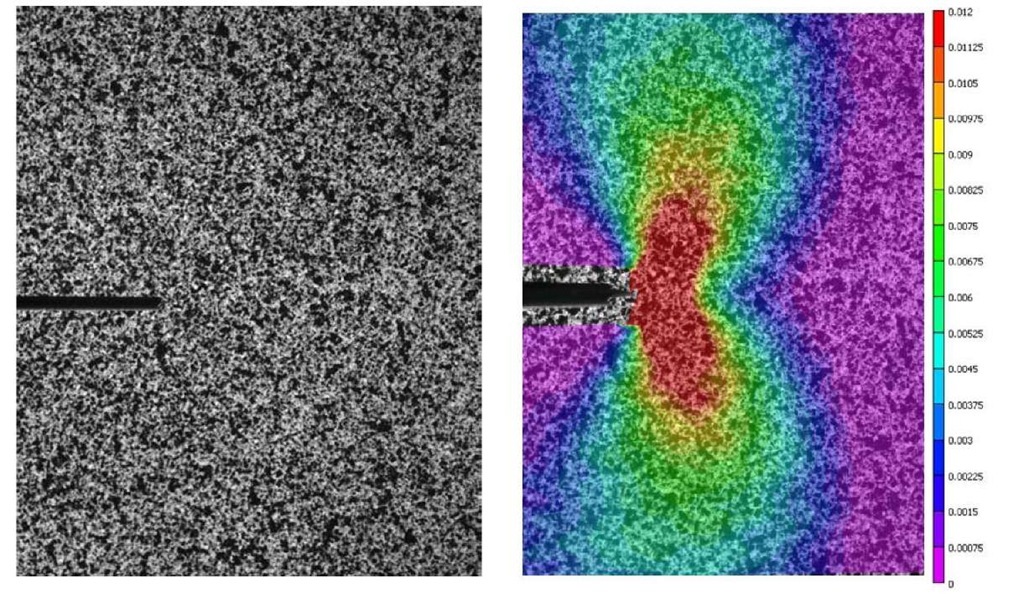
The displacement and strain fields around the crack tip were calculated from the acquired image using vic2D software provided by correlated soln. inc. Fig. 7(a) shown a typical spackled pattern of three-point bend testing specimen, and Fig. 7(b) shows the strain contour around the crack before the crack propagates. The strain fields are used to calculate K using Eq. 5 and Eq. 6.
Fig 7 A typical three point bending specimen (a) DIC speckle pattern, (b) strain field near the crack tip
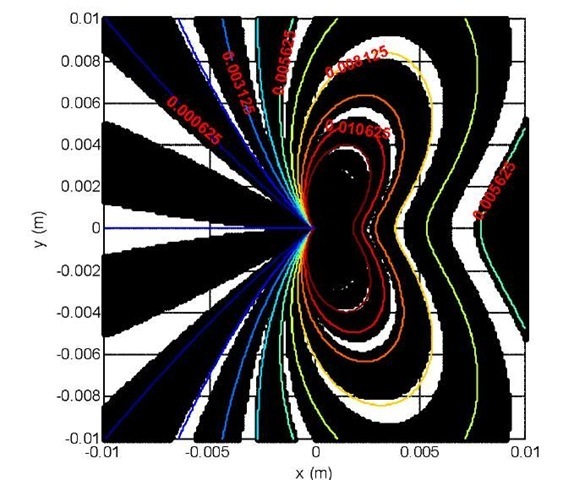
The Poison’s ratio for the foam material considered is 0.22 and results in a =64.68 and 0 =78.65. Using these two angles, multiple points at different radius were considered and Eq. 5 was used to calculate the stress intensity factor. Eq. 7 was also used to calculate the stress intensity factor from the multiple strain points. The value of K is very close to the one obtained in the above two cases, with average value of K =0.39 MPa m12. Using the calculated stress intensity factor and constants, the strain field was generated as shown in Fig. 8. It is clearly seen that, the strain field, eyy regenerated from the calculated K and the corresponding coefficients is matches well with the original strain field directly obtained from the DIC Fig 7 (b)
Fig 8 Opening mode strain field regenerated from calculated K and corresponding coefficients
CONCLUSION
An experimental investigation on the effects of holes, cracks and notches on tensile strength of polymer foam is performed. For specimens with cracks, notches and circular holes, the net section strength showed a notch-strengthening effect, the net section strength is higher compared with the specimen without defect. Though the failure stress is about the same, specimens with discontinuity failed at a lower strain compared with the intact specimen, indicating a presence of a strain concentration around the defects sections. The presence of discontinuity in polymer foam decreases the failure strain and the energy associated with it. Currently, because of their good energy absorption mechanism, foams are used in sandwich structures. Hence using strains in characterizing failure criteria will be appropriate. Furthermore fracture experiments have been performed and the stress intensity factor was obtained.
