Abstract
Energy audits can be used to provide hands-on activities related to an energy management course. After learning the necessary background concepts, students need to be aware of what measurements must be taken to evaluate an existing energy system. In industry and universities, one may find apprentices and students from different educational backgrounds, such as electricians with no exposure to newer measuring instruments and students with no ability to take electrical and/or mechanical measurements. By studying the capabilities and limitations of measuring instruments, newcomers to the energy auditing may collect reliable data. This article introduces several hands-on activities that could be replicated to teach students how to take accurate measurements of electrical, light, and heat flow parameters, ultrasonic leak detection, electronic combustion analysis, and simple data acquisition before conducting energy audits. A sample laboratory activity includes a description of the measuring instrument, factors that contribute to inaccurate readings, safety concerns, and several practice measurements useful to energy audits.
INTRODUCTION
It has been accepted that engineering technology courses should have some hands-on activities such as labs, projects, and other practical experiences. In the field of energy management, energy audits have been used effectively to provide hands-on experiences.[1] An energy audit, also known as energy survey, energy analysis, or energy evaluation, is a process that examines the current energy consumption of a process or facility and proposes alternative ways to cut down energy consumption or costs. One aspect of the energy auditing process is to collect specific data of a process or a facility. Measuring temperature, flow rates (heat, liquid, and air), intensity of light, electrical current, voltage, power, power factor (PF), humidity, pressure, or vibration may be required to determine the energy consumption and waste. New measuring equipment is pouring into the measurement world making data collection easier, more accurate, and safer.
Accurate data collection is paramount not only to analyze energy consumption, but also to evaluate the effectiveness of proposed changes suggested in an energy audit report. Some energy-saving electrical retrofits may introduce electrical power quality problems that may not be accounted for by traditional meters, causing erroneous data. With inaccurate data, the conclusion of an energy improvement project holds no validity.[2]
Preliminary or walk-through energy audits are the most suitable for beginners. A preliminary energy audit is a process during which an auditor examines an existing energy consuming system according to a predetermined set of procedures. The procedures are outlined as a result of a historical data analysis of the targeted system and conversations the auditor had with the owner or the operator of the system. These procedures include taking electrical and other measurements under certain conditions.
ELECTRICAL MEASUREMENTS
Data collection of any system that consumes electrical energy requires at least three basic measurements— voltage, current, and PF—for energy analysis calculations. Utility meters collect all these data at a building service entrance point or at any other sub-metering location, if such meters are installed. By contacting the utility provider, one can easily obtain the historical data related to the above parameters and more for a given facility. However, when it comes to individual systems within a facility, these data may not be available, unless additional utility meters are installed at each of the service entrance points to individual systems. In a modern power distribution system, harmonics of the fundamental frequency, 50 or 60 Hz, appear due to non-linear devices connected into the system. Power line harmonics cause erroneous readings, if a meter is not capable of measuring true root-mean-square (RMS) values of the fundamental frequency and the harmonics at a given instant.[3]
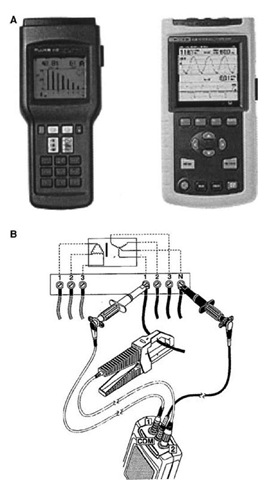
Fig. 1 (A) Fluke 41B and 43B power analyzer, (B) Using meter probes for three-phase.
Two power quality analyzers made by Fluke Corporation are shown in Fig. 1A. One of these meters can be easily used to obtain all necessary data for an electrical system. Fig. 1B shows how to obtain measurements for a three-phase balance (5% or less imbalance) using voltage and current probes that come with the meter. The meters are capable of measuring true RMS, peak, and total harmonic distortion (THD) for voltage and current. They also display true power (Watts), reactive power volt ampere reactance (VAR), PF, displacement power factor (DPF), crest factor, ^-factor, and harmonics individually up to the 31st.
The meters are capable of displaying data in three views—waveforms, barographs showing harmonic levels, and numeric values for voltage, current, and power—as depicted in Fig. 2.
Each of the data displayed on Fig. 2 gives some clue about the nature of power quality. For example, flat-topped voltage waveform is an indication of the presence of current harmonics. One can use the THD levels to determine if they are within the specified limits. If not, the same data can be used to determine sizing of transformers and harmonic filters. The bar-graph display of the current reveals the percentage comparison of odd-numbered harmonics with respect to the fundamental frequency. Even-numbered harmonics cancel out in a power system; therefore their effects are not a concern in a power system. Finally, the meter displays numerical values such as total PF, DPF, kilovolt ampere, and kilowatt useful in determining power-factor correction methods. The data can be further analyzed by downloading FlukeView® software, which comes with the meter. Fig. 3 depicts current waveform of a nonlinear load and downloaded data in a tabular form.
Fluke 43B power quality analyzer has all the features of a 41B as well as sample and storage capabilities. These additional features allow a user to detect voltage/current sags and transients in a power system.
Practice Activity Outline
A typical electrical power system may have one of the following problems: (1) voltage sags, (2) current balance and loading, (3) harmonics, (4) grounding, or (5) loose connections. Taking measurements at the electrical service panel during an energy audit, the investigator can determine the sources of these problems. In a laboratory environment (or in a workshop), each of the above problems can be replicated to demonstrate the effects.
Fig. 2 Waveform, bar graph, and numerical displays of data presented by Fluke 41B.
Fig. 3 Data table, current waveform, and harmonic representation of a nonlinear load.
For example, the circuit shown in Fig. 4 may help students learn how to detect harmonics and locate the harmonic producing sources in a power system. The three-phase power supply should be taken from a Y-connected transformer secondary where the common point is taken as neutral. It is also necessary to ground the common point, if concepts related to overloading are introduced. A double-pole double-throw (DPDT) switch allows switching between the lamp-only circuit and the lamp with a dimmer circuit. The lamp-only path would allow the student to study the waveform characteristics and harmonic content of a linear load. The lamp with a dimmer can be used to observe the voltage and current waveform variation when harmonics are present to the right of the point, where the Fluke 43B meter is connected. Using the sag and swell mode of the Fluke 43B meter, a sample can be taken when DPDT is in position A and the Variable Speed Drive (VSD) is off. The waveform would look similar to the one shown in Fig. 5A. Note that the voltage sag coincides with a current swell indicating that the disturbance has occurred downstream of the measurement point.
The concept of upstream disturbance can be demonstrated by switching the DPDT switch to position B and starting the drive. A sample display taken under this condition is shown in Fig. 5B. Note that the voltage sag occurs simultaneously with the current sag, indicating that the source of the disturbance is upstream of the measurement point.[4]
Precautions
First of all, students must have a thorough understanding of the instrument’s limitations. They should make voltage measurements after acircuitbreaker and wear safety gloves and eyewear when taking measurements of live panels.
LIGHT MEASUREMENTS
On average, lighting consumes 35% of energy used in commercial buildings and 25% in industrial facilities. Lighting levels directly affect the productivity of employees. However, many lighting systems are improperly designed and unattended over the years. Lighting is one of the areas where companies can save energy with the least amount of capital investments. Fig. 6 illustrates the before and after appearance of a warehouse, where 50% more light was obtained.
Fig. 4 A circuit for learning the sources of harmonics in an electrical power system.
Fig. 5 (A) Downstream disturbance, (B) Upstream disturbance.
Light meters are very easy to use. The meter in Fig. 7 measures light intensity in Lumen and light density in foot-candles (fc). The purpose of measuring light is to determine the incident light on a horizontal or vertical surface. Illumination Engineering Society of America (IESA) publishes recommended light levels for specific tasks.
Fig. 6 Fifty percent more light obtained through lighting retrofits in a warehouse.
Practice Activity Outline
Select a location where students can move around with a ladder for at least 2 h. First, students draw an accurate layout of the space being audited including the location of furniture, windows, cabinets, and lighting fixtures. The location could be a classroom, a lab, a corridor, or a gym.
Using a light meter, students record the available light intensity in fc on horizontal and vertical surfaces with and without artificial lights. This would yield a light distribution map. Now compare the available light with the recommended light to determine levels and locate poorly illuminated or over-illuminated areas. Most classroom and labs are illuminated by fluorescent light fixtures. The amount of light generated by fluorescent light deteriorates with time. Students may replace existing fluorescent tubes with new ones to examine the available light.
Precautions
Students need to be aware that only the incident light on horizontal surfaces can be added. Light intensity must be measured at the recommended height as specified by IESA or any other standard. It is important to stay away from the detector to minimize the effect of body-reflected light entering into the detector.
BUILDING ENVELOP MEASUREMENTS
The heat loss or gains of a building depend on many factors: R-value of walls and roof material, window characteristics, ambient temperature, humidity level, and heating and cooling degree days of a given location where
Fig. 7 A stick-type light meter with a retractable sensor.
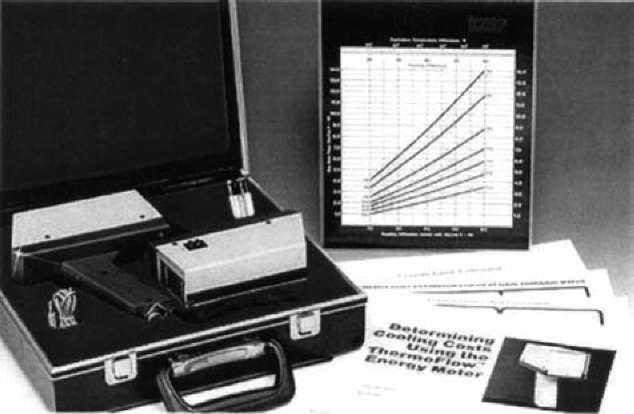
the building is allocated. When R-value and {/-values are known, a detailed analysis of a building envelop would yield British thermal unit lost or gained through walls, windows, and other heating and cooling sources. It is very difficult to determine the R-values of even a several-year old facility due to poor record keeping and later add-ons to the structures. The OMEGA® OS-650 energy conservation and plant maintenance kit (see Fig. 8) is very useful in energy audits and general plant maintenance. The kit consists of an infrared (IR) thermometer capable of measuring temperatures from — 2 to 200°F and a heat flow meter, which is a specially designed IR radiometer capable of displaying heat flow though a scanned wall in terms of British thermal unit per square feet hour.[6] The kit is priced around $1600. If purchased separately, either the thermometer or the heat flow meter would cost about $800.
Practice Activity Outline
A laboratory activity can be developed, so students will be able to (1) estimate R-value value of an unknown insulator,
(2) measure heat flow through walls and windows, and
(3) make energy cost analyzes at the end of the activity. To estimate R-value, net heat flow should be determined by using the heat flow meter. This is done by taking two measurements across a wall at the same height—one from inside and the other from outside of the room. The meter shows a+ or— number, indicating the direction of heat flow.
Fig. 8 OMEGA OS-650 Energy Conservation and Plant Maintenance Kit.
THERMAL IMAGING
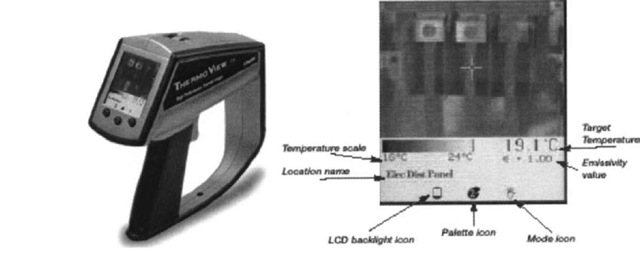
During any energy conversion process, heat is produced as a by-product. Poor insulation of buildings and pipes carrying hot or cold liquids causes energy wastes. New retrofits and devices containing switching power electronic circuits may introduce harmonics, which may overheat the neutral conductors. Poor connections of an electrical distribution system are the major contributor to system inefficiencies and may lead to a catastrophic fire. All of the above could be avoided, if one could detect them in advance. To detect such abnormalities, one requires a thermal imager. A thermal imager, compared to an IR thermometer, is capable of measuring temperature variation between two adjacent points. In the past, the cost of thermal imagers prevented widespread use in energy management and plant-maintenance activities. Industries hired a consultant to survey all electrical distribution panels and other critical locations in a facility to determine the thermal profile annually. But prices have come down significantly, under $10,000, over the past few years. A specially designed, hand-held thermal imager made for energy audits and plant maintenance is shown in Fig. 9.
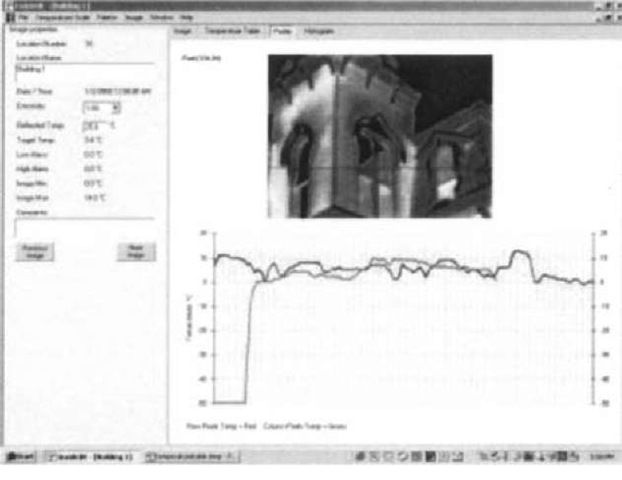
The imager can hold up to 100 images, which are stamped with time and date as they are taken. Through an Universal Serial Bus (USB) port, the images can be downloaded to the accompanying software installed on a PC for further analysis. Images can be further analyzed by assigning a single color to a temperature range and creating a thermal profile. A thermal profile represents the temperature at the x and y axes as the cursor moves around the image.[7]
Practice Activity Outline
Many interesting activities can be developed around this device. Students could measure the temperature of different light sources and compare the power consumption of each light bulb and the surface temperature. The internal heat distribution of a room could be detected and documented by hanging black-painted aluminum sheets. Since this device measures the reflected thermal energy, the manufacturer recommends painting highly reflective surfaces with some dark color to minimize reading errors. Students could develop thermal images of buildings on campus and analyze the heat losses. In a power lab, students could measure the temperature of conductors when motors are driven with variable speed drives (Fig. 10). Precautions
When taking an image, the focus is paramount. As with any digital camera, lack of focus blurs the image, thus minimizing the device’s ability to distinguish the temperature difference between adjacent pixels. Some imagers have a minimum focusing distance that must be adhered to. Most current thermal imagers allow users to view the object using different color palettes such as rainbow, ironbow, and grayscale. Despite the popularity of color palettes, it is recommended to use grayscale for most applications, because the human eye can detect variations of grayscale better when thermal changes are subtle. In addition, students must be aware of concepts such as qualitative vs quantitative temperature measurements, distance to target ratio, field of view, effects of environmental conditions (steam, dust, smoke, etc.), and effects of emissivity.
Fig. 10 Multi-image display and thermal profile using ThermoView™ Ti30 imager.
COMBUSTION ANALYSIS
The effectiveness of fossil-fuel burning receives little attention during an energy audit process unless the auditor is well trained to perform mechanical tests. The mechanical test, a tedious process, requires a set of data from several different pieces of equipment such as draft gauges, thermometers, carbon monoxide (CO) stain length tubes, wet chemical absorption instruments, etc. Then the data are entered into a slide ruler calculator to determine the combustion efficiency.1-8-1
New electronic combustion analyzers provide more reliable and provable data than a traditional “eyeballing the flame” analysis. It also produces faster professional analysis than a mechanical test. Fyrite® Tec 50 and 60 residential combustion analyzers by Bacharach Inc. shown below (Fig. 11) falls under $500 and comes with many features that make this instrument ideal for technicians and students alike.
A user first selects the type of fuel being burnt. The fuel choices are natural gas, #2 oil, propane, and kerosene. The meter can measure flue gas oxygen content 0.0%-20.95% O , flue gas temperature up to 999°F, ambient temperature 32°F-104°F, and flue gas CO content 0-2000 ppm CO. Based on these measurements, the meter is capable of calculating the following: combustion efficiency 0.1%-99.9%, flue gas carbon dioxide content 0.0 to a fuel dependent maximum (in percent), flue gas CO air-free content 0-9999 ppm, and excess air 0%-400%.
Fig. 9 Raytek ThermoView™ Ti30 portable imager and its display.
Practice Activity Outline
Practice activities for this meter may include: (1) testing flames produced by the four different type flames while varying the air intake into the flame, (2) experimenting heat transfer characteristics of a jar containing water (or any other liquid applicable to a certain industrial process) under different insulations and ambient temperatures, and (3) simulating a specific type of burner used in an industrial facility to investigate efficiency improvement opportunities. Flames for activity-1 and activity-2 above can be set up by using off-the-shelf burners or commercial water heaters.
Precautions
When working with flammable gases in closed environments, one must adhere to Occupational Safety and Health Administration (OSHA) safety guidelines. Students must be aware of every detail of the gas being used and wear appropriate protection apparatus, which include burn-proof gloves and eye protection.
ULTRASONIC LEAK DETECTION
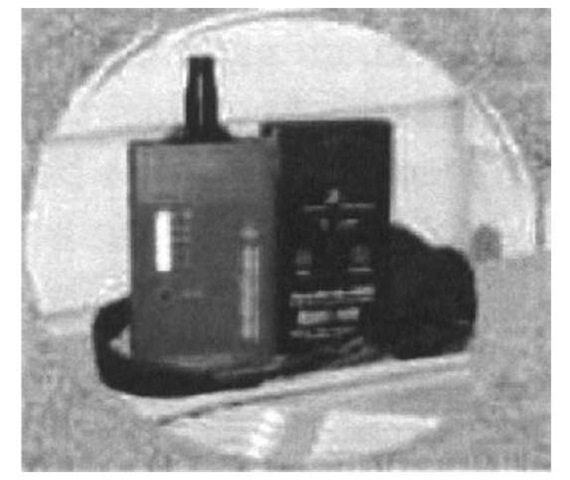
A leak, whether it is a compressed air, steam, or conditioned air, is a waste. Hidden costs due to leaks can be significant in very competitive market environments. Some leaks are very easy to detect, while others are not. Most leaks go undetected due to ambient noises. To detect some types of leaks, one has to use ultraviolet (UV) dyes, special lamps, bubble solutions, etc. Leak detection takes time and money. Any instrument that detects different types of leaks within a very short time would be the most practical solution.
Ultrasonic leak detectors minimize traditional problems associated with leak detection. Fig. 12 depicts a leak detector made by Superior Signal Company Inc., which comes with a price of less than $250.
According to the manufacturer’s specifications, the meter can detect leaks of any type of refrigerant gas, vacuum, and pressure leaks. The reading is not affected by saturated gas areas or windy environments. An energy auditor may even detect leaks around freezer and cooler doors with this meter.[9]
Fig. 11 Fyrite® Tec 50 and 60 residential combustion analyzers and a manufacturer’s comparison of combustion analysis techniques.
Fig. 12 AccuTrak VPE by Superior Signal Company, Inc.
Practice Activity Outline
Several simple activities can be developed to familiarize this equipment in a laboratory or workshop environment where compressed air is available. Several holes, at least one foot apart with different diameters, can be drilled in a copper piping tube. A connector needs to be soldered to one end and the other end must be capped. Once connected to a regulated compressed air outlet, learners may trace air leaks of each hole under different pressure to learn the nature of the leaks and the corresponding meter responses. The activity can be further expanded by moving away from the leaks and/or walking around the pipe. Similarly, to study the nature of leaks due to doors and windows, learners may take measurements around commercial soft drink coolers located in any facility.
Precautions
People have a natural tendency to clear the area around a suspected leak, especially painted or corroded surfaces, to examine the leak more closely. This may cause the hole to burst without much warning, spewing dust and loose particles all over. Therefore, students must wear safety glasses and dusk masks as appropriate when testing leaks of any form.
LOW COST DATA ACQUISITION
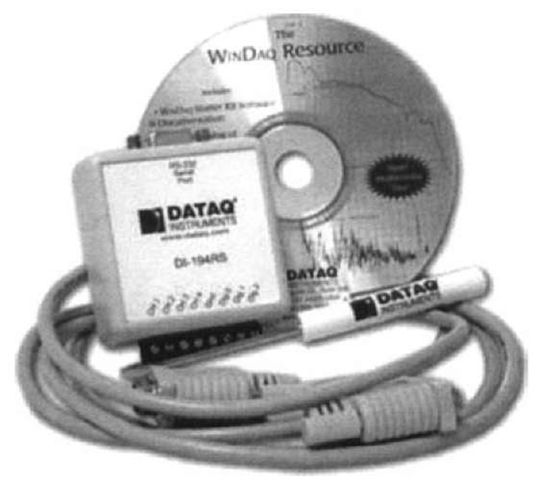
Energy managers have to rely on historical data when energy analyzes are performed. A trend of a measured parameter such as current, voltage, temperature, etc. presents a better picture of energy-saving opportunities than instantaneous readings. Most data loggers are expensive, because they are designed to minimize potential damages to the front-end electronics of the data acquisition system and the computers used to record the data. For laboratory applications and short-term data logging, one may use the D1-194RS low-cost (less than $25) data acquisition starter kit shown in Fig. 13. The kit includes hardware, recorder software, and a serial port cable.
The hardware is self-powered through the serial port of PC. Analog signals connected to any of the four channels are digitized and saved into the hard drive while showing on the screen as a strip-chart recorder. Each channel can be sampled up to 240 samples per second with 12-bit resolution, which is adequate for most analog signals in the energy field. Each channel accepts + 10 V, which is large enough for most commercially available transducer outputs. The software includes Active-X control libraries that allow the user to program the kit from any Windows environment. The recoded data may be play backed for later analysis.[10] The input signals are not optically isolated and measured with respect to a common ground point.
Fig. 13 DATAQ 4-channel data acquisition and chart recorder starter kit model.
Fig. 14 Schematic diagram to measure ambient temperature directly with DATAQ starter kit.
Practice Activity Outline
Any transducer that produces 0to + 10Vor0to — 10V output proportional to the measured variable can be connected directly. As a precaution, measure the voltage between two grounds to verify that the two grounds are at the same electrical potential. When commercial transducers are not available, a very inexpensive ambient room temperature sensor could be developed by using a LM34 temperature sensor integrated circuits (IC) made by National Semiconductors Inc., as shown in Fig. 14.
LM34 IC produces 10 mV for every degree of Fahrenheit. For example, when it senses 72°F, the output would be 720 mV. The computer display would show this reading as a 720 mV, or it can be calibrated on the software to display in Fahrenheit. The software can be set up to save time-stamped signals for later analysis. The activity can be expanded by adding a second channel that tracks the turn-on-off signal of rooms’ heating ventilating and air conditioning (HVAC) unit. Once the graphs are plotted, the learners may be able to study process characteristics of the room by measuring dead time, time constant, etc.
Precautions
Users of this data acquisition system should be aware that this unit does not provide electrical isolation. As long as the transducer’s electrical ground and the unit hardware ground, which is the PC ground, are at the same potential, the unit will work accurately. A dc voltmeter reading between these two points reveals any potential problems. The unit measures only voltage signals. Current signals should be converted into a proportional voltage signal using a current shunt placed in series with the load. However, common mode voltage applied to the unit may destroy the unit hardware unless necessary precautions are taken.
CONCLUSIONS
New meters appearing on the market make data collection for energy audits fun and instructive. With this new measuring equipment, an auditor can take measurements that were not economical or even possible several years ago. Collected data can be easily analyzed with software and sent to another individual conveniently over the internet. Seven measurement instruments have been presented. Each meter has its own unique capabilities compared to the traditional equipment. However, they have their own limitations as well. When taking sophisticated measurements, one should be aware of the conditions under which those measurements must be taken. One can understand the measuring equipment potentials and limitations by performing a set of controlled activities in a laboratory environment. This will allow the learner to change one variable at a time. Under no circumstances should one bypass safety requirements specified by the equipment manufacturers. Some meters require periodical calibrations.
