Introduction
Human observers have a remarkable ability to determine the threedimensional (3D) structures of objects in the environment based on patterns of light that project onto the retina. There are several different aspects of optical stimulation that are known to provide useful information about the 3D layout of the environment, including shading, texture, motion, and binocular disparity. Although numerous computational models have been developed for estimating 3D structure from these different sources of optical information, effective algorithms for analyzing natural images have proven to be surprisingly elusive. One possible reason for this, I suspect, is that there has been relatively little research to identify the specific aspects of an object’s structure that form the primitive components of an observer’s perceptual knowledge. After all, in order to compute shape, it is first necessary to define what “shape” is.
An illuminating discussion about the concept of shape was first published almost 50 years ago by the theoretical geographer William Bunge (1962). Bunge argued that an adequate measure of shape must satisfy four criteria: it should be objective; it should not include less than shape, such as a set of position coordinates; it should not include more than shape, such as fitting it with a Fourier or Taylor series; and it should not do violence to our intuitive notions of what constitutes shape. This last criterion is particularly important for understanding human perception, and it highlights the deficiencies of most 3D representations that have been employed in the literature. For example, all observers would agree that a big sphere and a small sphere both have the same shape—a sphere—but these objects differ in almost all of the standard measures with which 3D structures are typically represented (see Koenderink, 1990). In this topic, I will consider two general types of data structures—maps and graphs—that are used for the representation of 3D shape by virtually all existing computational models, and I will also consider their relative strengths and weaknesses as models of human perception.
Local Property Maps
Consider the image of a smoothly curved surface that is presented in Figure 11.1. Clearly there is sufficient information from the pattern of shading to produce a compelling impression of 3D shape, but what precisely do we know about the depicted object that defines the basis of our perceptual representations? Almost all existing theoretical models for computing the 3D structures of arbitrary surfaces from shading, texture, motion, or binocular disparity are designed to generate a particular form of data structure that we will refer to generically as a local property map. The basic idea is quite simple and powerful. A visual scene is broken up into a matrix of small local neighborhoods, each of which is characterized by a number (or a set of numbers) to represent some particular local aspect of 3D structure.
The most common variety of this type of data structure is a depth map, in which each local region of a surface is defined by its distance from the point of observation. Although depth maps are used frequently for the representation of 3D shape, they have several undesirable characteristics. Most importantly, they are extremely unstable to variations in position, orientation, or scale. Because these transformations have a negligible impact on the perception of 3D shape, we would expect that our underlying perceptual representations should be invariant to these changes as well, but depth maps do not satisfy that criterion.
FIGURE 11.1 A shaded image of a smoothly curved surface. What do observers know about this object that defines the basis of their perceptual representations?
The stability of local property maps can be improved somewhat by using higher levels of differential structure to characterize each local region. A depth map, Z = f ( X , Y ) represents the 0th order structure of a surface, but it is also possible to define higher-order properties by taking spatial derivatives of this structure in orthogonal directions. The first spatial derivatives of a depth map (f , f ) define a pattern of surface depth gradients (i.e., an orientation map). Similarly, its second spatial derivatives ( fXX, fXY, fYY ) define the pattern of curvature on a surface. Note that these higher levels of differential structure can be parameterized in a variety of ways. For example, many computational models represent local orientations using the surface depth gradients in the horizontal and vertical directions ( fX, fY ), which is sometimes referred to as gradient space. An alternative possibility is to represent surface orientation in terms of slant (a) and tilt (t), which are equivalent to the latitude and longitude, respectively, on a unit sphere.
There are also different coordinate systems for representing second-order differential structure. One common procedure is to specify the maximum and minimum curvatures (k1,k2) at each local region, which are always orthogonal to one another. Another possibility is to parameterize the structure in terms of mean curvature (H) and Gaussian curvature (K), where H = (k1 + k2)/2 and K = k1k2.Perhaps the most perceptually plausible representation of local curvature was proposed by Koenderink (1990), in which the local surface structure is parameterized in terms of curvedness (C) and shape index (S), where C = ■^k2 + k^S = arctan2(kj,k2). An important property of this latter representation is that curvedness varies with object size, whereas the shape index component does not. Thus, a point on a large sphere would have a different curvedness than would a point on a small sphere, but they would both have the same shape index.
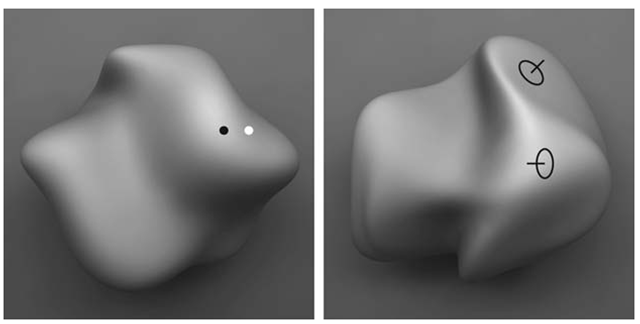
There have been many different studies reported in the literature that have measured the abilities of human observers to estimate the local properties of smooth surfaces (see Figure 11.2). One approach that has been employed successfully in numerous experiments is to present randomly generated surfaces, such as the one shown in the left panel of Figure 11.2, with two small probe points to designate the target regions whose local properties must be compared. This technique has been used to investigate observers’ perceptions of both relative depth (Koenderink, van Doorn, and Kappers, 1996; Todd and Reichel, 1989; Norman and Todd, 1996, 1998) and relative orientation (Todd and Norman, 1995; Norman and Todd, 1996) under a wide variety of conditions. One surprising result that has been obtained repeatedly in these studies is that the perceived relative depth of two local regions can be dramatically influenced by the intervening surface structure along which they are connected. It is as if the shape of a visible surface can produce local distortions in the structure of perceived space. One consequence of these distortions is that observers’ sensitivity to relative depth intervals can deteriorate rapidly as their spatial separation along a surface is increased. Interestingly, these effects of separation are greatly diminished if the probe points are presented in empty space, or for judgments of relative orientation intervals (see Todd and Norman, 1995; Norman and Todd, 1996, 1998).
Another technique for measuring observers’ perceptions of local surface structure involves adjusting the 3D orientation of a circular disk, called a gauge figure, until it appears to rest in the tangent plane at some designated surface location (Koenderink, van Doorn, and Kappers, 1996; Todd et al., 1997). There are several variations of this technique that have been adapted for different types of optical information. For stereoscopic displays, the gauge figure is presented monocularly so that the adjustment cannot be achieved by matching the disparities of nearby texture elements. Although the specific depth of the gauge figure is mathematically ambiguous in that case, most observers report that it appears firmly attached to the surface, and that they have a high degree of confidence in their adjustments. A similar technique can also be used with moving displays. However, to prevent matches based on the relative motions of nearby texture elements, the task must be modified somewhat so that observers adjust the shape of an ellipse in the tangent plane until it appears to be a circle (Norman, Todd, and Phillips, 1995). This latter variation has also been used for the direct viewing of real objects by adjusting the shape of an ellipse that is projected on a surface with a laser beam (Koenderink, van Doorn, and Kappers, 1995).
FIGURE 11.2 Alternative methods for the psychophysical measurement of perceived three-dimensional shape. The left panel depicts a possible stimulus for a relative depth probe task. On each trial, observers must indicate by pressing an appropriate response key whether the black dot or the white dot appears closer in depth. The right panel shows a common procedure for making judgments about local surface orientation. On each trial, observers are required to adjust the orientation of a circular disk until it appears to fit within the tangent plane of the depicted surface. Note that the probe on the upper right of the object appears to satisfy this criterion, but that the one on the lower left does not. By obtaining multiple judgments at many different locations on the same object, it is possible with both of these procedures to compute a specific surface that is maximally consistent in a least-squares sense with the overall pattern of an observer’s judgments.
Jan Koenderink developed a toolbox of procedures for computing a specific surface that is maximally consistent in a least-squares sense with the overall pattern of an observer’s judgments for a variety of different probe tasks. The reconstructed surfaces obtained through these procedures almost always appear qualitatively similar to the stimulus objects from which they were generated, although it is generally the case that they are metrically distorted. These distortions are highly constrained, however. They typically involve a scaling or shearing transformation in depth that is consistent with the family of possible of 3D interpretations for the particular source of optical information with which the depicted surface is perceptually specified (see Koenderink et al., 2001).
To summarize briefly, the literature described above shows clearly that human observers can make judgments about the geometric structure (e.g., depth, orientation, or curvature) of small, local, surface regions. Depending on the particular probe task employed, these judgments can sometimes be reasonably reliable for individual observers (see Todd et al., 1997). However, observers’ judgments often exhibit large systematic distortions relative to the ground truth, and there can also be large differences among the patterns of judgments obtained from different observers. It is important to point out that these perceptual distortions are almost always limited to a scaling or shearing transformation in depth. Thus, although observers seem to have minimal knowledge about the metric structures of smoothly curved surfaces, they are remarkably accurate in judging the more qualitative properties of 3D shape that are invariant over those particular affine transformations that define the space of perceptual ambiguity. (See Koenderink et al., 2001, for a more detailed discussion.)
Feature Graphs
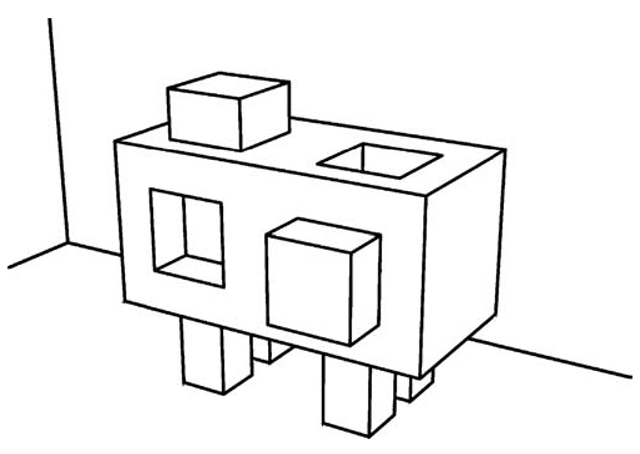
It is important to note that all of the local properties described thus far are metrical in nature. That is to say, it is theoretically possible for each visible surface point to be represented with appropriate numerical values for its depth, orientation, or curvature, and these values can be scaled in an appropriate space so that the distances between different points can be easily computed. However, there are other relevant aspects of local surface structure that are fundamentally nonmetrical and are best characterized in terms of ordinal or nominal relationships. Consider, for example, the drawing of an object presented in Figure 11.3. There is an extensive literature in both human and machine vision that has been devoted to the analysis of this type of polyhedral object (e.g., see Waltz, 1975; Winston, 1975; Biederman, 1987). A common form of representation employed in these analyses is focused exclusively on localized features of the depicted structure and their ordinal and topological relations (e.g., above or below, connected or unconnected). These features are typically of two types: point singularities called vertices, and line singularities called edges. The pattern of connectivity among these features is referred to mathematically as a graph.
FIGURE 11.3 Line drawings of objects can provide convincing pictorial representations even though they effectively strip away almost all of the variations in color and shading that are ordinarily available in natural scenes.
The first rigorous attempts to represent the structure of objects using feature graphs were developed in the 1970s by researchers in machine vision (e.g., Clowes, 1971; Huffman, 1971, 1977; Mackworth, 1973; Waltz, 1975). An important inspiration for this early work was the phenomenological observation from pictorial art that it is possible to convey the full 3D shape of an object by drawing just a few lines to depict its edges and occlusion contours, thus suggesting that a structural description of these basic features may provide a potentially powerful representation of an object’s 3D structure. To demonstrate the feasibility of this approach, researchers were able to exhaustively catalog the different types of vertices that can arise in line drawings of simple plane-faced polyhedra, and then used that to label which lines in a drawing correspond to convex, concave, or occluding edges. Similar procedures were later developed to deal with the occlusion contours of smoothly curved surfaces (Koenderink and van Dorn, 1982; Koenderink, 1984; Malik, 1987).
A closely related approach was proposed by Biederman (1987) for modeling the process of object recognition in human observers. Biederman argued that most namable objects can be decomposed into a limited set of elementary parts called geons, and that the arrangement of these geons can adequately distinguish most objects from one another, in much the same way that the arrangement of phonemes or letters can adequately distinguish spoken or written words. A particularly important aspect of Biederman’s theory is that the different types of geons are defined by structural properties, such as the parallelism or cotermination of edges, which remain relatively stable over variations in viewing direction. Thus, the theory can account for a limited degree of viewpoint invariance in the ability to recognize objects across different vantage points (see also Tarr and Kriegman, 2001).
In principle, the edges in a graph representation can have other attributes in addition to their pattern of connectivity. For example, they are often labeled to distinguish different types of edges, such as smooth occlusion contours, or concave or convex corners. They may also have metrical attributes, such as length, orientation, or curvature. Lin Chen (1983, 2005) proposed an interesting theoretical hypothesis that the relative perceptual salience of these different possible edge attributes is systematically related to their structural stability under change, in a manner that is similar to the Klein hierarchy of geometries. According to this hypothesis, observers should be most sensitive to those aspects of an object’s structure that remain invariant over the largest number of possible transformations, such that changes in topological structure (e.g., the pattern of connectivity) should be more salient than changes in projective structure (e.g., straight versus curved), which, in turn, should be more salient than changes in affine structure (e.g., parallel versus nonparallel). The most unstable properties are metric changes in length, orientation, or curvature. Thus, it follows from Chen’s hypothesis that observers’ judgments of these attributes should produce the lowest levels of accuracy or reliability.
There is some empirical evidence to support that prediction. For example, Todd, Chen, and Norman (1998) measured accuracy and reaction times for a match to sample task involving stereoscopic wire frame figures in which the foil could differ from the sample in terms of topological, affine, or metric structure. The relative performance in these three conditions was consistent with Chen’s predictions. Observers were most accurate and had the fastest response times when the foil was topologically distinct from the sample, and they were slowest and least accurate when the only differences between the foil and standard involved metrical differences of length or orientation.
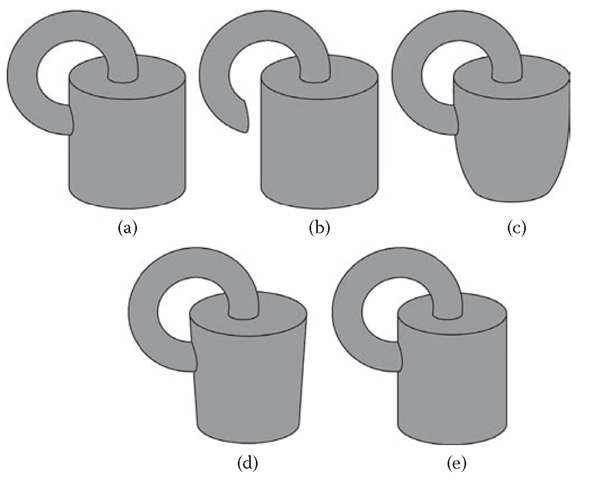
FIGURE 11.4 A base object on the upper left (a), and several possible distortions of it that alter different aspects of the geometric structure; (b) a topological change; (c) a projective change; (d) an affine change; and (e) a metric change. All of these changes have been equated with respect to the number of pixels that have been altered relative to the base object.
A similar result was also obtained by Christensen and Todd (2006) using a same-different matching task involving objects composed of pairs of geons like those shown in Figure 11.4. Thresholds for different types of geometric distortions were measured as a function of the number of changed pixels in an image that was needed to detect that two objects had different shapes. The ordering of these thresholds was again consistent with what would be expected based on the Klein hierarchy of geometries (see also Biederman and Bar, 1999). Still other evidence to confirm this pattern of results was obtained in shape discrimination tasks of wire-frame figures that are optically specified by their patterns of motion (Todd and Bressan, 1990).
The relative stability of image structure over changing viewing conditions is a likely reason why shape discrimination by human observers is primarily based on the projected pattern of an object’s edges and occlusion contours, rather than pixel intensities or the outputs of simple cells in the primary visual cortex. The advantage of edges and occlusion contours for the representation of object shape is that they are invariant over changes in surface texture or the pattern of illumination (e.g., see Figure 11.3), thus providing a greater degree of constancy. That being said, however, an important limitation of this type of representation as a model of human perception is that there are no viable theories at present of how these features could be reliably distinguished from other types of image contours that are commonly observed in natural vision, such as shadows, reflectance edges, or specular highlights. The solution to that problem is a necessary prerequisite for successfully implementing an edge-based representation that would be applicable to natural images in addition to simple line drawings.


